China
Energy Efficiency Where it Really Matters
Mark Levine, Nan Zhou, David Fridley, Lynn Price and Nina Zheng, Lawrence Berkeley National Laboratory
1 Introduction
As the world’s most populous country and the second-largest economy, China’s energy use and energy-related CO2 emissions have been interlinked with its unprecedented economic growth and urbanization. Since economic reforms were first initiated in the late 1970s, China has continued to experience double-digit economic growth with current nominal GDP totaling nearly U.S. $7.3 trillion despite a relatively low per capita GDP of only U.S. $5,184 in 2011. Since China is still in the early stage of industrialization and modernization, the process of economic development will continue to drive China’s energy demand and has already made China the world’s largest CO2 emitter in 2007 and largest energy consumer in 2010.
One sector that has clearly been impacted by China’s rapid economic growth and urban development is the power sector, where electricity demand has grown at an annual average rate of 13 percent over the last decade. At the same time, total installed power generation capacity has tripled from 320 GW in 2000 to 960 GW in 2010. That is, electric capacity of more than 60 percent of the entire U.S. capacity was installed in a decade in China. China’s power sector remains dominated by coal with an 80 percent share, which has important implications for both coal use and energy-related CO2 emissions.
In recent years, China has taken serious actions to reduce its energy consumption and carbon emissions. This has included significant actions affecting the power sector. China’s 11th Five Year Plan (FYP) goal of reducing energy consumption per unit of GDP by 20 percent between 2006 and 2010 was followed by extensive programs to support the realization of the goal. In November 2009, China also committed to reducing its carbon intensity (CO2 per unit of GDP) by 40 percent to 45 percent percent below 2005 levels by 2020. Within the power sector, China’s goal is to raise the share of alternative energy to 15 percent of total primary energy by 2020. Achieving the 2020 goals will require strengthening and expansion of energy efficiency policies in the end-use sectors that consume energy – industry, buildings, appliances, and motor vehicles – as well as further expansion of renewable and nuclear power capacity.

The past decade has seen the development of various scenarios describing long-term patterns of China’s future energy and greenhouse gas emissions. In most of the models used to create the scenarios, however, a description of sectoral activity variables is missing. End-use sector-level results for buildings, industry, or transportation or analysis of adoption of particular technologies and policies are rarely if ever provided in global energy modeling efforts. This is a serious omission for energy analysts and policymakers, in some cases calling into question the very meaning of the scenarios. Energy consumption is driven by the diffusion of various types of equipment, and their performance, saturation, and utilization. These factors, not considered in most models used for scenario building in China, have a profound effect on energy demand. Policy analysts wishing to assess the impacts of efficiency, industry structure, and mitigation policies require a description of drivers that includes saturation of different types of energy-using equipment (and of measures affecting the thermal integrity of the building envelope) and the factors that are responsible for their level of use (or, in the case of the envelope, heat transfer).
Other chapters of this volume examine the various means, policies, and options to reduce the future growth of energy, particularly electricity, and are mostly focused on developed economies. Due to the sheer size of its population, projected growth of its economy, and magnitude of energy consumption, however, China’s evolution in these regards will also have significant impact on global energy trends.
This chapter thus focuses on a China Energy Outlook through 2050, with 2020 and 2030 milestones that assesses the cross-sectoral roles of energy efficiency policies and structural change for transitioning China’s economy to a lower emissions trajectory and examines the likelihood of meeting China’s 2020 goals. This outlook is based on the Lawrence Berkeley National Laboratory (LBNL) China End-Use Energy Model, which addresses end-use energy demand characteristics including sectoral patterns of energy consumption, changes in subsectoral industrial output, trends in saturation and usage of energy-using equipment, technological changes including efficiency improvements, and links between economic growth and energy demand. Two scenarios are developed to evaluate the impact of different levels of energy efficiency and power sector policies on controlling energy demand growth and emission mitigation and progress towards meeting its 2020 goal [1].
Section 2 provides an overview of the LBNL China End-Use Energy Model and its underlying methodology and scenario assumptions. Section 3 covers aggregate energy and emissions modeling results. Sections 4 through 8 review the key sector-specific findings for the residential, commercial, industrial, transport, and power sectors, respectively. This is followed by a brief discussion of sensitivity analyses in section 9 and conclusions in section 10.
2 Modeling Methodology
The LBNL China End-Use Energy Model has been significantly enhanced since its establishment in 2005 and is based on levels of diffusion of end-use technologies and other drivers of energy demand on a sectoral basis and includes both demand and supply-side modules. Built using the Long-Range Energy Alternatives Planning (LEAP) modeling software developed by Stockholm Environmental Institute, this model enables detailed consideration of technological development – industrial production, equipment efficiency, residential appliance usage, vehicle ownership, power sector efficiency, lighting and heating usage – as a way to evaluate China’s energy and emissions development path below the level of its macro-relationship to economic development. Within the energy consumption sector, key drivers of energy use include activity drivers (total population growth, urbanization, building and vehicle stock, commodity production), and economic drivers (total GDP, income), energy intensity trends (energy intensity of energy-using equipment and appliances). These factors are in turn driven by changes in consumer preferences, energy costs, settlement and infrastructure patterns, technical change, and overall economic conditions. From the supply side, the energy transformation sector includes an electricity sector module that can be adapted to reflect changes in generation dispatch algorithms, efficiency levels, fuel-switching, generation mix, installation of carbon capture and sequestration technology, and demand-side management.
This chapter presents two scenarios, Continued Improvement and Accelerated Improvement, further defined below, to represent distinct alternatives in long-term pathways given current trends, currently available and projected efficiency technologies, and policy choices and degree of successful implementation of the policies.
The Continued Improvement Scenario (CIS) assumes that the Chinese economy will continue on a path of lowering its energy intensity. Efficiency improvements in this scenario are consistent with trends in “market-based” improvement and successful implementation of policies and programs already undertaken, planned, or proposed by the Chinese government. We use the CIS as the reference case for evaluating energy savings and emissions reduction potential.
The Accelerated Improvement Scenario (AIS) assumes a much more aggressive trajectory toward current best practice and implementation of important alternative energy technologies as a result of more aggressive and far-reaching energy efficiency policies. Efficiency targets are considered at the level of end-use technologies, with Chinese sub-sector intensities being lowered by implementation of the best technically feasible products and processes in the short to medium term, taking into account the time necessary for these technologies to penetrate the stock of energy-consuming equipment.
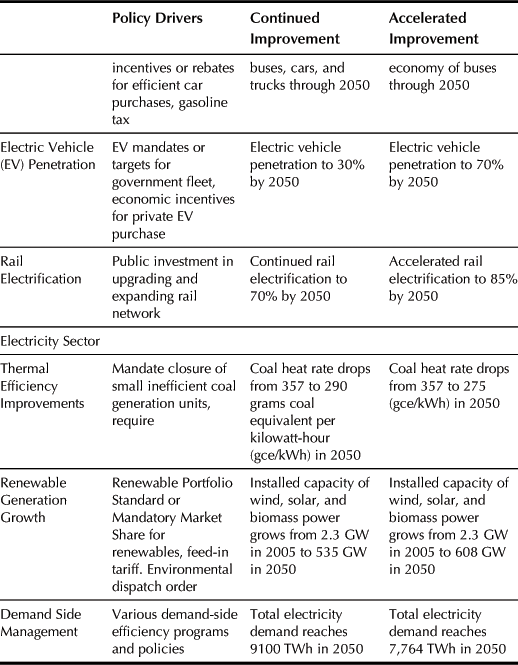
The key energy efficiency policies driving different paces of efficiency improvements in the two scenarios are highlighted in Table 8.1.


3 Aggregate Energy and Emissions Modelling Results
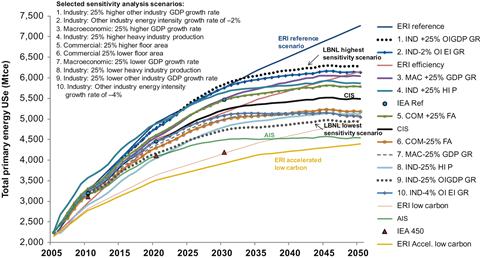
The LBNL modeling results show that by 2050 China’s primary energy consumption will rise continuously in both scenarios, but approach a plateau starting in 2025 for the AIS and 2030 for the CIS (Figure 8.2).

Figure 8.2 Primary Energy Consumption in Selected Scenarios. Note: AIS is Accelerated Improvement Scenario; CIS is Continued Improvement Scenario.
Energy demand grows from 2,250 million tons of coal equivalent (Mtce1) in 2005 to 5500 Mtce (161 EJ) in 2050 under the CIS. Energy demand is 900 Mtce lower – at 4,600 Mtce – in AIS in 2050, a cumulative energy reduction of 26 billion tons of coal equivalent from 2005 to 2050. If sufficient carbon capture and storage (CCS) capacity to capture and sequester 500 MtCO2 by 2050 is implemented under the CIS, total primary energy use would increase to 5,520 Mtce in 2050 due to CCS energy requirements for carbon separation, pumping, and long-term storage, but carbon emissions would decline by 4 percent in 2050.
The notable difference between LBNL’s scenarios and those produced by other research institutions is the shape of the energy and emissions trajectories over the long term. LBNL’s projected energy consumption increases at approximately the same rate as shown in other models until 2025 or 2030 (depending on scenario), but diverges thereafter with a slow down or plateau. Most energy scenarios produced using other models exhibit an extrapolation of growth over the next two decades to 2050, as illustrated in Figure 8.2.
The ERI is China’s Energy Research Institute, whose recent 2009 study results have been converted to IEA-equivalent figures given that ERI follows the convention of using power generation equivalent, rather than IEA and LBNL’s use of calorific equivalent, to convert primary electricity [2]. This conversion of ERI results to the IEA/LBNL convention reduces the gross energy content of electricity generated from renewables and biomass by 66 percent. IEA results are taken from World Energy Outlook 2009 [4].
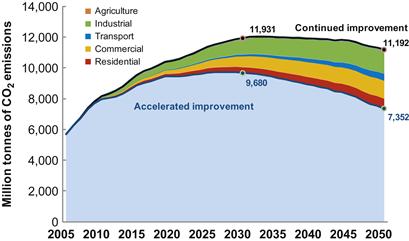
As seen in Figure 8.3, CO2 emissions under both LBNL scenarios approach a plateau or peak in 2025 (AIS) and 2030 (CIS). The CIS reaches a plateau between 2030 and 2035 with 12 billion giga tons (Gt) in 2033, while the more aggressive energy efficiency improvement and faster decarbonization of the power supply under AIS result in a peak between 2025 and 2030 at 9.7 GtCO2 in 2027. The alternative scenarios examined – including China’s Energy Research Institute’s low-carbon and accelerated low-carbon scenarios and the International Energy Agency’s 450 scenario – rely heavily on application of CCS to reduce emissions growth. The LBNL scenarios are much more pessimistic regarding CCS than the other scenarios but nonetheless show growth in CO2 emissions comparable to those of other analyses.
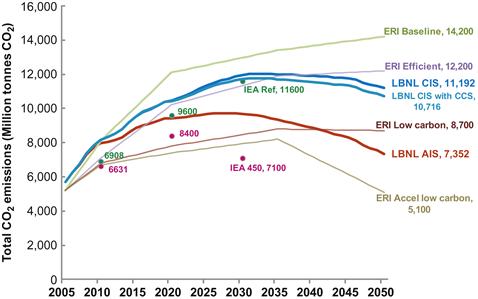
The CIS and AIS are both notable as two of the only three scenarios shown in Figure 8.3 that envision emissions peaks before 2050. In fact, the emissions peak is the earliest in the CIS and AIS, underscoring the important role that energy efficiency policies can play in carbon mitigation in the absence of carbon capture and sequestration.
3.1 Aggregate Results by Fuel and Sector
The share of coal in total primary energy use will be reduced from 74 percent in 2005 to about 47 percent by 2050 in the CIS, and could be further reduced to 30 percent in the AIS (Figure 8.4). Instead, more energy demand will be met by primary electricity generated by renewables, hydro, and nuclear, which could reach 32 percent by 2050 with further decarbonization in the electricity sector under the AIS. Petroleum energy use will grow both in absolute terms and the relative share of overall energy consumption, as a result of an increase in vehicle ownership as well as freight turnover in the transportation sector.
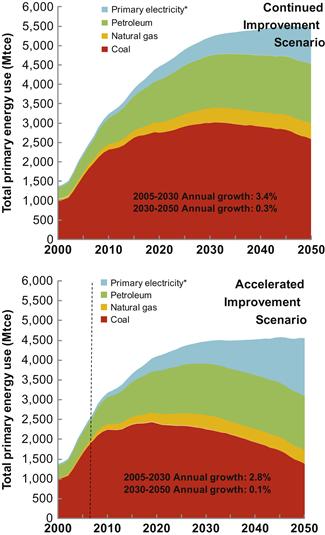
Figure 8.4 Total Primary Energy by Fuel Type, CIS and AIS. *Note: Primary electricity includes hydropower, wind, solar, and other renewables at calorific equivalent for conversion.
The single largest emissions reduction potential among the energy end-use sectors is in the buildings sector, particularly commercial buildings, followed by the industrial sector, as illustrated in Figure 8.5. The industrial sector shows early achievement in emission reduction, but within two decades the buildings sector achieves greater reductions. By 2050, more than half of the annual emissions reduction is in the buildings sector.
Overall, the growth of annual energy demand in China ranges from 3.4 percent (CIS) to 2.8 percent (AIS) between 2005 and 2030, and 0.3 percent to 0.1 percent between 2030 and 2050. In contrast, carbon intensity declines over this period, with annual average reductions of 3.7 percent for the CIS and 4.6 percent for the AIS from 2005 to 2050 (Figure 8.6). China will meet and even surpass its 2020 carbon intensity reduction goal of 40 percent to 45 percent under the CIS and AIS, respectively. Achieving such results in AIS will require strengthening or expanding energy efficiency policies in industry, buildings, appliances, and motor vehicles similar in scale and impact to the possible policy trajectories described in Table 8.1, as well as further expansion of renewable and nuclear power capacity.

With aggressive implementation of energy efficiency policies – including expansion of current incentives for energy efficiency and new incentives for buildings and small industries; increasing stringency of standards for appliances, whole buildings, and selected industrial equipment; development of standards and/or other policies that address systems in addition to individual pieces of equipment; large and continuing programs to enhance the capabilities of energy efficiency professionals; incorporation of energy efficiency as criteria for success in operation of industrial and agricultural enterprises, as well the performance of cities and counties (i.e., changing the evaluation system from purely economics to energy efficiency and environment); and decarbonization of the electricity sector under the AIS – China could reduce its 2005 carbon intensity by as much as 88 percent by 2050. Decarbonization of electricity will require continuation and expansion of the large-scale deployment of carbon neutral energy supply technologies (wind, solar, nuclear, zero-carbon biomass conversion, and hydropower) and using the experience to reduce implementation and operational costs of these systems. Successful energy efficiency policies depend not only on the promulgation of laws and regulations at the level of the national government but also effective implementation at the local level. A mix of incentives (for successful implementation) and disincentives (for lack of diligence) may be needed to improve implementation at the local level.
In light of the significant but differing energy savings and emissions reduction potential among the different end-use sectors, more detailed findings of projected energy – and electricity in particular – consumption trends and emissions implications for each end-use sector are presented in the sections below.
4 Residential Buildings Sector Findings
Although the ownership of many electricity-consuming appliances has become saturated in urban areas, new sales will remain strong over the period because of the rise in urbanization, with over 470 million additional people expected to become urban residents by 2050 (Figure 8.7).

Figure 8.7 Historical and Projected Population and Urbanization Trends. Source: Actual data from[3].
As a result, electricity use from appliances will continue to grow rapidly. Electricity use reached 2.5 times 2000 levels in just ten years, growing from 170 TWh in 2000 to 430 TWh in 2010. Urban fuel consumption from space heating has also more than doubled in that decade and will continue its rapid growth in both the CIS and AIS due to increases in urban population and heating intensity. Rural electricity consumption will continue increasing in spite of the reduction in rural population due to increases in per household use of lighting and appliances. Biomass consumption will decrease considerably, with substitution of or conversion into commercial fuels.
Residential primary energy demand will grow rapidly until 2025 or 2030. In CIS, demand rises between 2005 and 2030 at an average annual rate of 2.8 percent. After 2030, it increases by only 0.6 percent per year. This slowing of growth is largely due to saturation effects, as the process of urbanization will be largely complete, most households will possess all major electricity-consuming appliances by 2030, and efficiency improvements in heat distribution will be largely complete. In spite of the saturation of major appliances, per household electricity consumption will experience some growth as rising incomes contribute to increased usage, larger refrigerators, more lighting, and more devices using standby power. Figure 8.8 shows the 2005 and projected 2050 residential electricity consumption shares by major end-use under the CIS, with electricity consumption dominated by appliances and space heating.
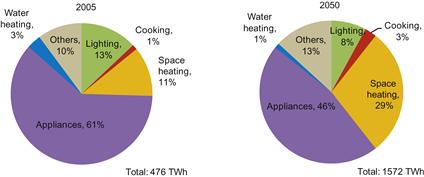
Figure 8.8 Residential Electricity Consumption Shares by End-Use, 2005 (left) and 2050 in the CIS (right).
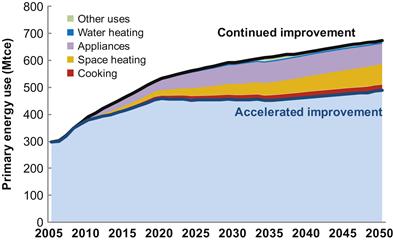
The significant opportunity for reducing energy, and particularly electricity, consumption in households lies in two key areas: improvement of equipment efficiency through implementation of stringent efficiency standards and labeling programs and tightening of thermal shell of residential buildings. Figure 8.9 shows the energy savings opportunity in the residential sectors distributed across end-uses, with appliances and space heating having the largest savings potential from efficiency policies. From 2005 to 2050, accelerated adoption and implementation of more aggressive efficiency policies such as strengthened appliance efficiency standards and expansion of the China Energy Label to reach near international best practice by 2020 could lead to total cumulative CO2 emissions reduction of 18.4 GtCO2 under the AIS.
5 Commercial Buildings Sector Findings
Energy demand in the commercial buildings sector is currently growing rapidly. However, growth will slow in the medium term, reaching a plateau by about 2030 due to declining growth in total commercial sector employees and commercial floorspace approaching saturation. Total commercial building floorspace may saturate in the short term, but end-use intensity has much room to grow before reaching current levels in industrialized countries. In particular, the lighting, office equipment, and other electrical plug loads in commercial buildings will grow dramatically through 2030, but then level off thereafter in CIS.
The main dynamic of energy consumption in commercial buildings revealed by this study is that energy growth will be largely dominated by intensity increases, rather than overall increases in commercial floor area. The number of workers available to this sector will limit increases in commercial building space in China’s future. Although the economic activity in this sector will continue to gain in significance, physical infrastructure will grow at a much slower rate than value-added GDP. In contrast, Chinese commercial energy use per square meter is still relatively low. For example, space cooling and equipment energy intensity is only a fraction of the current Japanese level. Thus, with rising commercial end-use energy intensity expected, building efficiency policies such as tighter building design codes, building efficiency and green building labeling programs, equipment efficiency standards, and phase-out of inefficient lighting will be important in controlling energy demand growth and CO2 mitigation. Annual carbon mitigation under the AIS could reach 1180 MtCO2 by 2030, or cumulative reduction of nearly 26 GtCO2 emissions (Figure 8.10).
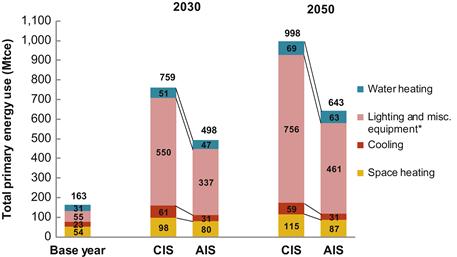
Figure 8.10 Commercial Primary Energy by End-Use. *Lighting and misc. equipment refers to electricity-consuming equipment such as computers, printers, audiovisual equipment, elevators, pumps, etc.
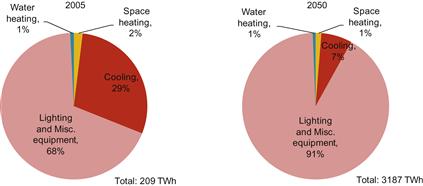
In final energy use terms, most of the electricity demand in commercial buildings will be driven by lighting and electric equipment (i.e., plug loads) usage and cooling to a smaller extent. As seen in Figure 8.11, electricity consumption by 2050 will be heavily dominated by lighting and equipment usage with much smaller shares of consumption by cooling, space heating, and water heating. Consequently, efficiency improvements in lighting and equipment will have the greatest electricity savings potential under the AIS, accounting for 90 percent of the 1044 TWh possible savings by 2050 followed by cooling efficiency improvements with 8 percent of savings.
6 Industrial Sector Findings
Within industry, the energy consumption of the seven sectors singled out in China’s long-term development plan for substantial energy efficiency improvements – cement, iron and steel, aluminum, ammonia, glass, paper, and ethylene – will gradually decline relative to other sectors, though still account for 47 percent of total energy consumption in 2050, down from 61 percent in 2005 in the CIS. Under both scenarios, a leveling in the output of cement and some chemicals is expected in the near term while others such as steel, aluminum, and glass production will increase at an annual average rate of 3 percent until 2020 and then start leveling off or declining. In the case of iron and steel and cement in particular, China’s expected transition from rapid industrialization and infrastructure development to more intensive growth and expansion in the services sector after 2010 underlies the slowdown and eventual decline in total iron and steel output and in the growth of the cement industry. Even so, China will remain the world’s largest producer of these two commodities and will continue to produce enough steel and cement to meet domestic demand.
Among the industries in the “other industry” category, steady increases in energy consumption growth are expected from the refining sector, the coal mining and extraction sector, and the oil and gas exploration and production sector as the final energy intensiveness of fossil fuel extraction increases over time with declining energy return on energy invested as well as from manufacturing and other light industry.
Energy demand in China is currently dominated by a few energy-intensive sectors, particularly by the main construction inputs – cement and iron and steel. The recent explosion of construction in China has had a driving role in these industries, and therefore Chinese energy demand as a whole. Because demand for energy-intensive industrial outputs such as cement, iron, and steel, and aluminum are closely linked to construction, the slowing of this construction boom will therefore have a major impact as seen by the peaking of industrial primary energy use around 2030.
The energy use of each of these sub-sectors in absolute terms all decline modestly over time. The only exception is in energy use by the ethylene sub-sector, which grows notably from a 4 percent share of total industrial energy use in 2005 to 11 percent share in 2030 (Figure 8.12). The model results for projected CIS and AIS industrial energy use reflect key differences in only efficiency improvements, with a 290 Mtce reduction in energy use under the AIS scenario in 2030, and 274 Mtce in 2050. This translates into annual CO2 emission reduction of 1550 MtCO2 in 2050, or 40 percent of all emission reductions, and cumulative reduction of nearly 39 GtCO2 by 2050.

Figure 8.12 Industrial Primary Energy Use by Subsector. *Other Industry includes manufacturing, chemicals, light industry and all other small industrial subsectors.
Iron and steel and aluminum are the two single largest industries in terms of electricity consumption, although the “other industry” sub-sector representing manufacturing, chemicals, and other light industry consumes the most electricity in absolute terms (Figure 8.13). From 2010 through 2050, the relative share of electricity consumption by the iron and steel sub-sector will continue to grow with greater production from electric arc furnaces while the electricity consumption shares of cement and paper sub-sectors decline.

Figure 8.13 Industrial Electricity Consumption by Subsector, 2005 (left) and 2050 in the CIS (right).
The more efficient AIS development trajectory has differing impacts on energy reduction in each of the seven industrial sub-sectors (Figure 8.14). Between 2005 and 2050, the iron and steel, other industry and cement sub-sectors comprise the largest energy reduction potential under both the CIS and AIS when compared to other sub-sectors. The ethylene sub-sector stands out as an exception with negligible energy savings under AIS, partly because energy consumption actually grows from 2010 through 2030 under both scenarios. Electricity savings through accelerated efficiency improvements under AIS will be realized in three key sub-sectors – iron and steel, cement, and aluminum. By 2050, each of these three sub-sectors will contribute nearly one-third of the total industrial electricity savings of 153 TWh under the AIS.

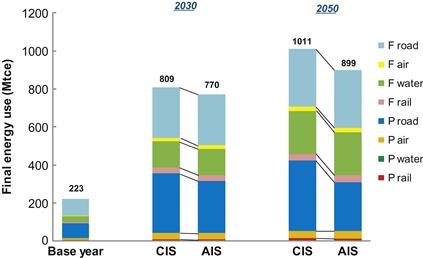
7 Transport Sector Findings
The greatest growth for energy demand in the transport sector will be from passenger road transportation, with urban private car ownership expected to increase to over 356 million vehicles by 2050. Electrification of rail and vehicles will also increase electricity demand of the transport sector, while reducing gasoline and diesel demand. China has actively promoted transport electrification in recent years, setting specific targets for more efficient electric rail. In addition, subsidy programs have been launched to accelerate the market entry of electric vehicles and tap into their energy and environmental benefits (e.g., reducing heavy reliance on oil) and suitability for the predominantly short intra-city driving patterns in Chinese urban areas. Under CIS, total transport electricity demand will increase from 33 TWh in 2005 to 425 TWh in 2050, with a 65 percent share for electrified rail and 35 percent share for electric vehicles.
In primary energy terms, the impact of improved efficiency in motor vehicles and accelerated electrification of passenger cars and the national rail system will lower total transportation energy use in 2050 by 107 Mtce compared to the CIS (Figure 8.15). Increasing the 2050 proportion of electric cars from 30 percent in the CIS to 70 percent in the AIS reduces annual gasoline demand by 100 million tonnes of oil equivalent, but increases annual electricity demand by an additional 265 TWh in 2050 as a result of electric vehicles replacing more and more of gasoline cars and some hybrid cars over time. This produces the unintended result that China becomes a gasoline exporter, as demand for other oil products is not reduced commensurately.
Power decarbonization has important effects on the carbon mitigation potential of switching to electric cars technology. Greater transport electricity use under the AIS could result in net CO2 reduction on the order of 5 to 10 MtCO2 per year before 2030 and as much as 109 MtCO2 by 2050 because the AIS power supply is less carbon intensive than CIS power supply (Figure 8.16). However, in the absence of any decarbonization in the power sector, electric vehicles will increase CO2 emissions.

8 Electricity Sector Findings
The electricity sector accounts for a large growing share of China’s energy use and related carbon emissions. On the demand side, AIS results in 15 percent lower total electricity generation in 2050 than CIS. The net electricity reduction of 1285 TWh under AIS in 2050 includes a total reduction of 1540 TWh across the commercial, residential, and industrial sectors, offset by an increase of 255 TWh from electrification of the transport sector. The majority of the electricity savings will be from efficiency improvements in the commercial sector, followed by smaller savings in the residential and industrial sectors (Figure 8.17).
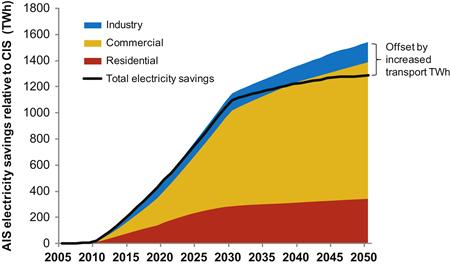
Figure 8.17 The AIS Net Total Electricity Savings and Savings Potential by End-Use Sector. Note: Transport sector is not shown in this figure because it had negative savings (i.e., net increase) in electricity consumption under AIS. The net increase in transport electricity demand under AIS can be estimated by the difference between the sum of the residential, commercial and industry electricity savings and the total electricity savings.
On the supply side, efficiency improvements and fuel substitutions bring the 2050 coal share of total electricity generation from 49 percent in the continued improvement scenario to 10 percent in the accelerated improvement scenario (Table 8.2).

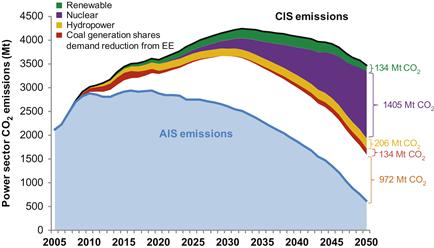
Decarbonization also plays a significant role in carbon emission reduction in the electricity sector and substantially outweighs the potential impact of CCS. Besides the CIS and AIS scenarios of electricity sector development, an additional scenario was added to represent the implementation of CCS to capture 500 MtCO2 by 2050 under the CIS pathway of efficiency improvement and fuel shifting. Of the three scenarios, AIS requires the least primary energy and produces significantly lower energy-related power sector carbon dioxide emissions than either the CIS or CCS. In fact, AIS electricity sector emissions peak just below 3 GtCO2 in 2019 and begin declining rapidly thereafter to 0.6 billion tons in 2050. The CCS base scenario results in 476 Mt fewer emissions in 2050 than the CIS scenario with a 1.4 percent increase in the total primary energy requirement for carbon capture, pumping, and sequestration.
Within the electricity sector, the greatest carbon emissions mitigation potential under AIS is from direct electricity demand reduction as a result of more aggressive policy-driven end-use efficiency improvements in the industrial, residential, commercial, and transport sectors. Figure 8.18 illustrates five wedges that lead to electricity sector emissions reductions of almost 3.5 GtCO2 per year by 2030, where the solid wedges represent CO2 savings from various electricity sector changes and the stripped wedge represents CO2 savings from electricity demand reduction. One of the largest electricity sector mitigation potentials is from end-use efficiency improvements that lower final electricity demand and the related CO2 emissions, which is about half of total CO2 savings before 2030 and then one-third of total CO2 savings by 2050. These results emphasize the significant role that energy efficiency improvements across all end-use sectors (see sections 4 through 7) will continue to play in carbon mitigation in the electricity sector (vis-à-vis lowering electricity demand), as efficiency improvements and can actually outweigh CO2 savings from decarbonized electricity supply through greater renewable and non-fossil fuel generation prior to 2030.
9 Sensitivity Analyses
Sensitivity analyses of drivers in the key economic sectors were conducted to evaluate uncertainties that exist in the model. In each sensitivity analysis scenario, a specific variable such as the urbanization level was tested for its impact on total primary energy use under the CIS, ceteris paribus. The results of the sensitivity parameters tested that had the highest level of uncertainties with changes of at least 300 Mtce (or 5 percent of total primary energy use) in 2050 are presented in Figure 8.19.
Among the different sensitivity analysis scenarios tested, variables in the industrial sector had the largest impact on total primary energy use, implying that there is a higher level of uncertainty surrounding these variables. For example, a 25 percent increase in the growth rate of other industry GDP that directly affects steel production for use in manufacturing can result in an increase of nearly 800 Mtce in total primary energy use by 2050. Likewise, uncertainties in the levels of heavy industrial output and in the energy intensity of “other industry” can result in changes in total primary energy use in the range of 300 to 700 Mtce in 2050.
The other variables included in the sensitivity analyses that resulted in medium (impact of greater than 50 Mtce or 1 percent) or low (impact of less than 50 Mtce) uncertainties are outlined in Table 8.3.
Table 8.3
Parameters of Medium- and Low-Impact Sensitivity Analyses
| Sensitivity Scenario Name | Sensitivity Scenario Description | Sensitivity Impact |
| MAC 67% Urban | Macroeconomic: 67% urbanization by 2050 | Medium |
| RES +25% FA | Residential: 25% more floor area per capita | Medium |
| COM 25 Life | Commercial: 25 years building lifetime | Medium |
| COM 50 Life | Commercial: 50 years building lifetime | Medium |
| COM +25% LOI | Commercial: 25% higher lighting & other end-use intensity | Medium |
| COM −25% LOI | Commercial: 25% lower lighting & other end-use intensity | Medium |
| TRA 40% EV AIS* | Transport relative to the AIS*: 40% Electric Vehicle share of cars by 2050 | Low |
| TRA 20% EV CIS | Transport: 20% Electric Vehicle Share of cars by 2050 | Low |
| TRA −25% OFA | Transport: 25% lower Ocean Freight Activity | Low |
| IND 60% EAF | Industry: 60% EAF furnace penetration in steel production by 2050 | Medium |
| IND 25% EAF | Industry: 25% EAF furnace penetration in steel production by 2050 | Low |
10 Conclusions
As China continues to pursue its social development goals, demand for energy services will continue to grow, presenting fundamental challenges as economic growth and projected rapid urbanization will significantly drive up energy demand and CO2 emissions if there are not changes in energy efficiency and energy supply structure. This study evaluated how China can maintain its development trajectory and provide basic wealth to it citizens while being energy-sustaining, assessed the role of energy-efficiency for transitioning China’s economy to a lower greenhouse gas trajectory, and evaluated China’s long-term domestic energy supply in order to gauge the potential challenge China may face in meeting long-term demand.
By 2050, primary energy consumption will rise continuously in both scenarios but reach a plateau around 2040, with a cumulative energy reduction of 26 billion tons of coal equivalent under the AIS from 2005 to 2050. The plateau is reached in both scenarios due to saturation effects (e.g., most households will possess all major electricity-consuming appliances by 2030 and electrical plug loads in commercial buildings will level off around 2030) and efficiency policy effects (e.g., strengthened appliance and equipment efficiency standards). Future energy demand reduction potential is greatest in the industry sector in the earlier years and from the buildings sector in the long run. In terms of electricity consumption, the greatest potential for reduction under AIS is in the commercial sector, followed by the residential and industrial sectors.
CO2 emissions under both scenarios could experience a plateau or peak around 2030, with AIS peaking slightly earlier at 9.7 GtCO2 as a result of more aggressive energy efficiency improvement and faster decarbonization of the electricity supply, coupled with the electrification of passenger cars and the national rail system. The single largest end-use sector emission reduction potential could be seen in the buildings sector, particularly commercial buildings, followed by the industry sector. Further reduction of CO2 under these scenario assumptions would require even higher levels of non-carbon-emitting electricity. The total national emissions mitigation potential of moving from a CIS to AIS trajectory of development is 3.8 GtCO2 in 2050 with the power sector having the greatest mitigation potential.
Both the CIS and AIS scenarios demonstrate that with continuous improvement, the goal of 40 percent carbon intensity reduction by 2020 announced in 2009 is possible, but will require strengthening or expansion of energy efficiency policies in industry, buildings, appliances, and motor vehicles, as well as further expansion of renewable and nuclear power capacity. These results emphasize the significant role that energy efficiency policies and subsequent improvements will continue to play in decreasing the growth of energy demand and leading China on a lower carbon development pathway. The crucial impact of energy efficiency improvements on carbon mitigation is most readily apparent in the power sector (vis-à-vis lowering electricity demand), as efficiency improvements and can actually outweigh CO2 savings from decarbonized power supply through greater renewable and non-fossil fuel generation prior to 2030.
References
1. Zhou N, Fridley D, McNeil M, Zheng N, Ke J, Levine MD. China’s energy and carbon Emissions Outlook to 2050. Berkeley, CA: Lawrence Berkeley National Laboratory; <http://china.lbl.gov/publications/Energy-and-Carbon-Emissions-Outlook-of-China-in-2050;>; 2011.
2. China Energy Research Institute (ERI). 2050 china energy and CO2 emissions report (CEACER) Beijing: Science Press; 2009; [in Chinese].
3. National Bureau of Statistics. Various years. China statistical yearbooks. Beijing: China Statistics Press.
4. International Energy Agency (IEA). World energy outlook 2009 Paris: OECD Publishing; 2009.
1Mtce is the standard energy unit used in China. 1 Mtce is approximately equivalent to 29.3 PJ.