Energy Efficiency Finance, A Silver Bullet Amid the Buckshot?
Theodore G. Hesser*
1 Introduction
A lack of project financing consistently ranks near the top of the many problems facing energy efficiency implementation in commercial, multi-, and single-family residential buildings. A global survey of decision makers responsible for energy use in the built environment conducted by Johnson Controls, the International Facilities Management Association, and the Urban Land Institute revealed that the single greatest barrier to pursuing energy efficiency opportunities was a lack of funding [1]. Creative financing solutions can solve this problem by moving debt off balance sheets for businesses, property owners, and individual homeowners. The trick is navigating the interests of existing lien holders on a property while simultaneously resolving many of the split incentives issues that currently stymie viable projects.
Public buildings have found such a balance in the form of an energy savings performance contract (ESPC). Of all the viable financing models, the ESCO industry’s ESPC financing model, at $4 to 5 billion/year, is the only debt mechanism to have gained any scale. Yet this model has seen very little penetration in commercial, multi-, or single-family residential buildings. Fortunately, there are numerous debt financing models that could open up these segments, such as energy efficient mortgages (EEMs), property assessed clean energy (PACE), efficiency services agreements (ESAs), utility on-bill finance, and virtual utilities. Each possesses unique challenges and advantages and is better suited for particular building segments. Analysis by Bloomberg New Energy Finance indicates that a higher rate of building retrofits, enabled by such mechanisms, could lead to an annual market for energy efficiency expenditure in the built environment of $28 to 30 billion per year in the medium term. Such a surge in retrofit finance would reduce projected U.S. load growth by 20 percent – reducing from an annualized average of 0.9 percent per year to 0.7 percent between now and 2020.
For reference, total energy efficiency expenditure in the built environment is estimated to be $18 to 20 billion in the United States in 2010. This figure is still largely representative today. Out of this total, $14.4 billion can be accounted for through particular mechanisms (Figure 20.1), while an additional $3.5 to 5.5 billion is estimated to be spent directly by homeowners, landlords, small business owners, real estate companies, and corporations.
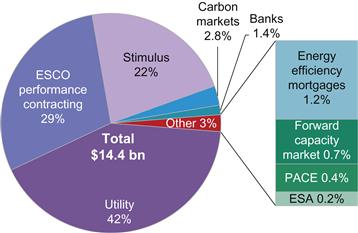
Figure 20.1 U.S. energy efficiency expenditure (disclosed amounts only), 2010 ($ billion). Source: Bloomberg New Energy Finance DOE, CEE, PJM, ISO-NE, public announcement. Note: ESCO ESPC revenue is projected from 2008. “Stimulus” dollars represent strictly energy efficiency retrofit dollars from various programs. Banks represent commercial bank funds earmarked for sustainable infrastructure funds and sustainable energy utilities. PACE stands for “property assessed clean energy.” ESA stands for “efficiency services agreement.”
By far the largest sources of funding for energy efficiency in the United States are direct utility expenditure and ESCO financing. While the latter is financed by third-party debt, the former is direct equity investment – as is the majority of efficiency investment today. Energy efficient mortgages (EEMs), property assessed clean energy (PACE) bonds, and efficiency services agreements (ESAs) are notable exceptions, and are discussed in detail in later sections.
Having said this a small portion of utility expenditure does go towards on-bill finance programs, where energy efficiency debt is repaid through a utility bill, and the collateralization of revolving loan funds that are seeded by an equally small portion of government stimulus dollars. Analysis by Bloomberg New Energy Finance indicates that these utility and stimulus funds tally to $226 million in debt financing per year [5]. Add to this the $461 million/year from ESAs, EEMs, PACE bonds, and bank loans to sustainable energy utilities and efficiency infrastructure funds and debt financing for efficiency sums to $657 million/year (excluding the $4.2 billion in ESCO revenue) [2,3,4,6,10].
Thus, only 25 percent of the $18 to 20 billion annual investment in energy efficiency is financed via debt vehicles. Compare this with the $16 trillion U.S. housing market, which is financed by over 60 percent debt through mortgages, and it is clear that even allowing for the different sizes of these markets, energy efficiency financing is far from mature and efficiency itself is still far from an integral part of the real estate industry. Thus, the energy efficiency industry, as a facet of the wider real estate industry, is woefully underfinanced.
Aside from the numbers game of how much money comes from which source, the most salient point to draw from Figure 20.1 is that utilities sit in the driver’s seat of the entire energy efficiency industry. A review of the rapid rise of state-level energy efficiency resource standards and decoupling policies (Figures 20.2 and 20.3) offers a persuasive reason as to why. Of particular interest is the spike in the adoption of such policies beginning around 2006. Total utility expenditure on energy efficiency incentives tripled from $1.4 billion to $4.6 billion over the same timeframe. Modeling by Bloomberg New Energy Finance indicates that this market size will increase to a conservative $10.7 billion by 2020 as states adopt new policies, reconcile conflicting policy measures, and ramp up reduction targets.


Figure 20.3 Number of states adopting EERS in the United States, 1999–2010. Source: Bloomberg New Energy Finance, American Council for an Energy Efficient Economy (ACEEE), regulatory filings. Note: For the purposes of categorization, this paper considers a state “decoupled” if one or more utilities have been granted PUC approval to decouple.
2 Decoupling
In a traditional utility business model, revenue and profit are tied very closely to kWh sales. Decoupling is designed to break a utility’s throughput addiction by separating its ability to recover fixed costs from volume of sales. Non-decoupled utilities cannot recoup the cost of efficiency investments and find that their revenue shrinks as electricity or natural gas use declines. Such a policy structure was advantageous during the grid’s expansion as it incentivized utilities to grow quickly, which in turn accelerated the United States’ industrialization.
Today, this policy structure is viewed by many as economically inefficient and environmentally irresponsible. Energy efficiency measures are widely regarded as the least-cost, fastest-acting resources in a utility’s portfolio. For energy efficiency to prosper, utilities must be rewarded for selling fewer kWh – a reversal of decades-old incentives. Still, some thought leaders content that decoupling is fundamentally flawed in that it relies on utilities to eat their own lunch. Such a line of reasoning contends that open markets for negawatts and negawatthours to compete toe-to-toe with generation units are the only viable way to scale the energy efficiency industry.
Successful energy efficiency programs in decoupled service areas generally lead to increased electricity rates, unless otherwise usurped by unexpected economic growth. In an industry-wide assessment of 88 gas and electric utilities, the Regulatory Assistance Project found that one-fifth of the retail rate adjustments exceeded a 2 percent increase with an average residential impact of $2.00 a month [15]. However, the successful implementation of energy efficiency programs also implies less overall consumption. The combination of these two effects results in lower energy bills if the levelized cost of energy (LCOE) of the efficiency resource in question is lower than that of any alternative supply-side resource. The LCOE of efficiency measures between 0 and 5 cents/kWh, averaging 3 cents/kWh. This is indeed cheaper than constructing a new combined-cycle natural gas facility, put at closer to 8 to 13 cents/kWh. The Institute for Energy Efficiency (IEE) calculates that the average yield of utility efficiency investments has risen from 3.6 cents/kWh to 4.1 cents/kWh over 2007 to 2009 with inflation being the primary culprit.
The economic efficiency benefits of decoupling have been generally accepted for decades; yet the breakthrough in utility decoupling did not occur until 2007 (Figure 20.2) – driven by decades of advocacy and mounting institutional acceptance – rather than one immediate catalyst. After 2007, the recession caused the growth rate of electricity retail sales to reverse from 1.6 percent annually (1996–2007) to −2.3 percent (2007–10). This reversal of 3.9 percentage points could have further incentivized utilities to pursue mechanisms for lost revenue adjustment.
The year 2010 saw another five states decouple, at least in part due to the American Recovery and Reinvestment Act’s (ARRA) appropriation of $3.1 billion for state energy efficiency and conservation grants contingent upon PUCs “seeking” electric and gas utility decoupling. As of February 27, 2011 the DOE had spent $1.03 billion (33 percent) of the state energy program appropriation. State PUCs will likely be more inclined to approve decoupling bids over the next few years, and utilities will be more inclined to place those bids, as a consequence of the ARRA’s efficiency grants. To place the size of these grants in perspective, they effectively double the 2009 market size of ratepayer-funded efficiency expenditures in the United States.
3 Energy Efficiency Resource Standards
Decoupling removes the disincentives for utility energy efficiency investment but it does not actually incentivize efficiency investment. This requires a policy structure that sets mandatory reduction targets with teeth or allows utilities to profit from the system’s increased economic efficiency. Such a policy mechanism can be found in the form of an energy efficiency resource standard (EERS).
An EERS is an energy efficiency target written into law by state legislature. It typically specifies reductions in electricity or gas use as a percentage of annual sales and in some cases as a percentage reduction in peak demand. Participants are incentivized to meet the target through penalty charges and/or performance incentives. The former are levied by the secretary of the state in question and are set at a minimum of $ 50/MWh, $ 5/MMbtu gas, of unrealized savings below a state target. A second tier of civil penalties can be levied at a minimum of $100/MWh, $10/MMbtu, if a utility fails to adequately document savings.
In many ways, a power company is exposed to the most risk when implementing an EERS. It is held responsible for the design and implementation of the efficiency program and is subject to the penalties associated with non-compliance. Hence, it is atypical for a utility to lobby for an EERS. Any funds collected through penalty fees are reinvested in additional energy efficiency program. An EERS penalty fee, or an alternate compliance payment, effectively caps the maximum obtainable price of an energy saving certificate.
EERS targets have generally evolved from mandating spending to mandating savings. While it is administratively easier to mandate spending, it is politically preferred and economically more sensible to mandate savings. Incentivizing savings – and allowing utilities to share in the system-wide benefits achieved – is regarded to be the most effective motivation to meet – and exceed – EERS targets. ACEEE reported in a survey of selected “best practice” utilities that the average utility incentive earned is approximately 11 percent of the net benefits achieved [16].
A few states have included efficiency targets within existing renewable portfolio standard (RPS) policies. Because efficiency investments are less expensive per kWh than renewable energy investments, a floor on renewable energy procurement (or a ceiling on energy efficiency contributions) is typically established. Figure 20.4 gives a geographical overview of state efficiency policies, including states with EERS carve-outs within RPS policies.

Figure 20.4 Electric utility efficiency policy in the United States. Source: NRDC, DSIRE, regulatory filings, Bloomberg New Energy Finance.
Figure 20.4 illustrates the patchwork of state approaches to electric utility efficiency policy. The light grey states that have not adopted electric efficiency policies are all stalwart Republican states, while Democratic states have shown more willingness to adopt utility efficiency policies. Energy and economic efficiency are not themselves partisan issues, but the methods by which efficiency is achieved is inherently political. If deregulated competitive markets are synonymous with Adam Smith’s invisible hand, PUC regulated efficiency spending is very much its Keynesian antithesis. The political dialogue surrounding new state EERS and decoupling bids are grounded in this philosophical divide.
Of the 14 states that have adopted electric decoupling, just three (AZ, MT, ID) are historically red (Republican). Eight of the 22 states that have adopted gas decoupling are Republican (AR, NC, IN, NV, AZ, WY, UT). Of the 21 states that have not legislated EERS, only two are historically blue (DE, NJ), and both of these have pending decoupling bids [17]. These political realities could limit the expansion potential of EERS and decoupling policies in the United States, as well as the continued growth of the total market size. Nevertheless, it is likely the case that even Republican dominated states will ultimately see the benefits of increased efficiency and that utility efficiency expenditure will continue to increase as states ramp up reduction targets, resolve conflicting policy structures and adopt new EERS and decoupling policies.
Of the various states with an RPS/EERS policy structure, Connecticut has been the only one to supplement it with electric utility decoupling. Most of these states are unlikely to implement decoupling because a REC-driven market approach to an RPS policy does not align with the consolidation of regulatory power through decoupling.
Similar to decoupling, EERS policy adoption has exhibited tremendous growth during the past five years (Figure 20.3). The complementary nature of the two policy structures has led efficiency advocates to push PUCs, state legislators and utilities towards the use of both mechanisms together. Figure 20.5 illustrates the increase in per capita efficiency budgets in decoupled states with EERS. The average electric utility budget for states with both mechanisms was $28.4/capita while it was only $14.1/capita for states with either decoupling or an EERS. States with neither mechanism had an average of just $7.4/capita.

Figure 20.5 Electric program budgets for energy efficiency and load management by state, 2010 ($/capita). Source: Consortium for Energy Efficiency (CEE) and Bloomberg New Energy Finance. Note: CEE’s data is collected via voluntary survey and represents 73 percent of the utility service companies in the United States. The missing 27 percent represents small municipalities and a few states that did not provide information (DE, LS, WV, and AK). PNW represents the Pacific Northwest states of ID, OR, WA, and MT.
Hawaii (HI), Arizona (AZ), and Michigan (MI) are the only three with both mechanisms to sit below the state average of $16.2/capita. However, they only decoupled in 2010 (HI and AZ in the last quarter of the year), after state budgets had been predetermined. These states are expected to significantly boost their efficiency budgets and expenditure this year.
On the whole, EERS mandates have proven to be a cheap and effective way to produce efficiency savings. However the most effective framework for energy efficiency leverages both EERS and decoupling policy. Figure 20.5 illustrates that average per capita energy efficiency expenditure doubles on a statewide basis when decoupling policy is added on top of an existing EERS.
5 Summary of New Financing Mechanisms
This section details existing financing mechanisms, strengths, weaknesses, and their current state of play.
The ESCO energy savings performance contract (ESPC) model is the only debt vehicle that has reached scale, but for the moment it is successful only in the relatively small federal, municipal, university, schools, and hospital (MUSH) building segments. These two segments are responsible for 82 percent of ESPC revenue, but only 12 percent of the total energy spent in U.S. buildings. The markets with the most potential – residential and commercial buildings – remain barely touched.
The apparent lack of activity in debt financing for energy efficiency belies a huge amount of effort behind the scenes to innovate and create new avenues for capital to flow into projects. There is recognition that on the one hand, investors are looking for ways to put money into efficiency projects and funds, while on the other hand, landlords and tenants (whether commercial or residential) need to see barriers lowered. The new financing mechanisms that are the focus of this chapter aim to solve both sides of this equation.
The barriers to energy efficiency finance differ by building segment, and so do the potential solutions. For most individuals, energy efficiency loans exist in the financing twilight zone between $3,000 and $15,000 – too big for a credit card and too small for a home equity loan. The average American holds $3,000 to $7,000 in available cash-on-hand, and would need financing to undertake any sizeable retrofit. However, roughly 60 million Americans lack bank accounts and as many as 40 million more possess “nuked” credit scores (i.e., a FICO score less than 600). Therefore, a full one-third of all U.S. citizens lack viable access to financial services. It is possible that tens of billions of dollars in energy efficiency projects are not being financed each year as a result of this financing gap.
In the multi-family residential market, low-income households have the greatest energy costs relative to income, averaging 14 to 20 percent of annual earnings compared to 4 to 7 percent for median households [6]. This low-income demographic tends to live in multi-tenant buildings that are, on average, older and less energy efficient than single-family homes. As a result, the multi-tenant market holds both the greatest need and the highest potential project returns for retrofits. Energy efficient mortgages (EEMs)1 fit this tricky market segment well because they shift the assessment of credit worthiness from low-income tenants to landlords and housing development authorities [7]. Also, the federal government has established numerous tax credits for low-income development projects that can be accessed through mortgage financing.
In the commercial market, building owners are typically unrated limited liability entities with fully pledged mortgages; these owners are often unable to attract additional credit and are unwilling to place additional debt onto their balance sheets. Furthermore, lease structures frequently misalign tenant-landlord incentives by having tenants reap the benefits of investments made by landlords. Property assessed clean energy (PACE) bonds; utility on-bill finance and efficiency services agreements (ESA) are well suited to the commercial market. PACE solves the credit rating issue by channeling debt through property taxes – which are paid to special entity municipalities that raise capital through credit-rated bond issuances. On-bill solves the same problem by tacking energy efficiency debt onto utility bills. This has low default rates as tenants tend to pay utility bills before rent or property insurance. Both forms of financing solve the problem of split incentives in “net” lease structures; where both tenants and landlords pay property taxes and utility bills. ESAs solve the same issues by stepping in front of utility payments with private-equity funded retrofits and siphoning savings into profit.
The residential market holds the most potential, but is also the most difficult to address. The administrative costs of underwriting and servicing small, distributed loans, plus the marketing costs of customer acquisition, often break the economics of financing residential retrofits. The additional complications of onerous consumer lending laws also tend to cause lenders to shy away from this sector. Although individual savings are only an “inch deep,” aggregate potential is “miles wide.” Residential PACE was a good fit, but ran aground during the mortgage crisis because property taxes hold a senior lien status to mortgage repayments. This left mortgage companies with increased exposure to foreclosure-induced losses, with no additional benefit, and they subsequently withdrew their support for the schemes. On-bill finance has since become the preferred financing method in the residential market. The threat of utility service shut-off provides lenders with the security they need to keep rates low while maintaining lien status that is junior to a mortgage. EEMs also hold significant potential, despite very little activity in the single-family market to date.
Every building is unique and retrofit finance takes many forms. Yet each mechanism outside the ESCO industry’s ESPC model has achieved less than 1 to 2 percent of its potential (Figure 20.6). The overall goal of providing a low-cost conduit for money to flow from the capital markets to profitable retrofits has yet to be realized at any scale. Figure 20.6 displays the theoretical potential and current realization of the most prominent financing mechanisms. To place the large potential range into context, from $8 to 37 billion/year, it is helpful to know that home equity loans totaled $110 billion/year in 2006 and, following the financial collapse, now tally to $32 billion/year [13]. Each of these financing mechanisms is described in further detail in this chapter. Such investment could reduce energy consumption in the United States by hundreds of TWh per annum (approximately 200–500 TWh).
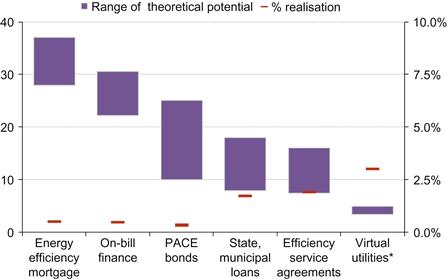
Figure 20.6 Realization and theoretical potential of retrofit financing mechanisms.
Theoretical potential ($billion/yr) Realization (percent). Source: Bloomberg New Energy Finance. Note: PACE stands for “property-assessed clean energy”; Virtual utilities are more akin to an energy efficiency business model than a financing mechanism, but are included nonetheless.
5.1 Energy Efficiency Mortgages
EEMs allow a building owner to add energy efficiency debt on top of a normal mortgage. EEMs are the only financing construct capable of valuing both decreased utility bills and a green building’s market premium. They achieve this by letting the mortgage provider determine interest rates, which should implicitly account for the capital market’s valuation of greener buildings. As a result, the potential market for energy efficiency debt derived through EEMs is greater than any other financing mechanism and could theoretically total up to $270 billion in outstanding energy efficiency debt on top of the $13.5 trillion U.S. mortgage market.
The success of EEMs could lead to the creation of a secondary debt market where energy efficiency debt repayments are bundled, securitized, and then purchased by larger institutions with lower costs of capital. Pension funds and insurance companies could conceivably purchase large volumes of securitized efficiency debt at a low cost of capital because it matches their annuity obligation profiles, which pay out on fixed, monthly time periods over multiple decades. Furthermore, boosted efficiency investment would create job opportunities for labor unions (who in turn invest their 401(k) retirement packages with pension funds). For many in the energy efficiency space, the creation of a liquid secondary market for efficiency debt remains a “holy grail” of sorts – highly desirable, but elusive. To date insufficient loan volume has been originated to establish such a secondary market.
EEMs have historically struggled as lenders did not want to go through extra paperwork to approve a mortgage. Institutional lenders have also been doubtful that actual energy savings will match projections – performance risk remains a hurdle to acceptance. Additionally, the credit risk of 90 percent of the residential mortgage market is federally insured. There is virtually no incentive for mortgage providers to maximize portfolio returns or minimize losses beyond what is required by portfolio performance regulations – which are typically motivated by politics as opposed to profit. As a result of these barriers, energy expenses have yet to factor into the underwriting process of the residential mortgage market.
The potential for EEMs must also be placed in the context of a risk-averse mortgage market that has yet to recover from the collapse of the real estate market. From 2007–2009 average rental rates dropped 30 percent, vacancy rates went up 40 percent, unemployment increased by 115 percent and foreclosure rates quadrupled from 1 percent to 4 percent. With so much uncertainty surrounding the repayment of existing mortgages, virtually all lenders have worked to deleverage their portfolios. A few experimental CDFIs, in contrast, focused on reducing building expenses to hedge potential losses [14]. Energy bills represent nearly half of all home-incurred expenses – a ratio that is higher for renters in the low-income multi-tenant sector. The rationale behind the CDFI approach is that reducing energy expenditure through retrofits puts money in the pockets of tenants and building owners, which should decrease a mortgage portfolio’s foreclosure and delinquency rates. This logic implies that EEMs would be less at risk than traditional mortgages, which further implies that they could support lower interest rates if traded on open markets.
The vehicle through which an EEM would trade could be called a green-mortgage backed security (GMBS). Fannie Mae plans to launch a GMBS initiative in 2012 that will label mortgages on multi-family residential buildings with LEED or Energy Star ratings as “green” within a conventional “vanilla” MBS structure. While this is an important first step, the most significant opportunity for GMBS lies in the commercial market. Figure 20.7 illustrates the tremendous growth of LEED and Energy Star rated commercial office space – both new build and retrofits – along with the precipitous decline of commercial MBS issuances following the collapse of the sub-prime mortgage market. The rise of LEED and Energy Star certified floor space can be attributed to a perception shift within real estate developers. To compete in the real estate market, virtually all new build is certified.
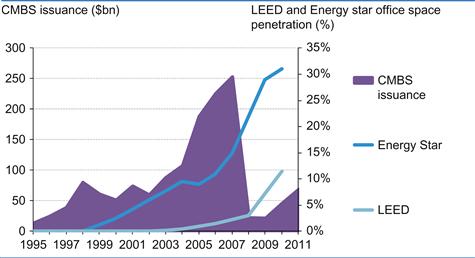
Figure 20.7 LEED and Energy Star U.S. office buildings and CMBS issuance, 1995–2010. Source: Bloomberg New Energy Finance, USGBC, EPA, CBRE, University of California Berkeley. Note: office space makes up 24 percent of the outstanding CMBS market. And Bloomberg data only encapsulates 25 percent of outstanding CMBS debt.
Fannie Mae is also experimenting with refinanced EEMs in the multi-family segment. The “Green Refinance Plus” program initiated in May 2011 will let low-income and affordable housing building owners add additional energy efficiency debt onto a refinanced mortgage. The Federal Housing Administration (FHA) agreed to insure losses of up to 5 percent on the additional energy efficiency debt carried on Fannie Mae’s balance sheet. It is too early to tell whether these programs have worked, but they may well lead to a much larger concerted push by institutional mortgage providers in the energy efficiency space.
In addition to decreased utility bills, energy efficient buildings hold a premium market value over less efficient buildings. Occupants place a higher value on buildings that possess natural sunlight, improved air quality, and comfort through building controls, all of which are enhanced through retrofits. Table 20.1 summarizes the largest and most reputable studies on a green building’s market premium. Each study uses different data sets and statistical techniques to control for differences in building age, location, and time of purchase. The sample size of each survey ranges from roughly 0.1 percent to 5 percent of total U.S. commercial office floor space – equivalent to 10,000 large commercial buildings. The general trend is clear: green buildings increase rental rates, occupancy rates, and resale values by single digit percentages.
Table 20.1
A Summary of Statistical Studies on the Market Premium of Green Buildings

Note: Rent, occupancy and resale values are statistically controlled for differences in building age, location, and time of purchase in all studies.
Source: Bloomberg New Energy Finance, various sources listed in the table.
5.2 Utility On-Bill Finance
Funding from the 2009 American Recovery and Reinvestment Act (ARRA), in combination with the demise of residential PACE, has propelled on-bill finance from a handful of programs into 31 programs in 14 states, with six additional states planning new programs (Figure 20.8) [3]. All existing programs use rate-payer funds as a primary source of capital (on-bill finance) as opposed to third-party funds from the capital markets (on-bill repayment). In on-bill repayment, utilities act as a conduit between lenders and debtors, collecting fees for servicing loans, similar to Visa or PayPal. Scaling on-bill lending into the billions will require programs to break away from rate-payer coffers, and tap into outside credit from the capital markets. California is in the midst of implementing the first on-bill repayment program that is likely to take effect in 2014.

Figure 20.8 On-bill finance programs in U.S. states. Source: ACEEE, DSIRE, CPUC, Bloomberg New Energy Finance.
There is a lot of experimentation amongst these programs. Structures differ by targeted building segment, allocation of credit risk, financing structure and source of funding. Most on-bill programs lend to the commercial and industrial segments, use a mix of rate-payer funds and federal stimulus and implement basic financing structures with loan loss reserves or revolving loan funds. More innovative programs are beginning to use subordinate debt structures within revolving loan pools to attract a wider degree of outside capital from credit unions, CDFIs and local banks – all of which have differing risk appetites. Local lenders are cautiously optimistic about energy efficiency lending because it represents a new revenue stream and allows them to differentiate their brands from commercial banks that continue to soak up market share.2
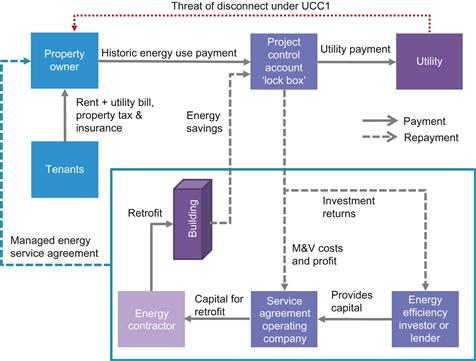
The structure of on-bill repayment is schematically shown in Figure 20.10. On-bill finance functions identically, only without the bridge to the capital markets. Of particular note is the loan security provided by Uniform Commercial Code-1 (UCC1) statements. UCC1s are legal documents that allow creditors to take possession of a debtor’s asset if repayments cease. In the case of on-bill repayment, UCC1 filings can be used in the court of law to pressure a utility to terminate services. A second nuance of note is the difference between on-bill loans and on-bill tariffs. On-bill loans are tied to a customer and are paid off when a property is sold whereas on-bill tariffs are tied to the meter. Most existing programs utilize on-bill loans. However, on-bill tariffs are considered to be preferable because they allow for longer financing terms, which decreases periodic debt repayments and allows for a higher pay back to the individual debtor.

Figure 20.9 Utility on-bill repayment. Source: Bloomberg New Energy Finance, WEF, GE Capital Real Estate, Bloomberg New Energy Finance [18].
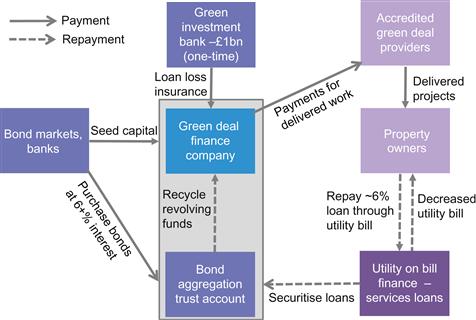
Figure 20.10 Schematic of UK Green Deal. Source: Bloomberg New Energy Finance, The Green Deal Finance Company.
5.2.1 The UK’s “Green Deal” on-Bill Structure
The UK’s Department of Energy and Climate Change (DECC) has made great strides to formalize a national model for avoided cost energy efficiency financing (Figure 20.10). Due to launch this year, DECC is implementing an on-bill repayment program with a revolving loan fund supported with $1 billion in credit backstop from the UK’s Green Investment Bank. Government loan loss insurance on this scale differentiates the Green Deal from the panoply of local on-bill programs in the United States. The work of administering, servicing, underwriting and provisioning loans will be centralized to a newly instituted non-profit partnerership between energy providers and commercial banks called the Green Deal Finance Company. Commercial banks involved in the partnership are expected to profit from fees collected through bond issuances on the back end of securitized efficiency obligations.
DECC anticipates that this structure will support up to GBP 14 billion (USD $22 billion) in energy efficiency lending over the next 10 years. While this figure appears very high relative to the U.S. experience, it bears mention that the UK currently requires utilities to invest GBP 1.3 billion/year (USD $2 billion/year) in energy efficiency measures. Thus, if the UK’s on-bill program is successful, it will shift the onus of mandatory rate-based efficiency investment towards voluntary financing from the capital markets.
5.3 Property assessed Clean Energy
Property assessed clean energy (PACE) bonds allow a building owner to repay debt from retrofits or renewable projects through a special purpose municipal property tax. The schematic structure of PACE financing is schematically illustrated in Figure 20.11. The central difference between PACE and on-bill financing is the conduit through which energy efficiency debt is repaid. On-bill utilizes a buildings utility bill, whereas PACE leverages a buildings property tax.
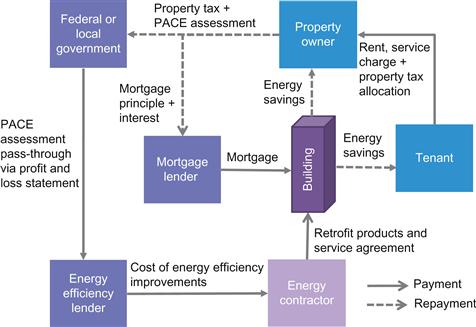
Figure 20.11 PACE financing model. Source: Bloomberg New Energy Finance, WEF, GE capital real estate.
To date, 20 Democratic and six Republican states (party designations based on the majority of their representation in Congress) have implemented PACE-enabling legislature, yet only California, Colorado and New York have made significant progress financing energy efficiency measures through PACE. Vermont and Maine will soon enter the fold with their own programs.
PACE programs stalled in most states in 2010 after the Federal Housing Finance Agency (FHFA) advised Fannie Mae and Freddie Mac against purchasing mortgage loans with outstanding first-lien PACE obligations. On January 26, 2011, the United State District Court in Oakland, California, opened up this implicit moratorium by mandating the FHFA to comply with the outcome of a public commenting period on PACE. If the public comments prove favorable for PACE, which is expected given the large number of commenting non-governmental agencies, the Oakland case could set a precedent for numerous other cities and counties that were previously unable to stand up to FHFA.
Despite challenges in the residential market, PACE has always been a contender in the commercial market, where it continues to make progress. However, commercial buildings tied to mortgage backed security products are likely to avoid PACE due to its senior lien status. The credit-worthiness and size of aggregate PACE bonds tied to a local municipality appeals to investors who wish to securitize energy efficiency debt.
5.4 Sustainable Energy Utilities
Sustainable energy utilities (SEU) represent an attempt by multiple utilities within a geographic region to place all energy efficiency operations under one roof, are more akin to an energy efficiency business model than a financing strategy. However, there is overlap. In Delaware, for instance, Citibank issued a $57 million tax-exempt bond through the state’s AA+ rated municipality to fund energy efficiency projects. Delaware’s sustainable energy utility contracts with energy service companies that execute projects and which repay the SEU’s debt service to bond holders through shared savings agreements. By 2020, Delaware’s SEU anticipates that up to 93 percent of its revenue ($56.2 million) will be self-sustaining through shared savings agreements and REC sales. Today, REC sales and energy efficiency savings account for roughly half of the utility’s revenues – estimated to be between $15 to 20 million in 2011. The remaining half derives from a utility public benefit fund, which is seeded through a utility surcharge.
The principle difference between a public benefit fund and an SEU is that an SEU is attempting to accrue revenue through shared energy savings. Public benefit funds are essentially a mandated hand-out while SEUs represent a capitalistic approach to energy efficiency. Vermont is the only other state to have formalized an SEU.
5.5 Efficiency Service Agreements
Efficiency services agreements (ESA) have emerged as one of the more promising financing schemes in the commercial real estate market. At its core, an ESA is a hedge on utility rates for a building owner, and a structure to turn energy savings into profit for investors. Most corporations and commercial real estate companies view energy management as a cost center, not a profit center. Thus investment for the sake of project returns is rarely pursued. Instead, the focus is normally on lowering electric and gas supply prices through financial hedging, as the benefits are immediate and price certainty is highly valued by any business. ESAs allow a third-party energy efficiency company to provide building owners with the equivalent of a financial hedge through physical kWh reductions. ESAs typically finance signed contracts through a mix of private equity funds, bank loans, and special-purpose energy efficiency funds. Investors usually claim tax incentives and the accelerated depreciation of any heavy equipment installations.
The general structure of an efficiency services agreement is schematically shown in Figure 20.12. There is no public record of disclosed ESAs, yet analysis performed by Transcend Equity and Deutsche Bank suggests that approximately $500 m has been contracted through 100 to 125 ESA deals to date. These numbers require the caveat that much speculation exists as to the size of the ESA market. A survey conducted by Bloomberg New Energy Finance indicates that ESA deals total only $20 to $30 million/yr.
6 Conclusions
Similar to arrows in a quiver, energy efficiency financing mechanisms differ in applicability depending upon building type, landlord-tenant-lender relationships and the macro trends of the real estate industry. Energy efficiency mortgages represent the largest potential market opportunity because the mechanism fuses energy efficiency finance with traditional real estate finance. Unfortunately, additional debt for energy efficiency mortgages is currently out of the question for mortgage providers because the real estate industry is deleveraging. PACE bonds may soon be issued on heels of stimulus money that has seeded demonstration programs throughout the United States. In the past, PACE bonds have largely been held back by mortgage providers who fear the mechanism’s senior lien status. On-bill finance resolves PACE’s shortcomings by tagging energy efficiency debt onto a utility bill, which provisions a junior lien status relative to a mortgage. However on-bill finance is inherently tied to the cooperation of utilities many of which are slow to adopt changes and oppose aggressive efficiency measures. ESAs represent the wild card in the bunch. This mechanism solves numerous principle agent issues, and may well crack the code in the commercial market. The complexity of the mechanism, however, creates tedious and lengthy sales cycles that slow down the models adoption. The strengths and weaknesses of these mechanisms outstanding, energy efficiency finance is expected to swing into the fold in a big way over the coming years. Energy prices are expected to increase, buildings will continue to age, and grid infrastructure will cost a fortune to replace. All of these factors point to a bright future for those who innovate off-balance sheet solutions for energy efficiency projects.
References
1. Institute for Building Efficiency. Energy efficiency indicator, 2011 global results, <http://www.institutebe.com/Energy-Efficiency-Indicator/2011-global-results.aspx>. Johnson Controls Inc.
2. Benningfield Group. U.S Multifamily energy efficiency potential by 2020 The Energy Foundation 2009; <www.livingcities.org/related/downloads/?id=8>.
3. Bell C, Nadel S, Hayes S. On-bill financing for energy efficiency improvements Washington, D.C.: American Council for an Energy-Efficient Economy; 2011; Report E118. <http://aceee.org/research-report/e118>.
4. [CEE] Consortium of Energy Efficiency. Consortium for energy efficiency 2012 behavior program summary Boston, Mass: Consortium for Energy Efficiency; 2012.
5. Goldman C, Stuart E, Hoffman I, Fuller M, Billingsley M. Interactions between energy efficiency programs funded under the recovery act and utility customer-funded energy efficiency programs Lawrence Berkeley National Laboratory 2011.
6. Bourland D. Incremental cost, measurable savings: enterprise green communities criteria. Enterprise green communities, <www.seattle.gov/dpd/cms/groups/pan/@pan/…/dpdp018267.pdf>; 2010.
7. Deutsche Bank, Living Cities. The benefits of energy efficiency in multifamily affordable housing. New York, NY, <https://www.db.com/usa/img/DBLC_Recognizing_the_Benefits_of_Energy_Efficiency_01_12.pdf>; 2012a.
8. Deutsche Bank, Living Cities. The benefits of energy efficiency in multifamily affordable housing; 2012b.
9. Kats G, Menkin A. Energy efficiency financing – models and strategies: pathways to scaling energy efficiency financing from $20 billion to $200 billion annually Cap-E: American Council for an Energy Efficiency Economy; 2011; <http://www.cap-e.com/Capital-E/Energy_Efficiency_Financing.html>.
10. Bryne J. Understanding sustainable energy utilities. Center for energy & environmental policy University of Delaware 2009.
11. Hayes S, Nadel S, Granda C, Hottel K. What have we learned from energy efficiency financing programs? Washington, D.C.: American Council for an Energy-Efficient Economy; 2011; Report U115. <http://www.aceee.org/research-report/u115>.
12. Mark F, Baker J. United States building energy effficiency retrofit New York, NY: Deutsche Bank Climate Change Advisors; 2011; <http://www.dbcca.com/dbcca/EN/investment-research/investment_research_2409.jsp>.
13. Mortgage Bankers Association. Mortgage debt outstanding 2010. <www.mortgagebankers.org/files/…/Q210CMFDebtOutstanding.pdf>.
14. Opportunity Finance Network. CDFI market conditions second quarter 2011. Philadelphia, <http://www.opportunityfinance.netCDFI>; 2011.
15. Lesh, P., 2009, “Rate Impacts and Key Design Elements of Gas an Electric Utility Decoupling: A comprehensive review.” Regulatory Assistance Project, June.
16. Hayes, S., Nadel, S. Kushler, M., York. D., 2010, “Carrots for Utilities: Providing Financial Returns for Utility Investments in Energy Efficiency”, ACEEE, January.
17. New Hampshire is considered to be historically red for this analysis.
18. World Economic Forum, “A profitable and resource efficient future: Catalysing retrofit finance and investing in commercial real estate”. 2011. Industry stakeholder report. http://www.weforum.org/reports/profitable-and-resource-efficient-future-catalysing-retrofit-finance-and-investing-commercia.
*This chapter is based on work by the author while he was with Bloomberg New Energy Finance and is based, in part, on proprietary research conducted by Bloomberg New Energy Finance, which is hereby acknowledged.
1An energy efficient mortgage is the same as a normal mortgage, only with an energy efficiency component added to the underwriting and mortgage approval process. This is akin to a building code, only enforced by mortgage lenders (i.e., the private sector).
2In 2009 commercial bank assets totaled $13.4 trillion while credit union assets totaled only $885 billion.