
17
SPECTROSCOPY
17.1 INTRODUCTION
All integral laws of spectral lines and of atomic theory spring originally from the quantum theory. It is the mysterious organ on which Nature plays her music of the spectra, and the rhythm to which she regulates the structure of the atoms and nuclei.
Spectroscopy is the study of the interaction of electromagnetic radiation in all its forms with matter. Electromagnetic spectrum is the range of all types of electromagnetic radiation. The interaction might give rise to electronic excitations (UV), molecular vibrations (IR) and nuclear spin orientation (NMR).
Electromagnetic energy is used while listening to the radio, watching television, sending a message or popping popcorn in a microwave oven.
Examples: Radio waves, microwaves, infrared light, UV-visible light, X-rays, etc.
The sun is a source of energy across the entire spectrum; the electromagnetic radiation bombards the atmosphere and protects us from high energy waves that can be harmful to life. Electromagnetic energy travels in the form of waves and spans a broad spectrum from very long radio waves to very short gamma rays and shown in Figure 17.1. The human eye can only detect a small portion of this spectrum called visible light.
Electromagnetic radiation can be described in terms of a stream of mass-less particles, called photons, each travelling in a wave-like pattern at the speed of light. Each photon contains a certain amount of energy. Different types of radiation are defined by the amount of energy formed in photons. The frequency is measured in cycle per second or Hertz. Wavelength is measured in metres and energy is measured in electron volts.

Figure 17.1 Electromagnetic spectrum
17.2 ULTRA VIOLET AND VISIBLE SPECTROSCOPY
17.2.1 Principle
On passing electromagnetic radiation in the UV and visible region through a compound, a part of the radiation is absorbed by the compound. After the absorption of energy, the electrons in the orbital of lower energy are excited into the orbital of higher energy.
The energy absorbed by the molecule will be equal to the difference between the two energy levels like lower and higher energy. During this stage, spectra electronic excitations occur. Hence, sometimes, it is also called “electronic spectroscopy”.
Electronic transitions are observed in the electronic vibrational and rotation level and they produce broad UV-Vis bands. When a graph is drawn by taking absorbance on Y-axis and wave length on X-axis, we get a curve structure; it is shown in Figure 17.2. This is different for different types of excitations. By using this graph, we can analyse the compound. In the graph, 100% absorbance occurs at λ max value.

Figure 17.2 Graph showing electronic transition
The UV region is further divided into two regions:
- Vacuum region 100–190 (200 nm)
- Near UV region 190–400 nm
17.2.2 Instrumentation
A beam of light from a visible and/or UV light source is separated into its component wavelength by a prism or diffraction grating. Each monochromatic beam is split into two equal intensity beams by a half-mirrored device; one is the sample beam that passes through a small transparent container (cuvette) containing a solution of the compound being studied in a transparent solvent and other beam is the reference that passes through an identical cuvette containing only the solvent. The intensity of these beams is measured by an electronic detector and compared. The intensity of the reference beam which should have absorbed little or no light absorption is indicated as “Io” and the intensity of the sample beam is indicated as “I”. Over a short period of time, the spectrometer automatically scans all the component wave length in the described manner. The UV region is scanned as normally from 200–400 nm. The visible region is scanned from 400–800 nm. The UV-Vis spectrometer block diagram is shown in Figure 17.3.

Figure 17.3 UV-Vis spectrometer block diagram
17.2.3 Instrumental Design
A spectrometer is an instrument for measuring the transmittance or absorbance of a sample as a function of the wave length of electromagnetic radiation. The key components of a spectrophotometer are as follows:
- Source (UV-Vis)
- Wave length selector (monochromator)
- Sample cell/reference cell
- Detector
Source
The source generates a broad band of electromagnetic radiation. The commonly used sources in the UV-Vis spectrophotometers are deuterium arc lamp and tungsten-halogen lamp.
Deuterium Arc Lamp
The first source, the “deuterium arc lamp”, yields a good intensity continuum in the UV region and provides useful intensity in the UV region. Modern deuterium lamps have low noise; noise from the lamp is often the limiting factor in overall instrument noise performance. Over time, the intensity of light from a deuterium arc lamp steadily decreases. The half-life of such typical lamps is 1,000 hours.
Tungsten-halogen Lamp
The second source, the tungsten-halogen lamp, yields good intensity over the part of the UV spectrum and the entire visible range. This type of lamp has very low noise and low drift and has a half-life of 10,000 hours. Most spectrophotometers used to measure UV-Vis range contain both types of lamps. In such instruments, either a source selector is used to switch between the lamps as appropriate or the light from the two sources is mixed to yield a single broad band source. Sometimes, xenon lamp is used as an alternate light source, but it is highly expensive.
Wave Length Selector (Dispersion Device)
A dispersion device gives a different wavelength of light to be scattered at different angles. When combined with an appropriate exist slit, these devices can be used to select a particular wavelength of light from a continuous source. Prism and holographic grating are commonly used as wavelength selectors in a UV-Visible spectrophotometer.
Prism
A prism generates a rainbow from sunlight—the same principle is used in spectrophotometers. Prisms are simple and inexpensive. The resulting dispersion is angularly non-linear. The angle of dispersion is temperature-sensitive; hence, holographic gratings are used instead of the prism.
Holographic Grating
The light falling on the grating is reflected at different angles, depending on the wavelength. Holographic grating yields a linear angular dispersion at wavelength and is temperature-insensitive. However, it reflects light in different orders. As they overlap, a filter must be used to ensure that only light from the desired reflection order reaches the detectors.
A monochromator consists of an entrance slit, a dispersion device and an exist slit. Ideally, the output from monochromator is a monochromatic light.
Optics
These are used to relay and focus light through the instrument. These are carefully designed with the chromatic aberration of individual lenses in an optical system and can be used to cancel each other out. An effective optical system can be constructed with the following simple and inexpensive components.
Cuvettes
The most commonly used cell is the open-topped rectangular cell. These cells are available in path length from 1 to 100 mm. The normally used cuvettes having path length of 10 mm. The external width of a rectangular cell is 12.5 mm. When the sample volume is limited, narrow opening cells are often used. When sample volume is extremely limited, micro cells can be used that reduce the aperture of the sample area to a very small cross section. Only approximately 60 µl of sample is required for measurement. Ultra microcells, sample volumes down to 5 µl can be measured. The flow through cells are used for automated application. Modern cells are connected to sample transferring through tubing with screw fitting. With aperture cells and microcells, parts of the light beam are blocked, throughput is reduced and sensitivity is compromised to an extent. The loss of sensitivity depends on the degree of aperturing and on the optical geometry. The single beam instrument, the cuvette containing the solvent is placed in the spectrometer and the blank is measured after the sample solution is then measured in the same cuvette. All modern instruments automatically store the reference IO values which calculate absorbance values for the sample.
Dual and split beam instruments require two cuvettes. Initially, both cuvettes are filled with a pure solvent and a so-called balance measurement is performed. This measurement reflects the difference in absorbance between the two optical paths in use. The sample cuvette is then filled with a sample solution for measurement, and IO and I are measured. The resulting spectrum is corrected by subtracting the balance spectrum.
Detector
A detector converts a light signal into an electrical signal. Spectrophotometers normally contain either photomultiplier tube or a photodiode detector. In UV-Vis spectroscopy, the photo multiplier is a commonly used detector; it consists of a photo emissive cathode, several dynodes and an anode. A photon of radiation entering the tube strikes the cathode causing the emission of several electrons; these electrons are accelerated towards the first dynode. The electrons strike the first dynode, causing the emission of several electrons from the incident electron. These electrons are then accelerated towards the second dynode and produce more electrons which are accelerated towards the third dynode and so on. Eventually, the electrons are collected at the anode. Each original photon has produces 106—107 electrons; the resulting current is amplified and measured. Photo multiplier is very sensitive to UV and visible radiation and has fast response time. Intense light damages photo multiplier and are limited to measuring low power radiation.
17.2.4 Electronic Transitions
The range of UV- Visible spectroscopy is 200—800 nm. The range for UV is specifically 200—400 nm and for visible ranges at 400–800 nm. Such type of UV-Vis radiation gets exposed with molecules. At that time, the electrons which are present at bonding molecular orbital and non-bonding molecular orbital enter into anti-bonding molecular orbital such as σ* and π*.
Here, σ and π are bonding molecular orbital, n stands for non-bonding orbital and σ* and π* stand for anti-bonding molecular orbital. Molecule exposed to UV-Visible radiation bonding molecular orbital as well non-bonding molecular orbital electrons will absorb energy and get transfer from the ground state to the excited state, that is, antibonding molecular orbital.
The following different types of electronic transitions are observed in UV-Visible spectra:
- σ — σ*
- π — π*
- n — σ*
- n — π*
σ—σ* Electronic Transitions
Very high energy is required for the σ-σ* transition. Such type of transition is observed below 200 nm, that is, vacuum ultra-violet region
Example: Saturated hydro carbon.
n-σ * Electronic Transition
Saturated molecule which contains hetero atoms like oxygen, nitrogen, etc., having a lone pair of electrons involves these types of electronic transitions. These transitions are comparatively less energy transitions than σ–σ* transitions.
Example: Alcohols, amines and ethers.
π–π* Transition
Unsaturated compounds involve these types of electronic transitions.
Example: Alkene, alkynes and aromatic compounds.
n–π* Electronic Transition
In these transitions, an electron from a lone pair on a hetero atom is exited to anti-bonding π* orbital.
Example: Carbonyl compounds.
17.2.5 Chromophores
It is a group of molecule, which is responsible for the absorption of light by molecules. It is conjugated dienes. It is the minimum structural requirement for the absorption of radiation in UV-range. By having functional groups or some other structural features, its presence gives a colour to a compound. Nowadays, the term chromophore is used in much boarder sense which may be defined as any group which exhibits absorption of Electromagnetic Radiation (EMR) in the visible or UV region. It may or may not import the any colour to the compound.
Two types of chromophore are as follows:
Chromophores in which the group has π electrons undergo π → π* transitions.
Example: Ethylene, acetylene.
Chromophores having both π-electrons and nonbonding electrons undergo two types of transitions—π → π* and n → π*
Example: carbonyls, nitriles, azo compounds, acids.
17.2.6 Auxochrome
In isolated chromophore groups such as >c—c< and —c≡c—, absorption takes place in far ultraviolet region which cannot be easily studied. However, the position of absorption is maximum and the intensity of absorption can be modified in different ways by some structural changes or change of solvent as follows.
“In auxochrome, it is a group which itself does not act as a group chromophore but when it is attached to a chromophore, it shifts the absorption maximum towards longer wave length along with an increase in the intensity of absorption”.
Some commonly known auxochromic groups are —OH, —NH2, —OR, —NHR and —NR2
Example: When auxochrome —NH2 group is attached to benzene ring, it absorption changes from λmax 255 to λmax280.
All auxochromes have one or more non-bonding pair of electrons.
If auxochrome is attached to a chromophore, it helps in extending the conjugation by sharing of non-bonding pair of electrons.
![]()
17.2.7 Woodward–Fieser Rules
In 1945, Robert Burns Woodward proposed rules for correlating of λmax values with molecular structure; but in 1959, Louis Frederick Fieser modified these rules with more experimental data, and the modified rule is known as Woodward-Fieser Rules. These are used to calculate the position and λmax for a given molecular structure by relating the position and degree of substitution of chromophore.
According to Woodward and Fieser, each type of diene or triene system has a certain fixed λmax value; this is known as base value or parent value. The contribution made by various alkyl substituent, ring residue, double bond extending conjugation, polar groups such as —Cl, —Br, etc., are added to the base value to obtain λmax for a particular compound.
Conjugated Dienes
Different types of conjugated dienes are as follows:
- Homoannular diene Cyclic diene having conjugated double bonds in same ring.

- Heteroannular diene Cyclic diene having conjugated double bonds in different rings.

- Endocyclic double bond Double bond present in a ring.

- Exocyclic double bond Double bond in which one of the doubly bonded atoms is a part of a ring system.

Here, ring A has one exocyclic and endocyclic double bond. Ring B has only one endocyclic double bond.
Base Values of Different Organic Functional Groups and Increments for Substituent/Groups are Shown in Tables 17.1–17.4
Table 17.1 Conjugated diene correlations

Example:

For Heteroannular base value = 214 nm
Ring residue = 3 × 5 = 15 nm
Exocyclic double bond = 1 × 5 = 5 nm
λmax = 214 + 15 + 5 = 234 nm
Table 17.2 α, β unsaturated carbonyl compounds or ketones

Example:

Base value = 214 nm
β - Substituents = 1 × 12 = 12 nm
δ - Substituents = 1 × 18 = 18 nm
Double bond extending conjugation = 1 × 30 = 30 nm
Exocyclic double bond = 5 nm
λmax = 214 + 12 + 18 + 30 + 5 = 279 nm
Table 17.3 Aromatic compounds

Example:

Base value = 246 nm
Ring residue in o- position = 1 × 3 = 3 nm
Polar group —OCH3 in p- position = 25 nm
λmax = 246 + 3 + 25 = 274 nm
Table 17.4 Absorptions wave length of typical organic functional groups

17.2.8 Factors Affecting the Position of the λ Maximum and Intensity of Radiation
The absorption spectra is the graph between the light absorption and the frequency. It is characterised by the following:
- λmax: Position of spectra.
- Intensity: The amount of radiation absorbed by the molecule.
Factors Affecting the Position of Spectra (λmax)
The position of the spectra mainly depends on the following several structural and non-structural features:
Structural Factors
Substitution
λmax may affect by substituent on a chromophore by two mechanisms—by changing of transition or shifting the wavelength of existing transitions.
Example: Each alkyl substituent produces 5 nm bathochromic shift.
Solvent
The solvent effect arises due to different salvation for the ground and exited states; if the ground state is more solvated strongly than the exited state, the energy difference is increased. The increased energy difference shift the absorbance towards shorter wave lengths.
Geometry
Due to steric effects, trans-stilbene absorbs at a longer wavelength than cis-stilbene. Co-planarity is required for the most effective overlap of the π- orbitals. Due to steric effects, the cis-isomer is forced into a non-planar conformation and twisted slightly out of plane by steric interactions so that the degree of conjugation in the π-system is slightly less than trans isomers, resulting in greater energy for the transition.
Non-structural Factors
- PH
- Temperature: Temperature gives more energy to the ground state; as a result energy required for excitation will be less.
Factors Affecting the Intensity of Absorption of Radiation
Thickness of the Medium
Lambert’s law: When a beam of monochromic light is allowed to pass through a transparent medium, the rate of decrease of intensity with the thickness of medium is directly proportional to the intensity of incident light.
Concentration
Beer’s law: When a beam of monochromatic light is allowed to pass through a transparent medium, the rate of decrease of intensity with the concentration of absorbing solute is directly proportional to the intensity of incident radiation.
![]()

17.2.9 Franck-Condon Principle
Kasha’s Rule
In the electronic excited state, molecules quickly relax to the lowest vibrational level of the lowest electronic excitation state and they can come back to the electronic ground state via photon emission.
Stokes’ Shift
The displacement of fluorescence bands towards the longer wavelengths (lower energy) can be compared to the absorption bands. This was a long-established experimental fact before the Franck-Condon principle provided its interpretation.
Franck-Condon Principle
The Franck–Condon principle is applied to both absorption and fluorescence; it has a classical and quantum application that explains the intensity of vibronic transitions.
The classical formulation, of the Franck–Condon principle is an electronic transition occurs without changing in the positions of the nuclei in the molecular entity and its environment; the resulting state is Franck–Condon state, and the transition involved is a vertical transition.
The quantum mechanical formulation of the Franck–Condon principle is that the intensity of a vibronic transition is proportional to the square of the overlap integral between the vibrational wave functions of the two states that are involved in the transition.
The Franck-Condon Principle explains in detail the intensities of vibronic transitions, or the absorption or emission of a photon. The nuclear configuration of the molecule experiences no significant change when a molecule undergoes an electronic transition, such as ionisation. This is because the nuclei are much more massive than electrons and the electronic transition takes place faster than the nuclei can respond.
The theory states that it must undergo a vibration when the nucleus realigns itself with the new electronic configuration. The nucleus in a molecule has Coulombic forces acting on it from the electrons and other nuclei of the system. Once a molecule undergoes the electronic transition, the resulting Coulombic forces serve to change the energy of the molecule. This change brings it from the ground state to an excited state and the results in the nuclei change its vibrational state. This vibrational structure of an electronic transition shows that the absorption spectrum consists of many lines instead of a single sharp electronic absorption line.
Consider a diatomic molecule with atoms A and B that oscillate back and front along the axis of bond linking them. The potential energy of such system is related to interatomic distance (γAB), plot between potential energy and inter atomic distance shown in Figure 17.4.
The area within the potential energy curve is populated with different vibrational levels of the molecule. These levels are quantised and the energy separation between the levels decreases with increasing value of γAB.
The electronic excitation of such a system by light absorption in a change in the overall electronic distribution within the molecule forms a different potential curve. The Franck-Condon principle states that the inter-nuclei distance in a molecule is fixed during the electronic transition. This indicates the electronic transition of the exited states has the same geometry and interatomic bond distances as same as the ground state of the molecule.
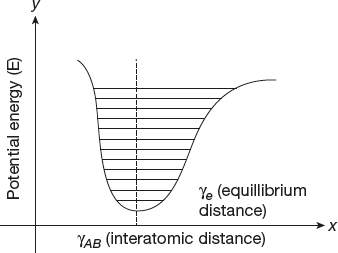
Figure 17.4 Graph between potential energy and inter atomic distance
17.2.10 Solved Problems Based on UV-VIS Spectroscopy
- Find the name and λ maximum values of the following compounds in the UV-Vis Region

Name of the Compound - 2,4-dimethylpenta-1,3-diene
λ maximum value — 234 nm

Name of the compound - 1-methylcyclohexa-1,3-diene
λ maximum value — 268 nm

Name of the compound - 3,4-dimethylpenta-3-en-2-one
λ maximum value — 249 nm
17.2.11 Applications of UV-Visible Spectroscopy
Ultra-violet spectroscopy is used more extensively in assaying (quantitative measurements) than in identification. UV spectroscopy is usually applied for predicting the conjugated double bonds α, β unsaturated carbonyl compounds, organic and inorganic complexes in a solution. UV-Visible spectroscopy is used to characterise the absorption, transmission and reflectivity of various important materials such as pigments, coatings, etc.
Quantitative Analysis
This quantitative determination of compounds is based on Beer’s law which is as follows:
![]()
Example: The trace metal content of an alloy such as manganese in steel can be determined.
Qualitative Analysis
UV absorption spectroscopy can be characterised by comparing the absorption spectrum with the spectra of known compounds.
Example: Characterisation of aromatic compounds and aromatic olefins.
Chemical Kinetics
Kinetics of reaction rates can be determined by using UV-Visible spectroscopy. If a reagent or a product of the reaction absorbs radiation at a particular frequency, the spectrometer can be set to measure the absorption at that frequency as a function of time.
Example: The rate of hydrolysis of an ester.
Detection of Impurities
Due to the presence of impurities in a substance that give it additional peaks, it can be compared with standard materials. The impurities can also be detected by measuring the absorbance at specific wavelength.
Example: Benzene appears as a common impurity in cyclohexane; its presence can be easily detected by its absorption at 255 nm.
Structure Elucidation of Organic Compound
The structure elucidation of an organic compound and a hetero atom can conclude by location and combination of peaks; whether the compound is saturated or unsaturated, hetero atoms are present or not.
Dissociation Constants of Acids and Bases
![]()
If the ratio of particular pH and the ratio of [H−]/[HA] can be determined spectrophotometrically from the graph plotted in between absorbance and wave length of different pH values, the Pka value can be calculated from the above equation.
Molecular Weight Determination
By preparing the suitable derivatives of the particular compounds, the molecular weight of compound can be measured spectrophotometrically.
Example: To calculate the molecular weight of amine, it is converted into amine picrate. The known concentration of amine picrate is dissolved in one litre solution and its optical density is measured at λmax 380 nm. After this, the concentration of the solution in gram mole per litre can be calculated by using the following equation:
![]()
As HPLC Detector
The UV-Visible spectrophotometer may also use as a detector for HPLC.
17.3 IR-SPECTROSCOPY
Infrared (IR) spectroscopy is applied to a broad range of organic and inorganic materials in solid, liquid and gaseous forms. The crystal, molecular vibrational modes absorb electromagnetic radiation. In general, functional groups that have strong dipoles give rise to strong absorptions in the infrared spectrum. The infrared spectral range is roughly 1 to 100µ (10,000 to 100 cm-1). The IR technique is quick, simple and relatively inexpensive and serves as a useful supplementary technique in the identification of natural inorganic species such as minerals and natural compounds. Oxygen and nitrogen do not absorb infrared light. Their molecular symmetry does not possess dipole moment of vibrational excitation. Solids such as NaCl, KBr, CaF2, LiF, CaBr and CsI are used as transparent windows and prism materials for IR spectroscopy because of their vibrational absorptions are in different spectral regions.
17.3.1 Basic Principle
The absorption of IR transitions occur in vibrational or rotational energy level, but does not have enough energy to induce electronic transitions as seen with UV. Molecule absorb IR radiation, the vibrations or rotations within the molecules must cause a net change in the dipole moment of the molecule; but do not require any permanent dipole moment.
The electric field of the radiation interacts with fluctuations in the dipole moment of the molecule; if the frequency of the radiation matches the vibrational frequency of the molecule, then radiation will be absorbed, causing a change in the molecular vibrations. The interpretation of an IR spectrum provides information about the functional group present in molecule. An IR spectrum is a plot of wavelength versus absorption. Specific absorption bands indicate the presence of the particular functional group. By itself, an IR spectrum does not provide enough information about the complete chemical structure of the compound. However, it is very helpful when combined with other spectroscopic technique.
Generally, molecules are always in motion. The bond between atoms involve in stretching, bending, wagging, twisting and rocking. These are called molecular vibrations. Organic compounds absorb IR radiation in different types of bonds (in different functional groups) and absorb IR radiation at different characteristic frequencies, causing an increase in amplitude of that bond vibration.
The IR radiation range is between 2.5µ and 25µ or 4000—400 cm−1. The IR is placed in between UV-Vis and microwave.
The IR spectrum is further divided into four regions.
- Photographic region: This is the visible region range of 1.2µ
- Very Near–IR region: This is known as over tone region; its range is 1.2 to 2.5µ.
- Near IR region: This is known as vibration region; its range is 2.5 to 25µ.
- For IR region: This is known as rotation region; its range is 25µ to 300—400µ.
The IR spectrum broadly divided into two regions as follows and shown in Figure 17.5
- Functional group region
- Finger print region.

Figure 17.5 Infrared spectrum
17.3.2 Instrumentation
A standard IR runs a single spectrum; it is a dispersive or a scanning monochromator method. In the Fourier transform infrared spectroscopy (FTIR), a moving mirror inside the apparatus alters the distribution of infrared light that passes through the interferometer; the signal directly records an “interferogram” and it represents light output as a function of mirror position. This data-processing technique is called Fourier transformation and turns this raw data into the desired result as a spectrum. The light output is a function of infrared wavelength or wavenumber.
Introduction
A source provides radiation over the entire range of the IR spectrum. A monochromator disperses the light and then selects a narrow wave number range. The detector measures the energy and transforms it into an electrical signal. This signal is further amplified and registered by the recorder. The FTIR spectra of most of the samples were recorded in the mid and far IR regions and are used for the present investigation. Standard IR spectroscopy block diagram shown in Figure 17.6.
Standard IR Spectroscopy Block Diagram

Figure 17.6 IR Spectroscopy block diagram
Source
The IR radiation is produced by electrically heating source, usually Nernst filament or a Globar to 1000–1800°c. The Nernst filament is fabricated from a binder and oxides of thorium, cerium, zirconium and yttrium. The Globar is a small rod of silicon carbide is 5 cm in length and 0.5 cm in diameter. The maximum radiation for Globar occurs in the 5000–5500 cm−1 region. Nichrome wire, carbon arc, rhodium wire and tungsten filament lamp are also used as a light source. In a commercial IR spectrometer, either a nichrome wire or a platinum filament contained in a ceramic tube is commonly used as IR source for the range 4000–400 cm−1
Monochromator
A monochromator separates the poly chromatic source radiation into suitable wavelength. This is achieved by a prism or diffraction grating. An ideal prism instrument would contain a large number of prisms made from different optical materials. A high resolution prism instrument contains combination of SiO2, NaCl and KBr prisms. Low-cost instrument uses a NaCl prism over the entire range. They give the highest resolution in the vital finger print region.
Functions of Monochromator
The functions of a monochromator are as follows:
- It disperses the radiation according to its wave number components.
- It restricts the radiation falling on the detector into a narrow wave number range.
- It maintains the incident energy on the detector to an approximately constant entire wave number range of the instrument when no sample is present.
Some instrument are used as double monochromator.
Detectors
A detector usually converts the thermal radiant energy into electrical energy which can be subsequently being plotted on chart recorder. Two types of the detectors are commonly used.
Thermal Detectors
Here, the IR radiation produces a heating effect that alters some physical property of the detector. The detector mostly produces an electrical signal which is proportional to the intensity of the incident radiation over the whole spectral range of the instrument.
The thermal detectors are selective and non-selective.
Selective Detectors Selective detectors are directly dependent upon the wavelength of incident radiation.
Example: Photographic plates, photo cells, photo conductive cells and infrared phosphors.
Non-selective Detectors Non-selective detector directly depends on incident energy but is independent of the wave length.
Example: Thermo couples, bolometers, pneumatic cells.
Pyro electrics are the most advance detectors being used recently.
Photon Detectors
Photon detectors use the quantum effects of the IR radiation to change the electrical properties of a semiconductor. The result is producing electrons and holes; this is the internal photo effect. A sufficiently energetic photon that strikes an electron in the detector can raise those electrons from as non-conducting state into a conducting state. As conductors, electrons can contribute the current flow depending on the configuration of the semiconductor. These are referred to as ‘photo voltaic’ or ‘photo conductive cell’.
Amplifiers and Recorders
The radiant energy received by the detectors is converted into measurable electrical signal and is amplified by the amplifiers. The amplified signals are registered by a recorder or plotter.
17.3.3 Molecular Vibrations
For a molecule to absorb infrared radiation, it must undergo a net change in the dipole moment as a result of vibrational or rotational motion. The energies associated with rotational transitions are generally much smaller than that for vibrational transitions and the peaks are found below 300 cm−1. Typically, vibrational spectra are measured between 4000 cm−1 to 650 cm−1 for NaCl optics or 4,000 cm−1 to 450 cm−1 for KBr optics.
All atoms in a molecule are constantly in motion. A diatomic molecule contains only a single motion; polyatomic molecules have more than one type of vibration motion, known as normal modes. Vibrations can be subdivided into two classes, depending on whether the bond length or angle change—they are stretching and bending vibrations. IR vibrational frequency range for different functional groups shown in Table 17.5.
Table 17.5 IR vibrational frequency range for functional groups


Symmetrical (homolytic) diatomic molecules are observed in the Raman spectra but not in the IR spectra. This is due to the fact that diatomic molecules have one band and no permanent dipole movement change and therefore only one single vibration occurs, and IR is inactive.
Example: O2 or N2
Unsymmetrical diatomic molecules absorb in the IR spectra, due to change in dipole moment and IR is active.
Example: CN
Polyatomic molecules undergo more complex vibrations that can be resolved into normal modes of vibration. The normal modes of vibration are stretching (symmetric and asymmetric) and bending (scissoring, rocking, wagging and twisting).
Stretching
Vibration is a rhythmic movement along the bond axis such that the inter-atomic distance increases or decreases and alters the length of a bond, such as C—H or C—C. The vibrations of a molecule containing three atoms are more complex; there are symmetric and asymmetric stretches.
Bending
A bending vibration may consist of a change in bond angle between bonds and it does not occur along the line of the bond. If we alter the angle between two bonds, such as the HCH angle in a methylene group, the bond lengths remain unchanged. A diatomic molecule such as HCl can only undergo stretching vibrations.

Bending vibrations can be either in plane (δ) or out plane (γ) modes.
Rocking
A change in the angle between a group of atoms, such as a methylene group and the rest of the molecule is called rocking.
Wagging
A change in the angle between the plane of a group of atoms, such as a methylene group and a plane through the rest of the molecule is called wagging.
Twisting
A change in the angle between the planes of two groups of atoms, such as a change in the angle between the two methylene groups is called twisting.
Out-of-plane
This is a change in the angle between any one of the C—H bonds and the plane defined by the remaining atoms of the ethylene molecule. Another example is in BF3 when the boron atom moves in and out of the plane of the three fluorine atoms.
In a rocking, wagging or twisting coordinate, the bond lengths within the groups involved do not change but the angles change. Rocking is distinguished from wagging by the fact that the atoms in the group stay in the same plane.
17.3.4 Factors Affecting Vibrational Frequency
Isotope Effect
When an atom is replaced by an isotope, the effect on force constant (k) is negligible but due to reduced or increased mass, it has an effect on the rotational and vibrational behaviour. Hence, a change in the mass has an effect on frequency (v).
Solvent Effect
The polar solvent has an influence on the IR spectra of organic compounds due to the interaction between solvent and compounds, and is called solvent effects.
Compounds which contain n, π and π* orbitals are placed into a polar solvent, and the solvent will stabilise with these three orbitals to a different extent. The order of stabilisation effects of the polar solvent is n orbital > π* orbital > π orbital. The spectra of n→π* transition will shift to shorter wavelengths and higher energies due to the polar solvent causes the energy difference between n orbital and π* orbital to become bigger. The spectra of π→π* transition will shift longer wavelength and lower energies due to the polar solvent that causes energy difference between π and π* orbitals to become smaller.
17.3.5 Degrees of Freedom
The number of variables required to explain the motion of a particle is known as the degree of freedom. In an atom moving in a three-dimensional space, three coordinates are adequate; so its degree of freedom is three but its motion is purely translational. If a molecule is made of N atoms or ions, the degree of freedom becomes 3N, because each atom has three degrees of freedom; but these atoms are bonded together, all motions are not translational; some become rotational and others vibrational. For non-linear molecules, all rotational motions can be described in terms of rotations around three axes, hence, it possesses 3N − 6 degrees of freedom for normal vibrational motion. For a linear molecule, there is no rotation around its own axis because it leaves the molecule unchanged. Therefore, there are only two rotational degrees of freedom for any linear molecule that possesses 3N − 5 degrees of freedom for vibration.
- Number of fundamental vibrational modes for a linear molecule = 3N − 5
- Number of fundamental vibrational modes for a non-linear molecule = 3N − 6 where N = number of atoms in a molecule.
17.3.6 Solved Problems Based on IR Spectra
- Find the number of vibrational modes for the following molecules:
NH3, C6H6, C10H8, CH4, C2H2, CO, HCl.
For a non-linear molecule, the number of fundamental vibrational modes = 3N − 6
NH3− 6 (3 × 4 − 6 = 6)
C6H6− 30 (3 × 12 − 6 = 30)
C10H8− 48 (3 × 18 – 6 = 46)
CH4 − 9 (3 × 5 − 6 = 9)
For a linear molecule, the number of fundamental vibrational modes = 3N − 5

- State which of the following molecules are IR active. Why?
N2, CO, CO2, HCl, H2, O2.
N2, CO2, H2 and O2 — IR inactive
CO and HCl – active
All molecules cannot interact with IR radiation; only those molecules which exhibit change in dipole moment during a vibration can exhibit IR spectra. Hence, homonuclear diatomic molecules like H2, O2, N2, Cl2, etc., do not show change in dipole moment during vibration; consequently, they do not exhibit IR spectra. The heteronuclear diatomic/polyatomic molecules like HCl, BeCl2, NH3, CH4, C6H6, etc., show a change in the dipole moment and can exhibit IR spectra.
17.3.7 Applications of IR Spectroscopy
IR spectroscopy is a simple and reliable technique and is widely used in industry as well as in research, for analysis, quality control and dynamic measurement. It is also used in forensic analysis in civil and criminal analysis.
- Identification of functional group and structural elucidation
IR region broadly divided into functional group region (4000—1600 cm−1) and finger print region (1600—400 cm−1).
In functional group frequency region, the peaks corresponding to different functional groups can be observed; according to corresponding peaks, functional group can be determined.
In finger print region, each atom of the molecules is connected by a bond and each bond gives different characteristic peaks at the IR region; this region of IR spectrum is called finger print region of the molecule.
- Identification of substance
IR spectroscopy is used to distinguish whether a given sample of an organic substance is identical with another or not because the probability of any two compounds will produce identical spectra is almost zero. Hence, if two compounds have an identical IR spectra, then both of them must be samples of the same substance.
IR spectra of two enantiomeric compounds are identical; hence IR spectroscopy fails to distinguish enantiomers.
Example: IR spectrum of benzaldehyde is observed as follows:

As shown above, no other compound can produce same IR spectra other than benzaldehyde.
- Study of the chemical reaction progress
By examining a small amount of the reaction mixture withdrawn from time to time, the progress of chemical reaction can be determined. The rate of disappearance of a characteristic absorption band of the reactant group and/or the rate of appearance of the characteristic absorption band of the product group due to formation of new product is determined.
- Detection of impurities in the compound
IR spectrum of the test sample to be determined is compared with the standard compound; if any additional peaks are observed, it is due to impurities present in the compound.
- Quantitative analysis
The quantity of the substance can be determined either in pure form or as a mixture of two or more compounds; here, the characteristic peak corresponding to the substance is chosen and log I0/It of peaks for standard and test sample is compared. This is called base line technique for quantitative analysis of the substance.
- Qualitative analysis
IR spectroscopy is a highly important method for identification of compounds and functional group. Structural analysis can be done by using group frequencies; group frequencies are vibrations that are associated with certain functional groups. It is possible to identify a functional group of a molecule by comparing its vibrational frequency on an IR spectrum with an IR stored data bank.
17.4 NUCLEAR MAGNETIC RESONANCE SPECTROSCOPY
17.4.1 Principle
The analytical field involved with the interaction between radiofrequency radiation and nuclei of the molecule is called nuclear magnetic resonance spectroscopy (NMR). NMR is a powerful tool for the investigation of nuclear structure. In NMR, the energy source is radio waves; they are the lowest energy form of NMR. Radio frequency waves lie between 107–108 cycles per seconds. This frequency energy is not sufficient to vibrate, rotate o) exit the molecule or an atom. However, this energy is sufficient to affect the nuclear spin of the atoms of a molecule.
The NMR technique enables us to study the shape and structure of a molecule. It reveals only the different chemical environment of the various forms of nuclei present in molecule, from which we can ascertain the structure of the molecule with which we deal. By using this method, we can determine both quantitative and qualitative analysis of organic compounds in particular.
When the spins of protons and neutrons comprising nuclei are not paired, the nuclei of all these elements carry a charge; the overall spin of the charged nucleolus generates a magnetic dipole along the spin axes. The intrinsic magnitude of the dipole is a fundamental nuclear property and is called the nuclear magnetic moment (μ).
Depending on protons and neutrons present in the nucleolus, the spin orientation I will be changed.
- I = 0 for 10B, 12C, 14N, 16O, 32S etc., No spin, NMR inactive (Even number of protons and neutrons)
- I = ½ for 1H, 13C, 15N, 19F, 31P etc., Dipolar nuclei, NMR active (Odd number of protons and even number neutrons)
- I ≥ 1 for 2H, 10B, 14N etc., quadrupolar nuclei, NMR active (Odd number of protons and neutrons)
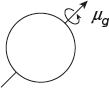
According to quantum mechanical terms, the nuclear magnetic moment of the nucleolus can align with an externally applied magnetic field strength (B0) in only 2I + 1 ways, either reinforcing or by opposing B0.
The energetically preferred orientation has the magnetic moment aligned parallel with the applied field (S = 1/2) and is often given the notation α, whereas higher energy anti-parallel orientation (S = −1/2) is referred to as β. The rotational axis of the spinning nucleolus cannot be oriented exactly parallel to the direction of the applied field B0 but must process about this field at angle with an angular velocity (w0) given by the expression.
![]() (1)
(1)
The constant γ is the magnetic gyroscopic ratio and the related magnetic moment μ and the spin number I for any specific molecule.
17.4.2 Instrumentation
The basic requirements for NMR spectrometer are as follows and shown in Figure 17.7.
- Very strong static and homogeneous magnetic field
- Sampling tube and sample preparation
- Stable radio frequency generator
- Radio frequency receiver/detector
- Recorder

Figure 17.7 NMR Block diagram
Very Strong Static and Homogeneous Magnetic Field
The magnetic field is the most commercial NMR spectrometer and may be either an electromagnetic or a permanent magnet; both must have the capability of producing a very strong static and homogeneous magnetic field. The produced field must be homogeneous to 1 part in 108 within the sample area and must be stable to similar degree for short period of time. The magnetic size is 15 inches in diameter and capable of producing strong fields up to 23,500 gauss for 100 mHz.
Sampling Tube and Sample Preparation
An NMR tube is a cylindrical tube made of special glass 18—20 cm in length and 5 mm in external diameter. The solution of sample should be to a height of 4—5 cm.
The ideal solvent should contain no protons or the solvent proton to have to be replaced by deuterium. The solvent used must be inert, low boiling and inexpensive. The sample size for proton magnetic resonance (PMR) on a continuous wave—nuclear magnetic resonance (CW—NMR) instrument should be around 30—50 mg in about 0.5 ml of solvent. However, for pulse transmission—NMR (PT—NMR) spectra, 1 mg of sample in 0.5 ml would be a strong solution.
Stable Radio Frequency Generator
Perpendicular to magnetic field, the radio frequency oscillator is installed to transmit radio waves of some mixed frequency such as 60, 100, 220 and 300 MHz. A sweep generator is installed to supply to the secondary magnet for high resolution work, and the frequency must be constant to about one part in 108.
Radio Frequency Detector/Receiver
It is installed perpendicular to both the magnetic field and the oscillator coil and is tuned to the same frequency as transmitter. When resonance occurs, the detector coil detects radio frequency signal and this signal is amplified and sent to the recorder.
Recorder
The recorder gives a spectrum a plot of strength of resonance signal on the y-axis and strength of magnetic field on the x-axis. The strength of resonance signal is directly proportional to the number of nuclei resonating at that particular field strength.
Therefore, the magnetic field increases linearly and the recorder pen travels from left to right, thus protons achieve resonance faster; the de-shielded proton appears on the left side—down field, whereas the shielded proton appears on the right side—up field of chart in the form of peaks. Tetramethylsilane (TMS) is shown at a peak value of δ = 0 ppm, hence, it is using as reference compound.
17.4.3 Chemical Shift
The difference in absolute precessional frequency of a particular set of protons of molecule and absolute vr of reference compound proton is called chemical shift.
(or) The difference between the absorption positions of a particular set of proton from the absorption position of a reference proton is called chemical shift of the particular set of protons.
Chemical shift = (absolute vs of particular set of proton) — (absolute vr of reference protons)
This formula gives the chemical shift values in Hz (cycle/sec). Chemically non-equivalent proton gives different chemical shift values. Chemical shift values for different types of proton are shown in Table 17.6.
Table 17.6 Chemical shift values

Conversion of Chemical Shifts in Hz into Field Independent Chemical Shift
In proton NMR spectroscopy, two measurement scales have been used to convert chemical shifts values from Hz to field independent chemical shifts and are measured in ppm. They are delta units, scale (δ) and tau units or scale (τ)
Delta Units or Scale (δ)
This scale is recent and advanced units, which set 15e reference (TMS) at arbitral 0.0 ppm for both 1H and 13C– NMR spectroscopy. Since the TMS reference is the extreme right, the δ values increases from right to left, that is, in the direction of weaker shielding.

All chemical shift values in δ units must be mentioned in ppm. The instrumental frequency is always equal to the precessional frequency of protons of reference compound.
![]()
Tau Scale (τ)
It is an old technique. In this scale, arbitrary put the reference of TMS at 10 ppm with scale number decreasing to the left. This is no longer used. For the sake of convenience, the τ scale values are taken in δ scale.
![]()
The commonly used units for chemical shift is δ values. The chemical shift in Hz depends on the strength of external magnetic field but in δ units are independent.
17.4.4 Spin-Spin Splitting, Spin-Spin Interaction, Spin–Spin Coupling or Fine Spectrum
In proton NMR, the signal due to a particular set of proton may not be a signal sharp peak but instead appears as a collection of peaks. The signal may be split into two or more peaks. The splitting occurs only between nuclei with different chemically or magnetically non-equivalent protons.
Splitting of signals occurs due to small interaction/coupling between two chemically non-equivalent protons, neighbouring proton or group of protons and is related to the number of possible spin orientation of neighbouring group proton. This is known as “spin-spin interaction/spin-spin splitting”.
Theory of Spin-spin Splitting
Splitting of signals in proton NMR is due to indirect spin-spin interaction. Spin-spin coupling of nuclei is transmitted through the intervening bonds but not through space. The number of lines in the multiple of particular set of protons of a molecule is equal to the total number of different precessional frequencies associated with those protons.
Example: Ha and Hb proton shows two precessional frequencies due to upward and downward orientation of Ha and Hb proton and gives a doublet.

Upward orientation of the neighbouring proton increases with the precessional frequency of reference proton but downward spin orientation of the neighbourhood proton describes the precessional frequency of reference proton. The number of lines in the NMR spectra is equal to the number of possible spin orientations of neighbourhood protons.
Example:

In the Ha peak split into triplet Ha, there should be three different precessional frequency coupling interactions and the neighbourhood proton should have three possible spin orientation and Ha appears as a triplet.
Possible spin orientations of Hb proton are as follows:

Out of the four, three are possible with 25%, 50% and 25%.
These three different possible spin orientations of Hb nuclei influence on Ha nuclei and coupling interaction is observed and the splitting of Ha nucleolus signal occurs in its PMR spectra as a triplet. Ha will have two possible spin orientations. Therefore, Hb proton split into two signals, that is, doublet.

Multiplicity by (n + 1) Rule
The number of peaks in 1H-NMR is referred as the multiplicity explained by (n + 1) rule. This rule gives multiplicity of signals of reference protons in the molecule; where n is the number of neighbouring protons of reference protons.
17.4.5 Magnetic Resonance Imaging
Magnetic resonance imaging, nuclear magnetic resonance imaging or magnetic resonance tomography is a medical imaging technique used in radiology to investigate the anatomy and physiology of the body in both healthy and sick conditions. It is commonly used in medical and nuclear physics. These techniques are explained by the basic concept of nuclear magnetic resonance spectroscopy.
Working Process of Magnetic Resonance Imaging
In nuclei having proton and neutron,
one way to model a proton is to think of it as a sphere composed of positive current loops that create magnetic dipole moment given by μp = 2.7928 μB. Actually, there are two ways that positively charged proton spins.

In these two ways, there is no presence of any magnetic field of the two states are same. When a proton is placed into an external magnetic field, it feels a torque that will tend to orient the magnetic dipole moment along the same axis as the magnetic field lines. However, angular momentum of the proton keeps it from aligning exactly and the magnetic dipole moment will process about an axis.
If we now direct an electromagnetic wave just the right frequency at proton, the precession of the μ of the proton will flatten out since it will tend to align with the magnetic field lines of the wave. By sending the em pulse, we give spin up protons enough energy to transition to the spin down state.
The human body consists mostly of water which contain hydrogen nuclei. Hydrogen nuclei have the strongest NMR signals. The MRI machine contains a large magnetic coil that can create a very large magnetic field. It also contains a second set of coils that create the electromagnetic pulse (RF pulse).
When the RF pulse is emitted, the spin up transitions to spin down state when we turn off the magnetic fields. The nuclei return to the magnetic fields. The nuclei return to the ground state and release energy. This energy that has varying intensity can be used to construct on image by a computer. The higher density, the brighter it will appear on the screen
17.4.6 High Resolution Proton Magnetic Resonance Spectroscopy
High resolution PMR spectrum gives the total number of peaks instead of a single peak in low resolution NMR. Here, the spectrum is split into a cluster of peaks; the possibilities are as follows:
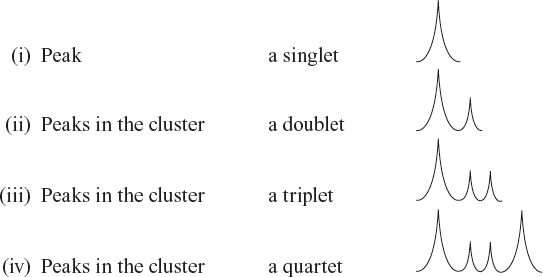
The same information get from a high resolution spectrum as well as low resolution spectrum; but in high resolution spectrum gives cluster of peaks instead of single peak as in low resolution spectrum. In addition, the amount of splitting of peaks gives important extra information in interpreting a high resolution spectrum.
Interpreting a High Resolution Spectrum
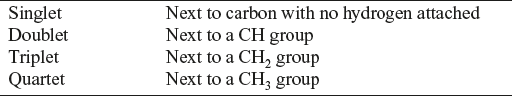
The n + 1 Rule
The amount of splitting gives information about the number of hydrogen atoms attached to the carbon atom or the next carbon atom. The number of sub peaks in the cluster is one more than the number of hydrogen attached to the next carbon atom.
Using the n + 1 Rule
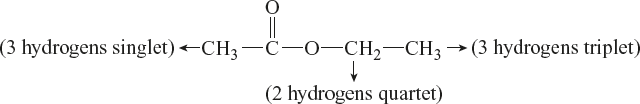
Example: C4H8O2

In a low resolution spectrum, there are three clusters of peaks observed with three different environments for hydrogen; in the three environments, the hydrogen ratio is 2:3:3. Here, there are eight hydrogen atoms altogether and represent a CH2 group and two CH3 groups.
Splitting Pattern
CH2 group at 4.1 ppm: Quartet gives information that next carbon is attached with the three hydrogen, that is, CH3 group.
CH3 group at 1.3 ppm: Triplet gives information that the next carbon is attached with the two hydrogen atoms, that is, CH2 group.
The combination of these two clusters of peaks one a quartet and other is triplet. It is a common ethyl group CH3CH2.
CH3 group at about 2.0 ppm: Singlet means the next carbon does not have any hydrogens attached. The compound is as follows:
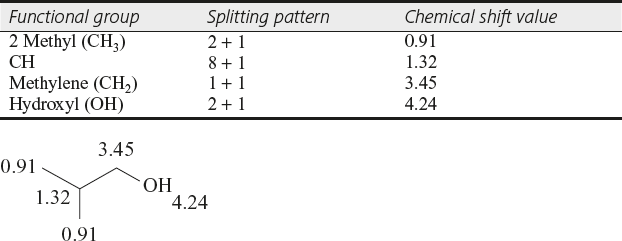
By using chemical shift data, it can identify the environment of each group.
17.4.7 NMR Applications
NMR has become an advanced and a powerful analytical technique that has found a variety of applications in many disciplines of scientific research, medicine and various industries.
Some applications of NMR are discussed here.
Solution Structure
This is the only method for atomic resolution structure determination of bio-molecules in aqueous solution under near physiological conditions.
Molecular Dynamic
It is used for quantifying motional properties of bio-molecules.
Protein Folding
It is the most powerful tool for determining the residual structure of unfolded proteins and structuring of folding proteins.
Ionisation State
It is used to determine the chemical properties of functional groups, bio macro molecules, such as the ionisation states of ionisable groups at the active sites of enzymes.
Drug Screening and Designing
It is used for drug leads and conformation compounds bound to enzymes, receptors and other proteins.
Hydrogen Bonding
It is used in direct detection of hydrogen bonding interactions.
Metabolite Analysis
It is a very powerful technology for metabolite analysis.
Protein Hydration
It is used in the detection of interior water and its interaction with bio macro molecules.
Chemical Analysis
It is used in chemical identification and conformational analysis of synthetic or natural chemicals.
Material Science
It is a powerful tool in research of polymer chemistry and physics.
Weak Inter-Molecular Interaction
Allowing weak functional interactions between macro bio molecules is yet to be studied.
17.4.8 Solved Problems Based on Proton NMR
- Explain the chemical shift values and draw the structure of a given compound.

Structure and chemical shift values:

- (ii)

Structure and chemical shift values:

- (iii)

Structure and chemical shift values:
- (iv)

Structure and chemical shift values:

- (v)

Structure and chemical shift values:

- (vi)

Structure and chemical shift values:

17.5 REVIEW QUESTIONS
17.5.1 Fill in the Blanks
- What is the range of UV _____________ and visible _____________.
[Ans.: 200—400 and 400—800]
- UV-visible spectroscopy is also called _____________.
[Ans.: Electronic spectroscopy]
- UV-visible spectroscopy predicts the _____________.
[Ans.: Unsaturation of organic and inorganic molecule]
- In UV-visible spectroscopy commonly used sources _____________ and _____________.
[Ans.: Deuterium arc and tungsten—halogen lamp]
- Carbonyl compounds involve _____________ electronic transitions.
[Ans.: n - π*]
- We observe the σ - σ* electronic transitions _____________.
[Ans.: Below 200 nm]
- The molecular vibration at which we observe change in bond length is _____________
[Ans.: Stretching vibrations]
- We observe electronic transitions in IR spectroscopy at the _____________
[Ans.: Vibration level]
- IR active molecules are called _____________
[Ans.: Permanent dipole moment molecule]
- The region that occurs at 4,000—1,600 cm−1 range is _____________
[Ans.: Functional group region]
- An IR instrument which converts thermal radiant energy to electrical energy is _____________
[Ans.: Detectors]
- _____________ and _____________ detectors are used in IR instrumentation.
[Ans.: Thermal and photon]
- _____________ is the energy source for NMR spectroscopy.
[Ans.: Radio waves]
- NMR is _____________.
[Ans.: Nuclear magnetic resonance spectroscopy]
- _____________ and _____________ scales are used to measure the chemical shift values in NMR spectroscopy.
[Ans.: Delta and Tau (τ)]
- Interaction between two chemically non-equivalent protons is called _____________.
[Ans.: Spin-spin interaction]
- τ = _____________.
[Ans.: 10 − δ]
17.5.2 Multiple-choice Questions
- How many electronic transitions we observe in UV-visible spectroscopy
- 4
- 2
- 3
- 5
[Ans.: a]
- UV-visible spectroscopy is also called
- Electronic spectroscopy
- Vibrational spectroscopy
- Rotational spectroscopy
- Vibration- rotational spectroscopy
[Ans.: a]
- The range of UV-visible spectroscopy is
- 200–800 nm
- 400–800 nm
- 200–400 nm
- None of these
[Ans.: a]
- Which of the following is responsible to absorb the UV-visible light by a molecule?
- Auxochrome
- Chromophore
- Both (a) and (b)
- None of these
[Ans.: b]
- Which is an auxochromic group?


- CN
- NHR
[Ans.: d]
- IR spectroscopy is called
- Rotational spectroscopy
- Vibrational spectroscopy
- Electronic spectroscopy
- None of these
[Ans.: b]
- IR active molecules are
- Electronegative elements
- Non-polar molecule
- Di—pole moment exhibiting molecule
- All the above
[Ans.: c]
- IR spectra detects
- Functional group
- Unsaturation
- Number of protons
- Nature of nuclei
[Ans.: a]
- In IR, what is the range of IR in cm-1?
- 200—800 cm-1
- 400—800 cm-1
- 200—400 cm-1
- 400—4,000 cm-1
[Ans.: d]
- What is the finger print region range in IR
- 4,000—400 cm-1
- 4,000—1,600 cm-1
- 1,600—400 cm-1
- No range
[Ans.: c]
- What is functional group range
- 4,000—1,600 cm-1
- 1,600—400 cm-1
- (a) and (b)
- None of these
[Ans.: a]
- What is reference compound in NMR spectroscopy
- Tri methyl silane (TMS)
- Di methyl silane (DMS)
- Mono methyl silane (MMS)
- None of these
[Ans.: a]
- Radio frequency range in NMR
- 105 − 102
- 107 − 108
- 1010 − 1012
- All the above
[Ans.: b]
- By absorbing radio wave frequency in NMR, changes are involved in
- Vibrational energy level
- Rotational energy level
- Nuclear spin orientation
- None of these
[Ans.: c]
- Multiplicity rule is
- n + 2
- n + 3
- n + 1
- n + 5
[Ans.: c]
- At _____________ spectrum observe clusters of peaks.
- Low resolution spectrum
- High resolution spectrum
- Medium resolution spectrum
- a & b
[Ans.: b]
- In NMR spectroscopy, we study
- Shape and structure of the molecule
- Chemical environment of nuclei.
- Mass of the molecule
- None of these
[Ans.: b]
- What are the units for δ scale?
- 4 m sec-1
- PPM
- Neuton
- Hertz
[Ans.: b]
17.5.3 Short Answer Questions
- Write a short note on electronic transitions.
Ans.: By the absorbing of electromagnetic radiation in the range of 200–800 nm, the electrons are involved in transitions in electronic energy levels.
In UV—visible spectroscopy, different types of electronic transitions such as σ- σ*, π- π*, n- σ* and n- π* are present.
- Explain auxochrome.
Ans.: It is a group which does not act as a chromophore but when it is attached to a chromophore, it shifts the absorption maximum towards the longer wavelength along with an increase in the intensity of absorption.
- Give an account of chromophore.
Ans.: It is group of molecules, which is responsible for the absorption of light by molecules. It is conjugated dienes.
- Write the factors affecting on the λ maximum and intensity of radiation?
Ans.: Factors affecting the λ maximum are as follows:
Structural factors are substitution, solvent and geometry.
1.
Non – structural factors are pH and temperature.
Factors affecting the intensity of absorption of radiation are Thickness of the medium and concentration.
- What do are determine by using UV—visible spectroscopy?
Ans.: UV—spectroscopy is usually applied to predict the conjugated double bonds, α, β unsaturated carbonyl compounds and organic complexes in a solution.
- What do we determine using IR spectroscopy?
Ans.: By the using IR, we detect the functional groups based on their bonds.
- Write the range of IR radiation.
Ans.: The IR radiation range is between 2.5μ and 25μ.
- How many regions do we observe in the graphical representation of IR spectroscopy?
Ans.: In the IR spectrum, we observe two regions:
- Finger print region
- Functional group region
- Write the applications of IR.
Ans.:
- Identification of functional groups
- Studying the progress of chemical reaction
- Detection of impurities
- Qualitative and quantitative analysis
- Explain the molecular vibrations in IR spectroscopy.
Ans.: Molecular vibrations in IR
- Stretching

- Bending

- Stretching
- Explain stretching vibrations.
Ans.: The bond angle remain the same but the bond length changes during vibrations.
Stretching is of two types:
- Symmetrical
- Asymmetrical
- Explain bending vibrations.
Ans.: Bond length remains the same but the bond angle changes during vibrations.
Bending is classified as follows:
- Inplane
- Outplane
- Write the factors affecting vibrational frequency in IR spectroscopy.
Ans.:
- Isotope effect
- Solvent effect
- What is the aim of NMR spectroscopy?
Ans.: NMR is a powerful tool for to investigate the structure of nuclei by using radio waves.
- What is the energy source in NMR and its frequency?
Ans.: The energy source for NMR is radio waves; its range is in between 107 and 108.
- Write a note on chemical shift.
Ans.: The difference between absolute precessional frequency of a particular set of protons of molecules and the absolute precessional frequency of reference compound proton is called chemical shift.
- What are the scales for chemical shift values in NMR?
Ans.: In proton NMR spectroscopy, two measurement scales have been used to convert the chemical shift in the Hz into field independent chemical shift.
- Delta (δ)
- Tau scale (τ)

- Explain spin—spin interaction.
Ans.: Splitting of signals occurs due small interaction between the two chemically non-equivalent protons and is related to the number of spin orientations possible of neighbouring group of protons. This is called spin-spin coupling or spin-spin interaction.
- Explain spin multiplicity rule.
Ans.: number of peaks in NMR is referred to as the multiplicity explained by (n + 1) rule, where n is the number of neighbouring protons of reference.
- What is high resolution spectrum in NMR spectroscopy?
Ans.: High resolution NMR spectrum form many of what looked like single peak in lower resolution spectrum are split into cluster peaks.
17.5.4 Descriptive Questions
Q.1 Describe the principle of UV—visible spectroscopy.
Q.2 Give detailed notes on instrumentation of UV—visible spectroscopy.
Q.3 Explain the electronic transitions in UV—visible spectroscopy.
Q.4 Write notes on applications of UV—visible spectroscopy.
Q.5 Define the following one with suitable examples.
(a) Auxochrome (b) Chromophore
Q.6 Give an account on factors affecting the position of the λ maximum and intensity of radiation.
Q.7 Write the basic principle of IR spectroscopy.
Q.8 Give an account on instrumentation of IR spectroscopy.
Q.9 Explain the molecular vibrations in IR spectroscopy.
Q.10 Write the application in IR spectroscopy.
Q.11 Give a detailed note on the basic principle of NMR spectroscopy.
Q.12 Explain the instrumentation of NMR with a neat sketch.
Q.13 Describe chemical shift. How do we measure chemical shift values in NMR spectroscopy?
Q.14 Give a brief note on spin-spin splitting and the theory of spin-spin interaction with examples.
Q.15 Write a note on magnetic resonance imaging.
Q.16 Explain the difference between low resolution spectrum and high resolution spectrum.