
19
CHROMATOGRAPHY
19.1 INTRODUCTION
The separation of a mixture by the distribution of its components between a mobile and a stationary phase is known as chromatography. Here, the mobile phase is solvent and stationary phase is column packing material.
Chromatography is a valuable analytical tool as it can separate mixture components. It is also a useful technique to obtain qualitative and quantitative information about each component.
The term “chromatography” is applied to a process in which mixture components are separated by differential migration. The differential migration is caused by flow of mobile phase.
It may also be defined as follows:
Chromatography comprises a group of techniques that are used to separate mixture components by the relative attraction of each component to the stationary phase. After the sample is added to the stationary phase, the mixture (sample) spends some of its time on the stationary phase and the remainder of its time in the mobile phase. It depends on the abilities of the sample components to be adsorbed on the stationary phase or to remain in the mobile phase. For example, a strongly adsorbed component spends more time on the stationary phase than a weakly adsorbed component.
Adsorption on the stationary phase is caused by the attraction between a polar or changed group on the stationary phase and a group of opposite polarity on the sample component.
Generally, the amount of adsorption on the stationary phase increases linearly until the adsorption sites on the stationary phase are completely occupied.
In other words, the amount of adsorption of a chemical species on the stationary phase usually increases as the concentration of the species on the mobile phase increases.
The amount of adsorption is also temperature dependent. Based on the adsorption, the mixture is partitioned or divided between the stationary and mobile phase and moves along the mobile phase at a controlled rate. As the mobile phase over use the sample and moves down the column, the components of the sample mixture are subjected to series of distributions between the phases. Individual components tend to migrate down the column at different rates and leave the column at different times.
19.1.1 Chromatography Timeline

19.2 CLASSIFICATION OF CHROMATOGRAPHY
Depending on the mobile phase and the attractive forces, chromatography is classified into the following categories:
19.2.1 Classification Based on Mobile Phase
- Depending on mobile phase, chromatography is mainly divided into liquid chromatography and gas chromatography.
- Liquid chromatography is further divided, depending on the liquid used and by applying conditions as follows:
- Classification based on type of liquid using aqueous, organic and super critical fluid chromatography (SCFC).
- Classification based on liquid condition—column (gravity flow), high performance (pressure flow) and thin layer (adsorption) chromatography.
- Gas chromatography is further divided into gas-solid and gas-liquid chromatography, depending on the stationary phase.
19.2.2 Classification Based on Attractive Forces
- Adsorption chromatography (for polar non-ionic compounds) and ion exchange chromatography (for ionic compounds)
If the analyte is an anion, the bonded phase has positive charge.
If the analyte is a cation, the bonded phase has negative charge.
19.2.3 Classification Based on Partition of Relative Solubility of Analyte in Mobile and Stationary Phase
- Normal chromatography—if the analyte is non-polar, polar organic stationary phase is used than mobile phase.
- Reverse chromatography—if the analyte is not polar, polar organic stationary phase is used than mobile phase.
19.2.4 Chromatographic Techniques on the Type of Support Material Used in the System
- Packed bed (column) chromatography, open tubular (capillary) chromatography and open bed (planar) chromatography
19.3 TYPES OF CHROMATOGRAPHY
Chromatography is divided into different categories, depending upon the nature of the stationary phase and mobile phase. Different types of techniques are listed in Table 19.1.
Table 19.1 Types of chromatography

19.3.1 Gas-Liquid-Chromatography
The concept of gas-liquid-chromatography (GLC) was first enunciated by Martin and Synge in 1914. It is the most elegant and useful of all the chromatographic techniques. GLC is also called as vapour phase chromatography, gas-liquid partition chromatography, gas partition chromatography and vapour fractometry chromatography. GLC is preferred for the separation of species other than low boiling point materials.
In GLC, a solid porous support (diatomaceous earth or crushed fire brick) is coated with a thin film of liquid phase. The coatings are normally non-volatile and chemically inert. While passing the sample solution through the column, the components of the mixture are separated by differential migration.
Instrumentation
The main components of GLC can be divided into four sections as follows:
- Carrier gas
- The column and packing materials
- Sample introduction
- Detectors
Carrier Gas
Carrier gas functions as a mobile gas phase, which progresses the sample down the column. In order to perform this function, the flow of carrier gas should be controlled. The carrier gas supply system comprises a needle valve, a flow meter, a pressure gauge and a few feet of metal capillary restrictors.
A high pressure gas cylinder is used as a carrier gas reservoir; usually, N2, H2, He, Ar and CO2 gases are used as carrier gas. The choice of the carrier gas depends partly on the composition of the sample. For example, H2 and He are used when thermal detectors are employed since the thermal conductivity of H2 and He is much higher than other carrier gases. The carrier gas normally used is helium since it is more easily removed by differential pumping than any other gas and it is a high ionisation potential (22 eV).
Flow Rate
The flow of carrier gas is caused due to the pressure difference between the inlet and outlet of the column. The rate of gas flow in particular analysis depends on the diameter of the column. For every separation procedure, there is an optimum carrier gas flow rate which has to be determined experimentally. Normally, the gas flow rate is around 10–400 mL/min. The flow rate should be maintained below 1% in order to reduce analytical errors. The rate of gas flow is constant when the inlet pressure remains constant. Generally, the rate can be measured by using rotameter or a sample soap bubble flow meter which gives an accuracy of about 1%.
Column and Packing Materials
Several techniques are employed for coating support particles with stationary liquid phase. In one method, a known weight of support is mixed with three or four times of solvent. The solvent is then evaporated often in a rotatory stripper, to give a dry, free flowing solid. The flowing solid is slowly poured into the column with gentle tapping.
There are two types of columns which are commonly used. They are packed columns and capillary columns or open tubular columns.
Packed Columns
The packed column is a tube, packed with a suitable material like tubing glass, stainless steel or copper materials. The internal diameter of the column is usually between 4 and 8 mm. The length of the column may be between one and five m; very long columns are best constructed by coupling shoot (less than 3 m) sections, to any desired length.
Open Tubular Columns
Open tubular columns vary in length between 10 and 100 m. The inner diameter of open tubular columns is often between 0.2 and 0.5 mm. Most open tubular columns are constructed with glass or fused silica rather than metal because metals can catalyse several chemical reactions within the column temperature.
Types of Solid Support
The solid support serves to hold in liquid stationary phase when exposed to mobile gas phase; it should not possess adsorption properties towards the components of the sample. It serves as a mechanical matrix for the liquid phase.
The most common solid support is derived from diatomaceous earths and are the skeletal remains of the unicellular algae known as diatoms. They are also known as kieselguhr. Diatomaceous earths primarily consist of hydrated silica groups, represented as follows.

If the diatomaceous earths is heated to about 900°C and crushed to particle of uniform size, the resultant pink substance is known as chromosorb-p; it possesses polar functional groups which make it a good adsorbent. If chromosorb-p is not coated with a liquid base, it can be used as the stationary phase in GSC. The polar sample components can be adsorbed on chromosorb-p as well as dissolved in the stationary liquid coated on the support.
If the diatomaceous earth is heated in the presence of Na2CO3, a white solid called chromosorb-w is obtained. In addition to the products of the diatomaceous earths, several other substances such as powdered Teflon, graphitised carbon black, volcanic bacteria, armeenan neomberian deposits, activated carbon, many organic polymers, alumina, silica gel, aluminium, silicon, MgO, MgCO3, vermiculite and glass are also used. Beads have been used as solid support; if the solid support is more polar, then it can be deactivated (made with a paper) by coating of dimethyl chlorosilane (DMCS) or by rinsing the support within a solution of a strong acid (usually, HCl). Acid washing retains metallic impurities on the support and coats some of the polar sites.

Upon washing with alcohol, the second chloride is also replaced by a methoxy group.

The adsorption effects can also be minimised if the celite is treated with silating agent, such as hexamethyl disilane or dimethyl dichlorosilane.
Stationary Liquid Phase
The stationary phase should be a liquid that is virtually non-volatile at column temperature. The choice of liquid phase (stationary phase) depends on the composition of the sample.
The mobile phase competes with sample components for adsorptive sites on the stationary phase. If the polarity of the mobile phase increases, it results in greater adsorption of mobile phase molecules on the stationary phase and a decrease in the number of adsorptive sites which are available for the sample components. Consequently, increasing the polarity of the mobile phase decreases the retention time of the sample components. Alternatively, the sample components can be thought of as partitioning themselves between the stationary phase and mobile phases. The polarity of the mobile phase increases the concentrations of the components in the mobile phase increase and the retention time decreases.
Generally, it is found that the polar substance is most satisfactorily analysed on a polar stationary phase. Similarly, a non-polar compound will show the best results on a non-polar phase.
Example: For separation of polar components like alcohols, amines, etc., it is preferable to choose a polar liquid like polyethylene glycol.
The general requirements for a good liquid phase are as follows:
- It should be essentially non-volatile at the temperatures to be used.
- It must be thermally stable.
- It should yield the appropriate value for the components to be studied. It should be neither too small nor too long.
- It should be readily available in a reproducible form.
- It should be chemically inert towards solid or if it reacts, it should be fast and reversible.
- The liquid should have a very low vapour pressure.
- It should be a good solvent for a component of the sample.
A single liquid does not melt a requirement for all possible solutes. Some are needed for low temperature, others for high pressures. For some studies, a non-selective liquid is desirable; for others, a highly selective phase is needed. The choice of the liquid is often based on the availability and habit.
Column Preparation
Several techniques are employed for coating support particles with a stationary liquid phase. In one method, a known weight of support is mixed with three to four times of volatile solvent. The solvent is then evaporated, often in a rotatory stripper, to give a dry, free following solid. The following solid is slowly poured into the column with gentle tapping. Usually, two types of columns—packed and open tabular columns— are encountered in GLC.
Sample Introduction
In this technique, the sample must be introduced into the column in the form of a compact “plug”. For this purpose, the following methods are used.
Syringe Method
In this method, the samples are directly injected at the inlet part within a short period with the help of micro syringe. In commercial instruments, a rubber septum is used.
Liquid samples are also introduced with syringes (0.1–100 mL capacity) as neat liquids or solution. The sample is drawn into the syringe without any air bubbles.
Gaseous samples are introduced into the column by the gas light syringe, by pass loop system or by the use of valves.
Solid samples can be introduced into two ways; the solid sample is dissolved in a suitable solvent and injected as a solution or the solid is packed into the end of the syringe by “tapping”. In some methods, the sample is injected directly into the instrument through a septum by a plunger (Figure 19.1).

Figure 19.1 Syringe method
Valve Method
This method is especially convenient for sample gas stream or shown in Figure 19.2.
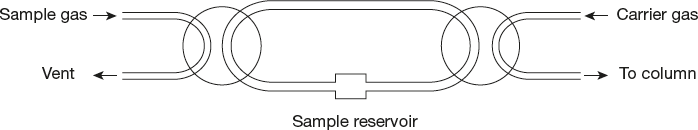
Figure 19.2 Valve method
As shown in Figure 19.2, when the No. 1 valve is turned at 90°C, the sample reservoir is filled with sample gas. After returning to its original position, No. 2 valve is turned at 90°C, so that the measured carrier gas is filled into the column. Many ingenious modifications have been constructed by fusing a single stop lock with multiple openings.
Ampule Method
It is a precise method to introduce the sample, but the least convenient. The sample is sealed in a fragile glass ampule and weighed. The sample is then inserted into a special, heated chamber at the head of the column, where it is surrounded by following carrier gas. When the temperature reaches a certain range, the sample is vaporised almost in simultaneously and is swept on to the column (Figure 19.3).

Figure 19.3 Gas-liquid-chromatography
Detectors
The function of the detector is to detect and measure the difference of the sample as they immerse from the column. The choice of the detector depends on the type of analysis being performed. High sensitivity can be achieved by using a flame detector and the sample is destroyed in the process. High selectivity can be achieved with electron–couple detectors. Other detectors such as the thermal conductivity detectors are non-selective and non-destructive.
According to Haler, detectors can be classified into two major families; they are detectors can respond to the concentration (in mole fraction) of the solute in the carrier and those that respond to the mass flow rate of the solute (in moles per unit time).
First Family Detectors
Thermal Conductivity Detector
Thermal conductivity detector (TCD) is a simple and most widely used type of detector. TCD introduced by ray in 1914 the and is also known as katharometer. It is based on the principle that all gases have the ability to conduct heat, but in varying degrees. The difference in heat conduction can be used to quantitatively determine the composition of a mixture of gases.
The schematic diagram of TCD is shown in Figure 19.4.

Figure 19.4 Thermal conductivity detector
As shown in Figure 19.4, the detector consists of a hallow tube with a wire situated in the central axis. The wire is electrically heated when only the carrier gas flows over it; a thermal balance can be obtained at a certain temperature under the condition of steady temperature and the electrical resistance of the wire is steady. When a different gas (e.g., a sample component) flows over the wire, there is a change in the thermal conductivity of the surrounding gas. Heat is conducted away from the wire at a different rate. The temperature of the wire changes by using resistance for detection and estimation of the unknown sample components.
β-ray Argon Ionisation Detection
The electron capture (or electron affinity) detector operates on the basis of electron by compounds that have an affinity for electrons. Thus, the compound must have an electro negative group or element.
The detector consists of two electrodes (as shown in Figure 19.5) across which a potential difference of 10–100 V can be applied. The source of electron or β-rays is tritium rather than Sr90. Tritium is a radioactive gas that emits β-rays. It is usually installed in the form of a tantalum wire saturated with tritium. The β-rays or electrons traverse the effluent from the gas chromatogram. Many compounds such as paraffin and simple hydrocarbons, are virtually transparent to electrons, but organic halides, phosphorous or nitrogen compounds are not transparent to the electrons and the latter are captured by such compounds.

Figure 19.5 Cross section of detector
As the carrier gas (nitrogen) flows through the detector, β particles from the tritium source ionise the nitrogen molecules and form slow electrons. These slow electrons are create a fixed voltage to the anode. When these electrons are collected at the collector electrode, they produce a steady current which provides a base line on the recorder.
When the organic compounds which contain halogen, nitrogen and phosphorus pass through the column, there is some variation in the number of electrons reaching the collector electrode and thus provides the detection signal.
Argon Ionisation Detectors
In the argon ionisation detector, argon must be used as the carrier gas in the chromatography separation. The detector contains two electrodes placed parallel to each other and a potential difference is applied across them.
Under normal conditions, the carrier gas (argon) acts as an insulator and no current flows between the electrodes. A radioactive source (tritium) is placed in the approach region to the electrodes so that the rays emitted by it excite the argon atoms and the electrons are produced by a thin bombardment action.
When the carrier gas electrodes emerge out of the column, no current passes across the electrodes under normal condition as the gas is a non-conductor. When it is subject to ionising radiation (β rays), the carrier gas produces a steady supply of positive ions and free electrons which can be measured as a standing current between two changed electrodes. The reactions which take place in the detector can be represented as follows.

When the sample components pass through the detector, the standing current may be perturbed components containing highly electronegative atoms that capture free electrons very efficiently. They are detected by the decrease in the standing current. This occurs because of the increased rate of recombination of positive and negative ions, compared with positive ions and electrons. Other species have a little effect on the ion current, thus, electron the capture detector is highly selective and very sensitive for compounds containing halogens, phosphorus, peroxides, amines, quinones, alcohols, nitro compounds and poly nuclear aromatic ring systems. They do not detect H2O, CH4, O2, CO2, N2, CO, C2H6 or fluorinated compounds (CXFX). The sensitivity of the detector is 0.08 mg/ml and the linear dyanionic range is 105. The detector is suitable for measurement or organic molecules present over a wide range of concentrations.
Second Family Detectors
Flame Ionisation Detector
The flame ionisation detector is the most widely used detector in gas chromatography. Its linear dynamic range is approximately 107. It was introduced by William and Dewar. These detectors are based on the electrical conductivity of the gases. At normal temperatures and pressures, gases act as insulators, but if electrons are present, they will become conductive ions.
Hydrogen flame detector is one of the simplest detectors; in this detector, hydrogen must be used as a carrier gas. In this detector, the effluent from the columns is led into an oxy-hydrogen flame. As shown in Figure 19.6, two wire electrodes are placed in a flame. An electrical potential is applied across the electrodes.

Figure 19.6 Flame ionisation detector
When only the inert carrier gas enters the flame, the current across the electrons is constant. When an organic compound from the end of the chromatography columns enters the flame, it is broken up into fragments that are highly conducting. These ions result in ionisation current and there would be consequent change in the current flowing across the electrodes. The magnitude of the variation in current would be directly proportional to the number of ions or the electrons formed in the flame gases, which in turn, would be proportional to the carbon content of the organic molecules in the vapour.
Thus, the detector is capable of detecting 10−12 g of organic material. It has secured disadvantages such as it is not sensitive to many inorganic compounds (O2, H2O, CO2, NH3). The change in conductivity depends on the particular molecules; hence, its response to organic compounds depends on the particular molecules.
19.4 CHROMATOGRAPHY THEORY
19.4.1 Distribution Coefficient or Partition Coefficient (K)
The distribution coefficient is defined as the ratio of the concentration of the species in the stationary phase CS to the concentration of the species in the mobile phase Cm.
![]() (1)
(1)
The distribution coefficient (K) is related to the velocity of a comparent which moves along the stationary phase during development. As K increases, the average velocity of motion decreases. As different components have different distribution coefficients for a particular set of experimental conditions, the distribution coefficient of a component could be compared to the coefficients of known species for quantitative analysis.
19.4.2 Retention Time (tR)
A more easily measured parameter, which can also be used for quantitative analysis, is the retention time (tr) of a chemical species.
The retention time is the time required to elute a sample component from the station any phase, that is, it is the time required for the mobile phase to sweep the component from the stationary phase. From this definition, we can write the following equation rate.
 (2)
(2)

19.4.3 Retention Volume (VR)
The retention volume is the volume of the mobile phase required to elute the sample component from the stationary phase. The retention volume, VR, is proportional to the retention time and to the flow rate. The flow rate (F) is normally measured at the end of the column; hence the true flow of rate (FC) at the column temperature TC, is
![]()
The retention volume at the column temperature and atmosphere pressure is then;
![]() (3)
(3)
However, a pressure gradient exits down any column, and it is necessary to introduce and additional correction factor, J, to correct the gas volume for compressibility in the column.
The corrected absolute retention volume VR is thus:
![]()
This can be seen from Figure 19.7.

Figure 19.7 Chromatography retention times or volumes against to detector response
As shown in Figure 19.7, an air peak after appears in a chromatogram from the unretained air injected with the sample, and the time for this to appear is taken as tm. Relative retention values (α) are obtained by comparing the specific retention volumes (Vg) of the solute under consideration with some standard solute whole behaviour on the particular column in use being precisely known.
![]() (4)
(4)
This is the ratio of the retention time or volume of the substance, after correction for tm and Vm to the corrected retention time of volume of a reference compound.
As the retention volume at a constant flow rate is proportional to the retention time, the two definitions of relative retention are equivalent. The direct proportionality between the distribution coefficient ‘K’ for a substance and the corrected retention time or retention volume of the substance makes it possible to express the relative retention in terms of distribution coefficient.
![]() (5)
(5)
Where α = relative retention.
In ion-exchange chromatography, the relative retention (Equation 5) is sometimes called the separation factor.
19.4.4 Plate theory
The plate theory was first introduced by Martin and Synge from the distillation theory of columns. A theoretical plate can be thought of as a single equilibrium of the sample component between the stationary and mobile phases or a theoretical plate is the portion of column in which an equilibrium exists.
This equilibrium indicates the existence of a single component between a stationary phase and a mobile phase.
The column efficiency can be explained based on the number of theoretical plates, N. As the number of theoretical plates increases, the column efficiency also increases. Thus the number of theoretical plates N, is used as measure of column efficiency. Clearly, the product of these two terms is the column length L,
That is, L = N++
The height equivalent to one theoretical plate is defined by ![]()
“H” decreases as the efficiency of a column becomes greater, that is, as “H” becomes smaller, the number of equilibrations that occur in a given length of column become larger.
Resolution
Resolution is a measure of the degree of separation of adjacent peaks. Two general factors will determine the effectiveness of the separation distance between the zone centres as they migrate and compactness (overlap) of zones. As the distance between the zone centres increases, the degree of separation increases and a measure of the difference is termed resolution.
As the zones travel, they tend to spread and broaden and even though the zone centres are well separated, overlapping of the bonds can occur. This is illustrated as shown in Figure 19.8.

Figure 19.8 Resolution and the measure of the degree of separation
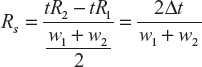
The resolution of two peaks from each other is defined as resolution ![]() (1)
(1)
where Δtr or ΔVr is the separation between peaks (in units of time or volume) and w is the width of each peaks, in corresponding units (w = 4σ). For simplicity, we assume that w is same for both peaks. Figure 19.8 shows how two peaks are separated at various values of resolution. When resolution = 0.5, the overlap of the two peaks is 16%; when resolution is = 1.0, the overlap is 2.3% and overlap is reduced to 0.1 at a resolution of 1.5. It can be shown that the resolution is given by
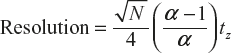 (2)
(2)
Factors Affecting Separation
In GLC, the following parameters are of practical interest and can be altered to improve the efficiency of the separation.
Particle Size and Surface Area
An increase in the surface area or a decrease in particle size tends to increase the number of theoretical plates. In general, a 60/80 mesh particle size is usual into a quarter- inch column.
Carrier Gas Flow Rate
There is an optimum flow rate which gives the maximum efficiency. This parameter can be experimentally determined. If the gas flow rate is very slow, the eluted peaks will tend to be broad while if the flow is too fast, the peaks will not resolved.
Type and Amount of Stationary Phase
It is a key factor in determining the efficiency of the column. Therefore, considerable care must be exercised in choosing the correct stationary phase. If the wrong liquid is chosen, separation will not be obtained.
The amount of stationary phase will affect the column performance in several ways. As the concentration of the liquid phase increases, the number of the orbital plates for the column will also increase. Excessive liquid support can also cause tailing in the chromatogram. In general, light broadening is preferred and most columns contain from 1–5% liquid phase.
Column Length
As the length of the column increases, the number of theoretical plates will increase. There is a practical limit to the length because problems relating to the gas flow are encountered with long columns. Most columns are between 1 and 10 m (excluding capillary columns).
Column Diameter
As the diameter of the column decreases, the number of theoretical plates will increase.
Column Temperature
The maximum temperature for the column is determined by the vapour pressure of the liquid phase—the vapour pressure of the sample and the efficiency of separation. The temperature should not be high enough to vapourise the stationary phase. As this will destroy the uniformity of the column, on the other hand, the temperature has to be high enough to maintain the sample in the vapour state. Hence, adjustment of the temperature is made to give high numbers of theoretical plates, which leads to optimum resolution, while maintaining reasonable elution times for the components of the sample.
19.5 HIGH PERFORMANCE LIQUID CHROMATOGRAPHY
Liquid chromatography is a slow separating technique and is performed in vertical columns under gravitational force.
High performance liquid chromatography (HPLC) is a high resolution and high speed liquid chromatography since it makes use of high pressure to force liquid through a column, and is packed with very efficient particles of a very small diameter. This arrangement provides a high inlet pressure up to 10,000 psi and gives reasonable flow rate. Therefore, the versatility has been achieved by using smaller diameter and large surface area particles and by using suitable packing structure. Therefore, the HPLC has seven times more resolving power than liquid chromatography.
Apart from flow changes, HPLC is analogous to liquid chromatography in many ways as follows.
- The low pressure pumps are replaced by high pressure pumps is which can produce pulse free inlet pressure of 600–1000 psi.
- HPLC provides great reduction time in comparison with conventional liquid chromatography. Furthermore, this reduction is accomplished over a wide range of unknown sample concentrations, including trace levels with a high degree of precision and accuracy.
- HPLC is capable of generating high column efficiencies. That is, plate heights are extremely small in comparison with conventional liquid chromatography. Therefore, a very low number of plates are possible given column lengths.
- HPLC is applicable not only to the separation of lower molecular weights, but also to macromolecular compounds. Furthermore, separations based on adsorption, partition, ion-exchange and size exclusion are possible. For these reasons, HPLC may be significantly greater than other chromatographic techniques.
19.5.1 Instrumentation
The various components of HPLC are described as follows and shown in Figure 19.10.
Column Packing Materials
The size and diameter of the particle influence the efficiency of the column. Usually, 30–50 µm diameter porous type material is coated as a thin layer in the column. This liquid thin layer is chemically or covalently bonded to the solid support so that it is not washed away by the mobile liquid phases under high pressures.
The esterified silicon packing is not very suitable, since it gets hydrolysed and also gets exchangeable with lower alcohols. To avoid this, generally, silicon polymers are used as packing material as these polymers have three-dimensional cross-linked structure and are very stable.
The stationary liquid phase is covalently bonded to the silica surface by the reaction as follows (Figure 19.9):

Figure 19.9 Diagram of C8H17 groups bonded to silica

The efficiency of the column is increased as the particle size is decreased. This can be observed by plotting plate height versus linear velocity.
As shown in Figure 19.10, the reduction of particle size from 45 to 6 µm results in a ten-fold or more decrease on plate height.

Figure 19.10 Plate height versus linear velocity
Column Parameters
Column Length
Column length is an important experimental parameter that controls the number of available plates. This, in turn, influences the resolution and retention time. The actual length of the column used in HPLC is usually determined by the resolution required, inlet pressures and type of analysis. The column length should be around one to five metres. In some cases, longer columns are used in order to detect large samples. These can be made by connecting a series of short columns with dead volume connections.
Column Diameter
The inner diameter of HPLC columns range from two to five mm since the sample capacity varies with the diameter. Larger diameter columns are only used for preparative HPLC. If short columns are used, they are usually used as linear columns.
Sample Introduction
Sample can be introduced by any one of the following methods:
- Syringe septum injection
- Stop-flow injection
- Sample valve injection
Syringe Septum Injection
In this type of system, the sample can be introduced directly into the column through a self-sealing electrostatic system. For this reason, micro syringes are designed to withstand pressures up to 1,500 psi.
Stop-Flow Injection
Stop-flow injection is the second type of syringe injection in which no septum is used. Hence, the solvent flow is momentarily stopped.
Sample Valve Injection
The most widely used sampling devices are now sampling valves or loops. Sampling loops permit the introduction of samples at pressures up to 7,000 psi.
Pumping Systems
In HPLC, two or more suitable pump systems are connected to several reservoirs (Figure 19.11). The pumping system must have the following requirements:
- Generations of pressure up to 10,000 psi (Ibx/in2)
- Pulse-free output
- Flow rates ranging from 0.1 to 10 mL/min
- Flow control and flow reproducibility of 0.5% or better
- Corrosion-resistant components (seals of stainless steel or Teflon)
There are three types of pumps, namely reciprocating pumps, syringe or displacement type pumps and pneumatic or constant pumps. These are explained as follows.
Reciprocating Pumps
Reciprocating pumps usually consist of a small chamber in which the solvent is froth pumps by the back and motion of a motor driven piston. These kinds of pumps contain about 2–3 µm filter to prevent dust from getting into the pump heads. Excessive dust will clog the filter and lead to poor performance.
The advantage of reciprocating pumps include their small internal volume (35–400 µL), high output pressures (up to 10,000 psi), ready adoptability to gradient elution and their contact flow rates, which are largely independent of column back-pressure and solvent viscosity.
Displacement Pumps
Displacement pump usually consists of large, syringe-like chambers equipped with a plunger that is activated by a screwdriver mechanism, powered by a stepping motor.
The liquid displacement pump is capable of producing the highest pressures available for HPLC (>75,000 psi). Normally, inlet column pressures of this type should not be encountered in HPLC if this kind of pressures is required to achieve a reasonable flow. The availability of those pressures are useful in HPLC for packing micro-sized stationary phase particles.

Figure 19.11 Block diagram of HPLC
Flow Control and Programming System
Most commercial HPLC instruments are equipped with computer-controlled devices for measuring the flow rate. Many instruments have some devices for varying the compositor of the solvent either simultaneously or in a step-wise fashion.
Solvent Treatment
The solvent used in HPLC must be of high quality. Therefore, solvents should be filtered before injection. In order to remove dust particles, the solvent is passed through a pre-column in which impurities will be collected.
In liquid chromatography, the sample is more like the solvent; then, it is necessary to make the solvent less like the sample by changing the solvent property.
Detectors
The detectors used in HPLC can be classified in general terms as bulk property detectors and solute property detectors. The bulk type detector functions by measuring a bulk physical property of column eluent, while the solute type detector functions by measuring a physical under chemical property of a solute. The bulk property detector will have a sensitivity of about 10-6 g/mL and the solute property detector about 10-9 g/mL.
Detectors used in HPLC are as follows:
- Refractive index
- Dielectric constant
- Electrical conductivity
- Thermal conductivity
- UV and visible
- Fluorescence
- Radioactivity
- Electron capture
Of all these detectors, the most commonly and widely used detectors are refractometer detectors and UV detectors. The differential refractometer detector is often called a “universal detector”.
Refractive Index Detector
The refractive index detector is a differential refractometer and measures the refraction of a light beam. It arises due to the difference in refractive index between the sample and the reference channel. The sample channel contains mobile phase plus solute from the column while only the mobile phase passes through the refractive channel.
In the operation of the refractive index detector, the lens are adjusted to the light beam, and the parallel beam passes to the mirror through the sample and reference cells. The mirror reflects the beam back through the cells and lens which focuses the reflected light into a photo cell. The angle of deflection arising from the difference between the two cells causes the angle changes. Finally, the photo cell measures the change in the beam intensity. The signal is then amplified and recorded (Figure 19.12).

Figure 19.12 Refractive index detector of HPLC
19.5.2 Theory of High Performance Liquid Chromatography
Equilibrium Constant
If the chromatographic system attains equilibrium, the ratio of the concentrations of the solute in the two phases is constant and can be expressed as equilibrium constant. Thus, for a two component mixture of solute 1 and 2 are as follows:

where KD1 and KD2 are the equilibrium constants for solutes 1 and 2. C is the concentration of solutes in stationary phase(s) and mobile phase (m).
Desorption
Desorption of 1 and 2 in the columns at a given time is shown in Figure 19.13, assuming the system is at equilibrium.

Figure 19.13 Chromatographic retention time or volume versus detector response
Directive of Mobile Phase Flow
Concentration of solute in mobile phone

Retention Time and Volume
The appearance of peaks in the effluent can be expressed in terms of retention volumes. They characterise the particular components and are described on the basis of a chromatogram. The chromatogram is obtained by plotting detector response on y-axis and time or volume on x-axis.
As shown in Figure 19.13, tR1 and tR2 are the retention times for components 1 and 2 and tm is the relation time for a solute which does not participate in the sorption–desorption process. It passes through the column at the same rate of the mobile phase. This volume (occupied by a solute or air) is often referred to as the dead volume of the column.
In order to find out the variable components in the chromatography method, it is essential to calculate the corrected retention times, tR or net retention time tN given as follows:

When the chromatographic experiment is performed at a constant known flow rate, the position of each peak can be expressed as a retention volume:

where VR1 VR2 and Vm are the retention volumes for peak 1, peak 2 and a solute that is not sorted respectively.
Separation Ratio
The ratio of the distribution coefficients for each of the two components is called the separation ratio, α and is given by

By definition, the component having the larger KD value is designated as KD2. Therefore, the numbered value for α must be greater than or equal to one if both components have the same KD value.
If chromatographic peaks are defined in terms of retention times as shown in Figure 19.13, the separation ratio is given by

The actual values of the distribution coefficients for the components 1 and 2 are also important in determining the case of separation. For example, both of the following provide the same α values.
![]()
As shown in the above mentioned values, the latter separation valid required a much larger analysis time.
Capacity Ratio or Capacity Factor (K′)
Capacity ratio is defined as the ratio of concentration of the solute in the two phases. It is also referred to as the capacity factor (K′).

s and m indicate the stationary and mobile phases respectively. It is an important equation in chromatography since it relates the equilibrium distribution of the solute within the column to the thermodynamic properties of the column; graphical representation is shown in Figure 19.14.

Figure 19.14 Equilibrium distribution of the solute between mobile and stationary phase
If one solute molecule were to be followed through the column, it would spend a fraction of its time in the stationary phase and a fraction of its time in the mobile phase. The average fraction of time in the stationary phase is given by by Q5/Q5 + Qm and the average fraction of time in the mobile phase is given by ![]() .
.
![]()
When the mobile phase moves down the column at constant velocity V, the solute molecule in the mobile phase moves at the velocity V, but remains static in the stationary phase.
Therefore, the average velocity of the band will depend on the velocity V, of the mobile phase, and the fraction of time, the solute is in the mobile phase. The band velocity Vband is given by
![]()
Isotherms (Peak Shapes)
If the distribution coefficient (KD) is independent of concentration, a plot of the concentration of the solute in the stationary phase versus the concentration in the mobile phase provides a linear distribution isotherm. A graph of this type is called linear distribution isotherm. The slope of the linear isotherm gives the distribution coefficient.
![]()
Non-linear isotherms are also formed when the distribution coefficient is dependent upon the concentration, which causes the elution peak to be skewed and the retention or volume to change with sample concentration.

Figure 19.15 Graph showing isotherms
As shown in Figure 19.15, the isotherm has been used to describe a non-ideal inter molecular attraction. For example, convex isotherms are usually encountered in column chromatography due to the formation of hydrogen bonding between the solute and stationary phase.
The concave isotherm is often characteristic of an end-on orientation of the solute molecule towards the stationary phase surface. These peaks will arise due to over loading of the column with excessive sample. Due to variation in the activity of the available adsorption sites, most systems depart from linearity.
Resolution
Resolution is defined as the degree of separation of two chromatographic peaks. By definition, it is the distance between the peaks centres divided by the average bandwidths which are expressed in the same units. It can be explained for the two component system based on Figure 19.16.
where w is expressed in the same volume units as v. Where the two peaks are close together, w2 approaches w1 and ![]() .
.
It is important to note that resolution depends not only on the distance between the peaks, but also on the narrowness of the peaks. The former is determined by the column which is subject to the nature of the stationary and mobile phases. The latter is determined by the column efficiency, which, in turn, is a function of column parameters such as flow rate, particle size, particle diameter and packing of the column.
Factors Influencing Resolution
Resolution is related to the efficiency, selectivity and capacity factor; hence, control of resolution is possible by controlling these three fundamental parameters. The influence of the three are illustrated in Figure 19.16.

Figure 19.16 Efficiency, selectivity and capacity factor affect the resolution
As shown in Figure 19.16, an increase in efficiency (narrowing of peaks) increases resolution as shown in (b) in Figure 19.16. An increase in resolution, through the separation of the bands (d) is achieved by altering column selectivity, so that peak 2 is sorbed to greater extent. In (a), poor resolution is obtained because of low capacity factor in that neither peak is appreciably sorbed.
Efficiency
Column efficiency is quantitatively expressed by the number of theoretical plates N in the chromatographic bed.
When a solute band passes through the column, several factors will contribute to the broadening of the zone. The efficiency of the column numerically describes the extent to which the band is broadened and is dependent on a variety of column and kinetic parameters.

Figure 19.17 Calculation of N
As shown in Figure 19.17, the number of theoretical plates is given by
![]() (1)
(1)
where σ2 is the variance of the peaks in time units, tR is the retention time for the peak and w is the width of the peak at its base in time units. In units of volume equation (1) is
![]()
where VR is the retention volume, and w and σ are measured in volume units.
Column efficiency can also be expressed in terms of the plate height, H (HETP) or height equivalent to a theoretical plate. Thus,
![]()
where L is the length of the column bed. Since N is dimensionless L and H must be expressed in the same units.
Applications
GLC and HPLC are applicable to every applied area of science. It is a routine technique in pharmaceutical, biochemical, food and beverage, agricultural, petroleum, environmental polymer, industrial organic and inorganic and organometallic analysis.
HPLC is identical trace analysis technique. For example, it is useful for the detection of air force (air pollutants) and water pollutants, pesticide residues in plants and food stuff, impurities in all sorts of commercial, pharmaceutical and drugs and their metabolites in body fluids.
Analytical HPLC (Qualitative)
Qualitative analysis in GLC and HPLC is done by comparing retention times or retention volumes of sample components with retention times or retention volumes of reference compounds. Direct comparison of the results obtained with the sample and the results obtained with the standards is generally not possible as these are developed on different days, under different experimental conditions or by a different laboratory.
Therefore, the relative retention, specific retention volume or Kovats retention indices are compared.
The Kovats retention index relates the retention of the sample component to the retention of straight chain saturated hydrocarbons which elute before and after the sample component. The Kovats retention index is defined in one of the following equivalent ways.
 (1)
(1)
 (2)
(2)
 (3)
(3)

Sample size is held constant and the area under the component peak is proportional to the concentration of the component in the sample.
The area under peak can be measured by following any one of the following methods.
- Peak height
- Triangulation
- Counting
- Planimeter
- Cut and weight
- Disc integration
- Electronic integration
19.6 REVIEW QUESTIONS
19.6.1 Fill in the Blanks
- and columns are used in GLC.
[Ans. Packed, open tubular]
- Carrier gas acts as phase in GLC.
[Ans. Mobile]
- In GLC, column packing methods are and
[Ans. Syringe, valve]
- is used to defect and measures the sample as they immerse from column.
[Ans. Detectors]
- and are first family detectors in GLC.
[Ans. Thermal conductivity viva, B-ray Aragon ionisation]
19.6.2 Multiple-choice Questions
- Carrier gas in gas-liquid chromatography
- CO2
- CO

- none of these
[Ans. a]
- The time required for mobile phase to elute the component from stationary phase is called
- Retention volume
- Retention co-efficient
- Both (a) and (b)
- Retention time
[Ans. d]
- High pressure pumps producing pressure in HPLC are
- 600–1,000 psi
- 1,000–1,500 psi
- 200–300 psi
- All of these
[Ans. a]
- analytical technique is used to separate the component by using stationary and mobile phase.
- Spectroscopy
- Chromatography
- Electro analytical technique
- None of these
[Ans. b]
- In paper chromatography, the stationary phase is
- Solid
- Gas
- Liquid
- Both (a) and (b)
[Ans. c]
- Which of the following acts as an absorbent in chromatography?
- Mobile phase
- Stationary phase
- (a) and (b)
- Stationary phase
[Ans. b]
19.6.3 Short Answer Questions
- What is meant by chromatography?
Ans.: It is a valuable analytical tool since it can separate mixture components. It is also useful technique to obtain qualitative and quantitative information about each component.
- Explain the different types of chromatographic techniques.
Ans.: Chromatography is divided into different categories, dependent upon the nature of the stationary and mobile phase.
- Gas liquid
- Gas solid
- Ion exchange
- Ion-pair
- Liquid–liquid
- Paper
- Thin-layer
- Liquid solid
- Size exclusion
- Write a note on gas liquid chromatography.
Ans.: Gas-liquid chromatography was first discovered by Martin and Synge in 1914.
Gas liquid chromatography is a stationary phase; the mobile phase is gas.
It is also called vapour phase chromatography.
- Explain retention time.
Ans.: The time required to sweep the component from stationary phase for mobile phase is called retention time.
- Write a note on retention volume.
Ans.: The volume of mobile phase required to elute the sample component from the stationary phase is called retention volume.
- Write the factors affecting on separation of component in GLC.
Ans.: Factors affecting separation component in GLC are as follows:
- Particle size and surface area
- Carrier gas flow rate
- Type and amount of stationary phase
- Column diameter
- Column temperature
- Write the sample introduction methods in HPLC.
Ans.: A sample can be introduced by the following methods:
- Syringe septum method
- Stop-flow injection
- Sample valve injection
- Explain the types of detectors used in HPLC.
Ans.: The types of detectors used in HPLC are as follows:
- Refractive index
- Dielectric constant
- Electrical conductivity
- Thermal conductivity
- UV and visible
- Fluorescence
- Radio activity
- Electron capture
19.6.4 Descriptive Questions
Q.1 Explain the instrumentation of gas-liquid chromatography.
Q.2 Write short notes+ on the following:
- Partition coefficient
- Retention time
- Retention volume
- Plate theory
Q.3 Write a note on HPLC and the instrumentation of HPLC.
Q.4 Describe the theories of HPLC and its application.