CHAPTER 13
Securing Future Trajectory: From Balance Sheet to Market Value
Louis Vuitton, the world's top luxury goods company, reported €64.2 billion of revenue in 2021. This figure was up 44% from 2020 and 20% from 2019.1 Also in 2021, Louis Vuitton was named the most valuable luxury company in Interbrand's Top Global Brands study. It was ranked 13th overall in the study and was the only fashion company to make the top 20 in the list.2
Bernard Arnault, chairman and CEO of Louis Vuitton, explained the reasons behind the outstanding performance of the brand in 2021 during the gradual recovery from the pandemic. He credited the results to a highly efficient team. He also noted exceptional adaptability amid a difficult business environment.
These financial and nonfinancial accomplishments emerged from the company's commitment to placing customers in the center of all operations. Amid a prolonged crisis, Louis Vuitton maintained a relationship with its customers, and the brand continues to inspire.3
From the Louis Vuitton case, we can learn how a considerable concern for financial results must accompany market orientation and the application of customer‐centricity by the marketing team. When that happens, nonfinancial outcomes lead to financial performance. High awareness of our product or brand is a first step. However, it is not enough before customers are interested in our product or brand.
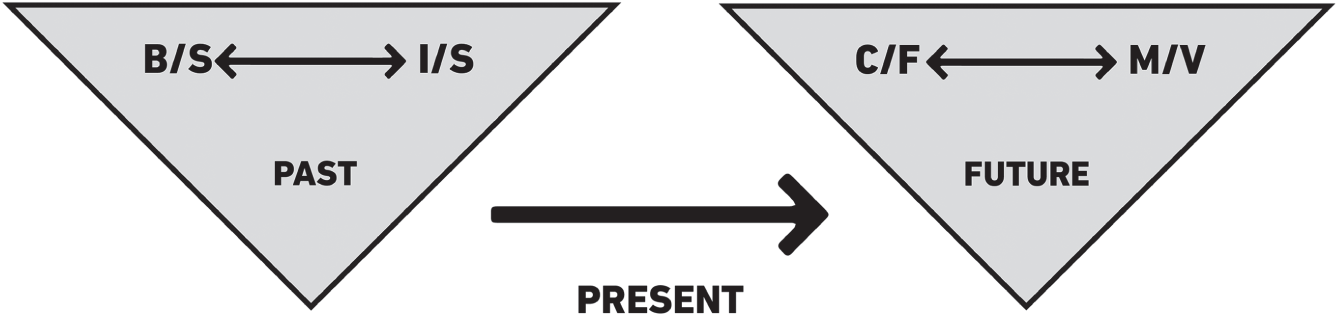
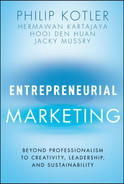
FIGURE 13.1 The financial components of the omnihouse model
In this chapter, we'll study the very bottom of the omnihouse model, which will briefly discuss the financial aspect for marketers (see Figure 13.1). We will also discuss the relationship between balance sheets (B/S), income statements (I/S, also called profit‐and‐loss statements), cash flow (C/F), and market value (M/V). All these terms are essential for marketers, especially when applying an entrepreneurial marketing approach.
Cash Is Still King
In general, a company's revenue comes from the sale of products―goods, services, and supporting services―which are part of the company's core business. Other sources such as investments and bank interest can also contribute. Sales transactions are usually in cash or noncash. Noncash sales will increase account receivables, and we must convert this into cash as soon as possible. A company's assets cannot produce anything if we are unable to leverage them.
One of the crucial measures to maintain cash inflow is to convert the noncash payments into cash immediately. However, if the business environment is not conducive, the condition may disrupt cash flow. A break is troubling because cash is the lifeblood for a company's operational continuity and is often needed for financing and investing activities. Given this, companies of all sizes should prioritize having an ongoing cash flow.
After the company converts revenue into cash, it will increase the cash amount on the balance sheet. This cash will be used to make payments or cover activities such as R&D, the supply or procurement of raw materials, production processes, and marketing and sales processes. It will support customer services and pay for retention (loyalty) programs. Cash will cover operating expenses such as overhead and salaries. In addition, the company needs cash for investing and financing activities.
Some companies are cash rich. In 2022, 13 companies held nearly 40% (about US$1 trillion) of the total US$2.7 trillion held by all companies in the S&P 500. In early 2022, Apple, one of the most extreme examples, had US$202.5 billion in cash and investments, up nearly 4% from the year before. That equates to 7.4% of all the cash held by S&P 500 companies. Alphabet had US$169.2 billion in cash and investments, equivalent to 6% of all S&P 500 cash. Microsoft held US$132.3 billion, the same as 5% of all cash in the S&P 500.4

FIGURE 13.2 The formula of assets
Revenue minus the expenses is equal to the net profit. At the end of the financial year, the company produces an income statement. In the case of a net profit, the board of directors will propose how much to distribute as dividends and how much to allocate for retained earnings. This is usually presented at the general meeting of shareholders. Once it is approved, dividends and retained earnings are allocated.
Any retained earnings will increase equity and improve the company's ability to add new debts or funding from investors if necessary to expand its business. We will later record these borrowings as liabilities, and funding from investors will be part of the equity in our company's balance sheet. With increasing equity and liabilities, assets will also increase, so companies must up their sales and ultimately their net income. This simple explanation summarizes the formula that equity plus liabilities equal assets (see Figure 13.2).
Thus, we can see a relationship between the income statement and the company's balance sheet. Shareholders are typically more concerned with net income at the bottom of the company's income statement. This is because the figure is used to determine the dividends to distribute.
Past, Present, and Future
Under certain conditions, if a company's bottom line is negative, it can still finance activities from investors rather than borrowed money (debts). From the investors' perspective, the balance sheet and income statement are reflections of the past. Hence, it is more important for investors to see what the company currently owns, what its managers will do now, and its future business prospects.
Potential investors will carefully look at the as‐is condition of the company and its ability to generate cash. They will examine the extent to which the company's value‐creation process can guarantee a sufficient return for them, increasing the market value as reflected in the P/E ratio and P/B ratio (as discussed in Chapter 10). Investors will evaluate how the company strives to remain superior and relevant in the industry. They will also consider the company's internal conditions, including tangible and intangible resources, capabilities to manage multiple resources, an establishment of its core competence, and possibly distinctive competences. In short, investors want to know how a company can handle external factors such as dynamics of the macro environment, market, competition, and changes in behavior or customer preferences.
The company's ability to generate cash is an essential measure of the value‐creation processes. Investors see the cash flow statement as an indicator of profitability and long‐term prospects. It can assist in determining whether the company has sufficient cash to cover its expenses. A cash flow statement, in other words, represents a company's financial health.5
A start‐up, if able to show a promise of disrupting an industry, can often attract investors to fund its business development. Even if the income statement shows a loss position for several years, investors may believe the start‐up has the potential to become a market leader over time. They might be convinced its market value will increase significantly and give them an outstanding future return.
The Balance Sheet and Income Statement Loop
The value of dividends paid divided by the net income is called the payout ratio. The higher it is, the stronger the company balance sheet is (see Figure 13.3). According to Demmert, the payout ratio of attractive companies is usually 35–55%.6 However, the amount of dividends also depends on the company's condition. If the company is in a mature and stable stage, it will usually have a high payout ratio. Aggressively expanding companies tend to withhold profits (as retained earnings) to be reinvested in the company.7
Retained earnings will increase shareholder equity. More equity can strengthen the company's leverage ability to obtain loans, which will increase the amount of debt. Consequently, assets will also rise, and therefore the company will need to increase its sales. We must continue to maintain this cycle on an ongoing basis to ensure business growth over time.

FIGURE 13.3 The balance sheet and income statement loop8
If the cycle is divided by two, the picture on the top right of Figure 13.3 shows the balance sheet, and the bottom left shows the income statement. We can now clearly see the relationship between the balance sheet and the income statement from this cycle. This also explains why we depict a two‐way arrow between balance sheet and income statement in the omnihouse model.
Financial Ratios: The Counterclockwise Approach
The explanation starts with equity and liabilities and ends with net income, cycling clockwise. To make it easier for marketers, we can use this loop to understand the concept of return. We will work backward to see the financial ratios that show a company's profitability. We will start with operating income and work counterclockwise to calculate return on sales (ROS) and net profit margin.
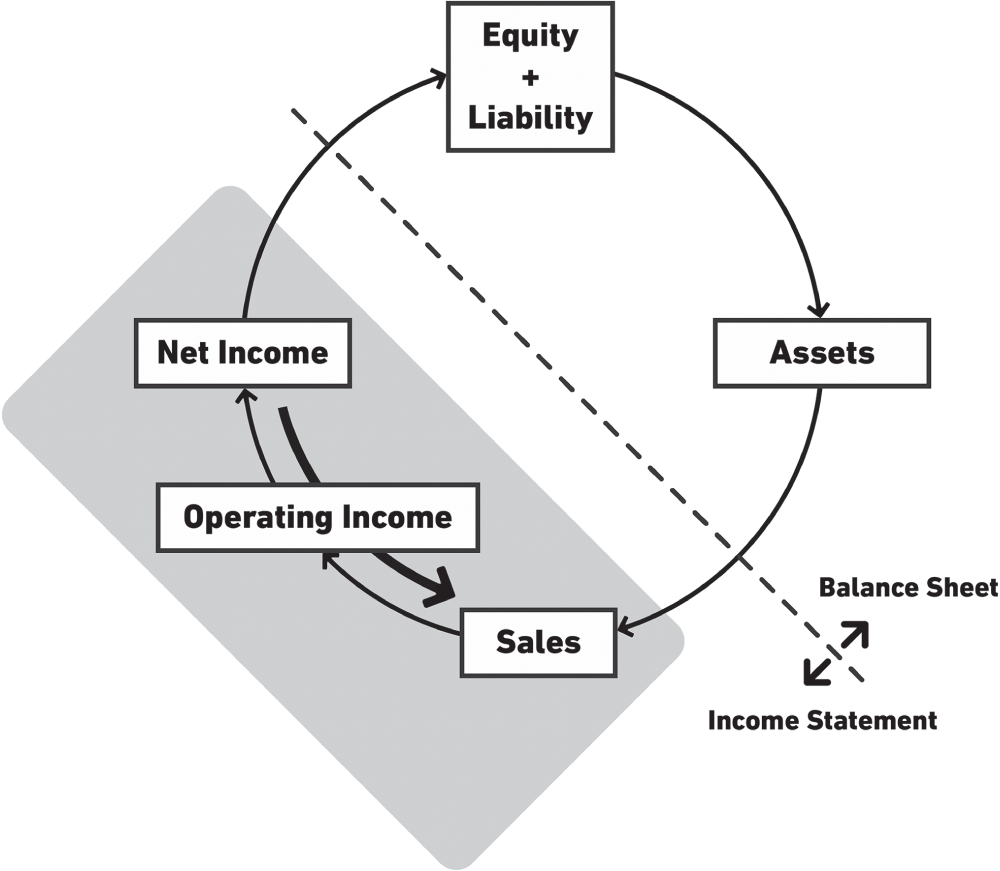
FIGURE 13.4 Components to calculate return on sales and net profit margin
The Overlooked ROS and Net Profit Margin
If we put operating income over sales (that is, operating income divided by sales), it will produce a financial ratio called ROS.9
ROS reflects profitability, that is, how much operating income is generated from a sales result (see Figure 13.4). If the ratio is a relatively small number, it indicates the company's operations are not running efficiently. This means there are unnecessary costs incurred.
We must look further to see if these costs are due to marketing and sales operations or not. Sales results may reach or surpass the target, but if this is achieved by “selling‐at‐any‐cost” efforts, there could be an underlying problem. For example, if we offer someone to buy one product and get three for free, it could sell well. A price discount that causes a 1% decrease in sales will reduce the net profit by up to 12% because we cannot automatically reduce all costs according to the discount rate. It is nearly impossible to ask everyone in our value chain to lower their bills when the company runs a customer discount program.
TABLE 13.1 The Impact of Discount on Unit Sales Increase to Maintain Same Gross Margin10
| Price Decrease | −5% | −10% | −15% | −20% |
|---|---|---|---|---|
| Gross Margin | ||||
| 30% | +20% | +50% | +100% | +200% |
| 35% | +17% | +40% | +75% | +133% |
| 40% | +14% | +33% | +60% | +100% |
| 45% | +13% | +29% | +50% | +80% |
| 50% | +11% | +25% | +43% | +67% |
If we decide to give a price discount, we have to sell more units of our product to maintain the same gross profit. With a gross margin of 40% and a sale discount of 20%, we need to sell 100% more product units than usual for the same profit margin. The larger the gross margin we want to achieve and the higher the price discount given, the higher the unit sales increase we have to deal with, as explained by GrowthForce in Table 13.1.
According to McKinsey's research on the average income statement of S&P 1500 companies, we can see that price has a tremendous impact on operating income. A 1% increase in prices will result in an increase of about 8% in operating income. This is almost 50% greater than the 1% reduction in variable costs and three times greater than the 1% increase in sales volume.11
Waste can arise quickly in other areas. Goods shipped to the wrong address can be costly when they are redirected. Large inventories that don't sell accrue maintenance expenses. If they are financed with debt, the interest will incur further charges. Printed brochures, if not read, drain the budget, as do sales tools that aren't used appropriately. Digital advertising can also produce waste. According to Marketing Week, more than 90% of digital ads are viewed for no more than a second.12

FIGURE 13.5 Various types of risks that affect profitability13
In the income statement, there can be hidden costs that reduce profitability. This includes waste related to marketing and sales. If costs are high, it can affect the operating income, which is listed between sales and net income. If the operating income improves, the net income will improve.
To gauge performance, we can calculate what is generated from sales. By dividing net income by sales, we will get a net profit margin ratio. This is an essential indicator of the company's financial health.14

In addition to internal factors, sales are dependent on external forces, as discussed in the 4C concept. These external factors pose multiple risks to companies, known as economic risks. Combining these economic risks with operational risks results in a term known as business risks (see Figure 13.5).
There are other risks (nonoperational risks) that will affect the value of nonoperating gains and losses. These come from foreign exchanges, investment losses and gains, and inventory write‐offs. They can also include damages to assets and unexpected costs.15
The Forgotten Asset Turnover
Continuing around the circle, we come to the sales and assets components (see Figure 13.6).
Dividing sales by assets produces a ratio known as asset turnover. This can be used to measure how effectively company assets are being used to generate sales.
Here, marketers must calculate the actual value of the assets they use to achieve a specific sales result. If the assets directly related to marketing are large and the sales are small, it could be assumed that the assets are not effective. This could be due to assets that aren't suitable or an error in the strategy and execution by the sales team.
In marketing, assets tend to be intangible, such as brands, logos, customer databases, positive public perceptions or associations for brands, customer loyalty, social media and website content, infographics, brand guidelines, and service blueprints. However, there are also tangible assets to consider. These include physical marketing and sales infrastructure, training facilities, equipment and supplies, warehousing, and inventory.16

FIGURE 13.6 Components to calculate asset turnover
In addition to leveraging intangible assets, we must pay attention to our productivity level in using these tangible assets to create sales. If salespeople promise to achieve sales higher than their targets, first check how many assets or resources they will use to achieve the level of sales they have pledged. Suppose they aim to sell a certain number of units of a specific product per month at a rate above the industry average. Check the value of fixed assets (e.g., vehicles, production machines, land, buildings, and many others) directly related to marketing and sales. What if there is a competitor with the exact product, but the business model is different in such a way that the fixed assets turn out to be very small? How can we compete?
The two‐sided marketplace is one of the most basic online business concepts that requires few tangible assets. The business model connects a group of buyers and sellers via a technical intermediary, such as a website or mobile app, and charges a fee for each transaction. eBay was the first significant two‐sided marketplace success. The model is now more popular than ever, thanks to start‐ups like Airbnb and Uber. Each company in this space has improved the experience and economics of the “old school” system it has replaced: eBay, by allowing people to buy and sell almost anything to almost anyone; Airbnb, by enabling rooms to be booked by people all over the world; and Uber, by allowing taxi passengers and drivers to find each other without relying on luck on the street.17
The Neglected Return on Assets
From these three ratios (ROS, net profit margin, and asset turnover) we can measure efficiency. To look at effectiveness, we must consider the relationship between sales in the income statement and assets in the balance sheet. To measure productivity, we can use net income and assets (see Figure 13.7).
Let's align the net income margin (that is, net income divided by sales) with the asset turnover ratio (sales divided by assets) and multiply it. We cross out the elements of sales in the net income margin and asset turnover so that the result is net income divided by the assets. We call this return on assets (ROA).


FIGURE 13.7 Return on assets as a measure of productivity
What makes a strong ROA? Usually, the higher the ROA, the more profit‐generating efficiency the company has. However, we must compare the ROA of any given company to its competitors in the same industry and sector. An asset‐heavy company, such as a manufacturing firm, might have an ROA of 6%. An asset‐light company, such as a telemedicine app, might have an ROA of 15%.
If we compared the two based on return on investment, we would probably choose the app. However, if we compare the manufacturing firm to its nearest competitors, all of whom have ROAs below 4%, we may discover it is outperforming its peers. By contrast, if we compare the telemedicine app to similar tech firms, we could find that most of them have ROAs closer to 20%. This would indicate that the company is underperforming compared to similar firms.18
The Incomprehensible Equity Multiplier Ratio
Let's continue our counterclockwise journey in the loop by looking at assets and equity (see Figure 13.8).

FIGURE 13.8 Components to calculate equity multiplier ratio
Putting assets above equity (assets divided by equity) results in the equity multiplier ratio, which indicates the share of assets financed by equity as opposed to debt. This ratio shows the “leverage,” meaning the company's ability to obtain funding from other parties.

If we have a large number ratio, the company's assets are financed mainly by debt. This could indicate higher financial risks. The asset element can include tangible and intangible assets related to sales and marketing.19
Maersk Line, a logistics company, is one of the main arteries of the world's supply chain and plays a crucial role in supporting global trade. Its intangible assets include a competent workforce that can deliver a high level of service.20 Its tangible assets consist of resources such as its fleet of ships.
The Unthinkable Return on Equity
The return on equity (ROE) is the last ratio in our journey around the circle that connects the income statement to the balance sheet (see Figure 13.9).
This ratio is one of the most crucial productivity indicators, especially for shareholders and potential investors. The calculation relates to the ratios discussed (ROS, net profit margin, asset turnover, and equity multiplier). The formula includes a sales element.
If the net profit margin ratio multiplied by the asset turnover ratio (after crossing out the two sales elements and producing the ROA ratio) is then aligned and multiplied by the equity multiplier ratio and crossed out by the two asset elements, the result is the ROE ratio (see Figure 13.10).
Income statements are used for more than just the top‐line indicator of sales. They display details of expenses, including those related to marketing and sales. Top management pays close attention to marketing expenses, especially when creating the corporate income statement and aligning salespeople's remuneration with revenue levels. These are costs incurred by a firm to offer its goods and services. Marketing expenses are included in a company's operational expenses, and accountants report them separately in the “selling, general, and administration expenses” portion of the income statement.21

FIGURE 13.9 The components of return on equity

FIGURE 13.10 How to calculate return on equity
Companies can use financial statements, particularly income statements, to improve their day‐to‐day marketing operations and discover the types of products that could create future growth potential. Managers can use them to plan budgets, measure efficiency, analyze product performance, and build short‐ and long‐term objectives.22 Best practices for marketers include understanding the balance sheet and linking it to the income statement, knowing what the ratios mean, and using them to make marketing and sales decisions.
Understanding Cash Flow and Market Value
As previously stated, cash is an essential element for the company. Without cash flow, the company cannot finance its operational activities or carry out investing and financing. Investors will decide whether to invest in a company after using valuation methods, both qualitatively and quantitatively. In general, potential investors will conduct a company analysis by looking at external and internal elements of the company, similar to the 4C analysis, before moving on to look at the financial aspects (see Figure 13.11).
Investors use steps to value a company that can be helpful for marketers to understand. The following sections provide some general guidelines for the valuation process.
Step 1: Industry Potential and Economic Risks Analysis
Investors consider the macroeconomic factors. These include technology, political/legal including regulations, economy, and social/cultural. They will also observe microeconomic indicators such as future market conditions, industry growth, competition between players, customer behavior, and potential developments.

FIGURE 13.11 General stages of corporate valuation
For instance, in the banking industry, macro trends like the emergence of blockchain technology, new regulations, economic contraction, and lifestyle changes will create opportunities and threats for companies. At the micro level, there is the increasingly cashless lifestyle of customers and the shift to digital banking. The initial identification of these shifts will become input for determining the company's strategic intent. From the investors' point of view, they will see how the company can respond to these dynamics.
Step 2: In‐Depth Company Analysis
Potential investors will learn more about a company's condition by reviewing its business model. They will see whether it is consistent with its core competency (even distinctive competence) and can guarantee an ongoing revenue stream long term. In other words, companies must have a competitive advantage built on sufficient resources supported by capabilities and managed under corporate governance. Investors will see whether the company has a clear strategy that is consistent in its application to the operational level. They will look at short‐term and long‐term operational risks.
Investors will also evaluate the extent to which technology plays a role in shaping their competitive advantage, how strong the company's digital orientation is, how well integrated their marketing and sales teams are, and how strong their market orientation and level of customer‐centricity are. They will be interested in the implementation of talent management and the culture in the company. They will also consider creativity and innovation capabilities.
Step 3: Historical Financial Performance Evaluation
Investors will study the company's financial statements to understand its performance in recent years:
- Achievable operating margin
- Products and services that make a significant profit contribution
- Net income, dividends, and retained earnings
- Profitability ratios or returns generated
- Equity and liabilities
- Tangible and intangible assets
- Cash flow, including the allocation of cash in operating, investing, and financing activities
- The company's current market value (P/E ratio and P/B ratio)
Investors will pay close attention to operating cash flow to see if it is allocated in investments that create value. They will view a company's journey. They will want to see if it is newly formed or a start‐up. The company could be growing with aggressive expansion or it may have reached its sunset years. Investors will compare company performance indicators with similar companies or its closest competitors and industry averages.
Step 4: Financial Projection Development
Because cash is king for investors, it is necessary to make a realistic operating cash flow projection for the next few years. This projection must be based on a robust business model that can show the company's ability to compete in a dynamic business environment. The business model must clearly show the company's revenue stream, which is then projected for the next few years. Investors study the operating cash flow (which has been deducted from all operational expenses) and capital expenditures (which are part of the company's investing activity) that will happen in the next few years.
We can obtain a free cash flow projection from the projected operating cash inflow that has been deducted from operating expenses and capital expenditures (CAPEX). This free cash flow is then discounted, which is known as the discounted cash flow (DCF). Investors use this indicator to determine the company's current market value based on the fair market price and estimate the potential for increasing market value in the future.
Step 5: Investment Decision‐Making
Investors will decide whether the calculation of the DCF minus their total initial investment shows a significant positive difference. The initial investment amount will also determine how much of the company's ownership belongs to investors. If there is a positive net income at the end of the financial year, and it is decided it will be distributed in the form of a dividend (partially or in whole), then each investor will get a share of the dividend according to the portion of the shares they hold. Investors will see whether the P/E ratio is satisfactory. In addition, if the market value increases significantly from time to time and the value is above the book value (meaning the P/B ratio is favorable), then investors can sell it to obtain a capital gain. For this reason, investors will look at the current market and book value of the company, the predicted market value, and the actual market value.
Anticipating Investors
Understanding the steps taken during the valuation process can help an organization prepare for investors. This could occur when a company aims to raise money. In other instances, obtaining investors might be part of a strategy to help the company gain value for future purposes. Among family businesses, there could be a desire to become “fit for sale,” even if the objective is not to sell the company.23 The process could help a family firm appear more professional in its industry. Table 13.2 lays out guidelines to keep in mind before undergoing a valuation.
TABLE 13.2 Summary: Preparation to Anticipate Investors
| Company's Preparation Checklist | |
|---|---|
| STEP 1 Industry potential and economic risks analysis |
|
| STEP 2 In‐depth company analysis |
|
| STEP 3 Historical financial performance evaluation |
|
| STEP 4 Financial projection development |
|
| STEP 5 Investment decision‐making |
|
Cash Flow and Market Value Loop
There is a reciprocal relationship between cash flow and market value that we can illustrate in a virtuous upward cycle of cash flow and market value. However, it could be used to describe the opposite effect (i.e., a vicious cycle) if a company's external and internal conditions are not as good as expected. We can divide the cycle that links cash flow and market value into three domains: monetization, cash flow, and market value (see Figure 13.12).
Within the monetization domain, improvements and innovations can significantly aid the multiple value‐creation processes and ultimately increase sales achievement. After that, we enter the cash flow domain. In this phase, sales deducted by operating expenses (including depreciation and amortization) will generate operating income. After combining it with nonoperating gains or losses and deducting interest and taxes, it will produce net income. This will then be distributed in the form of dividends and retained earnings.
Next, we turn to the market value domain, where increasing dividends will improve the P/E ratio. This elevates share prices so that the P/B ratio will further grow. Then we go back into the cash flow domain, where companies with better market value will be more attractive to investors for investment. If that happens, the company's cash inflow will increase due to the financing activity. The company will allocate a portion of this cash to investing activities, namely CAPEX, and investments involving intangible assets such as brands, processes, and people. This investment is expected to increase the company's ability to make improvements and innovations. Then the cycle continues.
FIGURE 13.12 Simple illustration of cash flow and market value virtuous cycle
Grasping this loop enables marketers with an entrepreneurial perspective to see the significant role that marketing and sales plays in the monetization, cash flow, and market value domains. It also shows how marketing and sales are an integral aspect of securing the company's long‐term trajectory.
It's worth noting that the balance sheet does not accommodate intangible assets other than patents, copyrights, franchises, licenses, and goodwill. Suppose there is substantial brand equity that would generate a high selling price. If the company has not been acquired, it is not possible to record the brand's value as a company asset on the balance sheet. The value of this valuable intangible asset can result in a significant difference between the company's book value and the company's market value. The more valuable an intangible asset, the higher the company's market price compared to its book value.
Companies must also carefully identify and acquire other intangible assets―apart from brands, copyrights, franchises, patents, and other intangible assets―such as innovation capabilities, a strong corporate network, unique corporate culture, solid managerial capabilities, and a customer database. The variance between book value and market value, which is an indicator of the value of an intangible asset, can be recorded as goodwill later only if another party has purchased the company. Furthermore, the value of intangible assets has to be periodically amortized even if the market sees that the company's intangible assets are increasing in value.
Relating these discussions to strategic management, neither tangible nor intangible assets will provide benefits if they cannot be used and converted into relevant capabilities that are the basis for creating competencies. One of the capabilities is sales, which applies existing assets to obtain a result for a specific target. The value‐creation process can occur when the company uses its assets efficiently and effectively (in other words, productively), which forms competence. If a company can maintain this condition consistently, it will create a sustainable competitive advantage.
Along with marketers increasing their awareness of financial terms, those in finance and accounting will do well to be aware of the increasing significance of intangible assets. These are becoming dominant factors in the value‐creation process and ultimately determine the company's competitive advantage. This phenomenon can be seen in the presence of companies born in the digital era with business models that are entirely different from traditional versions. In some cases, the digital start‐ups' performances have been stronger. This presents an opportunity for companies using traditional models to reexamine them. It could be an opportune time to learn new approaches to increase their value.
Key Takeaways
- Cash is the lifeblood of an organization, and is used to cover operating expenses, investments, and financial activities.
- When marketers understand key financial terms, they can communicate on a strategic level with other executives and better assess how to budget, fund, and measure projects. Financial savvy marketers will have a positive impact on a companyʼs productivity.
- To value a company, investors will carry out analyses to determine industry‐related and economic risks, look in‐depth at the company, review historical performance, create financial projections, and make a decision.
- Having an awareness of what investors prioritize can help a company prepare for a valuation.
Notes
- 1 https://www.lvmh.com/news-documents/press-releases/new-records-for-lvmh-in-2021/
- 2 https://fashionunited.uk/news/fashion/louis-vuitton-ranks-as-most-valuable-luxury-company-in-interbrand-s-2021-top-global-brands/2021110258951
- 3 https://www.lvmh.com/news-documents/press-releases/new-records-for-lvmh-in-2021/
- 4 https://www.investors.com/etfs-and-funds/sectors/sp500-companies-stockpile-1-trillion-cash-investors-want-it/
- 5 https://www.kotaksecurities.com/ksweb/articles/why-is-the-cash-flow-statement-important-to-shareholders-and-investors
- 6 James Demmert is the founder and managing partner at Main Street Research in Sausalito. Please refer to https://money.usnews.com/investing/dividends/articles/what-is-a-good-dividend-payout-ratio
- 7 https://www.investopedia.com/articles/03/011703.asp
- 8 Adapted from Gabriel Hawawini and Claude Viallet, Finance for Executives: Managing for Value Creation (Mason, OH: South‐Western College Publishing, 1999).
- 9 Operating income (or also referred to as operating profit) is sales (or as a whole with various other income called revenue) minus all operating expenses that consist of cost of goods sold (COGS); selling, general, and administrative expenses (SGA); and depreciation and amortization.
- 10 https://www.growthforce.com/blog/how-giving-discounts-can-destroy-your-business-profits
- 11 https://www.mckinsey.com/business-functions/marketing-and-sales/our-insights/the-power-of-pricing
- 12 https://www.marketingweek.com/marketers-continue-to-waste-money-as-only-9-of-digital-ads-are-viewed-for-more-than-a-second/?nocache=true&adfesuccess=1
- 13 Adapted from Gabriel Hawawini and Claude Viallet, Finance for Executives: Managing for Value Creation (Mason, OH: South‐Western College Publishing, 1999).
- 14 Chris B. Murphy, “What Is Net Profit Margin? Formula for Calculation and Examples,” Investopedia (October 2021). https://www.investopedia.com/terms/n/net_margin.asp
- 15 https://www.theactuary.com/features/2020/07/08/joining-dots-between-operational-and-non-operational-risk; https://corporatefinanceinstitute.com/resources/knowledge/accounting/non-operating-income/; https://www.accountingtools.com/articles/non-operating-income-definition-and-usage.html#:~:text=Examples%20of%20non%2Doperating%20income%20include%20dividend%20income%2C%20asset%20impairment,losses%20on%20foreign%20exchange%20transactions.
- 16 https://valcort.com/assets-marketing-assets/
- 17 https://www.cbinsights.com/research/report/how-uber-makes-money/
- 18 https://www.forbes.com/advisor/investing/roa-return-on-assets/
- 19 Some of the intangible assets that can usually be listed on the balance sheet are patents, copyrights, franchises, licenses, and goodwill. Please refer to Hawawini and Viallet (1999).
- 20 https://investor.maersk.com/static-files/b4df47ef-3977–412b-8e3c-bc2f02bb4a5f
- 21 https://bizfluent.com/info-8221377-types-income-statements-marketing-expenses.html
- 22 https://www.investopedia.com/ask/answers/041515/how-does-financial-accounting-help-decision-making.asp
- 23 https://www.pwc.com/sg/en/publications/assets/epc-transform-family-businesses-201805.pdf