
CHAPTER 14
Uniting Marketing and Finance: From Separation to Integration
In 2013, Raja Rajamannar, chief marketing officer of Mastercard, wanted to elevate the marketing division and give it a more strategic role. At that time, Mastercard was already a well‐known brand. Rajamannar saw that marketing efforts had been successful in raising brand awareness. However, they hadn't led to increased revenue.
Rajamannar also observed that the CFO did not work directly with the CMO, even though marketing expenses were among the top three expenses listed in the income statement. To change course, Rajamannar asked the CFO to work with him and integrate the departments.
For this integration to work, Rajamannar added a finance team member into his marketing team. He asked the newly formed group to use a formula to measure ROI for marketing activities. The goal was to set up a common knowledge to measure marketing's impact on the broader business goals.
As a B2B2C brand, Mastercard's strategic plans included engaging directly with the end customer. The company wanted the individual cardholder to recognize the brand. To achieve this, Rajamannar carried out experiential marketing executed by Mastercard in regional offices. He wanted every region to find the right way to communicate directly with the individual customers. He then asked the regional offices to measure the impact of the campaign using the ROI measurement. As a result, Mastercard's brand value rose from US$69 billion in 2013 to US$112 billion in 2021.1

FIGURE 14.1 Marketing and finance elements in the omnihouse model
The Mastercard example shows that an integrated relationship between marketing and finance can significantly affect competitiveness and sustainability. In reality, there is often a lack of harmony between the two departments. For this reason, we listed it as a blind spot previously in this book.
In this chapter, we'll look at overcoming established barriers to unite marketing and finance. We'll explore the mutual benefits that can come from integrated departments. We'll also study how the two can be brought together through a step‐by‐step process (see Figure 14.1).
Historically Important but Separate Pillars
Despite being in one management ecosystem, traditionally the marketing and finance departments often are unconnected. The common practice among marketing leaders is to make decisions regarding budgets primarily based on current business strategy. Marketing leaders are less likely to determine their budget calculation based on the measurements of financial returns. This practice can potentially bring misunderstanding to both marketing and finance teams because apparently, although they both have the same goal―supporting the company's business strategy―they think differently.2
Usually, the finance team will measure the cost and return of marketing activity. However, according to marketing leaders, numeric formulas to measure marketing campaigns might not always be the right approach. Most of the marketing strategy aims for long‐term impact. In the short term, marketing activities can bring a quantitative return. However, for long‐term impact, marketing activities get more qualitative results, such as the brand image.3
Uniting the two provides an opportunity for better performance. Sarah Allred and Timothy Murphy, in an article published by Deloitte, revealed that a partnership between marketing and finance is needed for growth. Their research showed that executives at the highest growing companies are strongly aligned on measuring marketing's impact.
This alignment provides an essential basis for harnessing the strengths of CMOs and CFOs. Deloitte's research also found that trends are changing: there are indications that some CMOs and CFOs are finding ways to collaborate more effectively. A close and harmonious relationship between the CMO and CFO can significantly help business performance.4
Marketing and finance divisions can and should create value for each other. Finance gives a budget to fuel marketing activities, and marketing activities can bring valuable revenue or brand value. Both the marketing and finance divisions need a common language and agreeable way to report to each other. As two very decisive departments, both should work together in line with their company's mission to achieve its vision.5
Efficiency, Effectiveness, and Productivity Revisited
In Chapter 13, we discussed efficiency, effectiveness, and productivity using a balance sheet and income statement loop (see Figure 14.2). In general, if marketers want to know the efficiency level, they can review the income statement and calculate the return on sales (ROS) and net profit margin ratios. All of these reflect profitability.
Generally speaking, a “no‐margin‐for‐error” approach does matter to avoid losses due to inefficiency. By understanding the income statement up to operating income, we realize we must avoid any potential inefficiencies. These include unnecessary costs related to non‐value‐creating activities and errors that could be prevented.
As seen in Chapter 13, marketers can calculate the asset turnover ratio to see how effectively they are running as a team and business. If the company's assets are growing but there is not an adequate increase in sales, it could be due to using the incorrect assets. Or vice versa. Perhaps the company has the right assets, but the problem lies in sales efforts. There could also be other fundamental mistakes, such as targeting the wrong segments, inappropriate positioning, commoditization of value propositions (as manifested in products and prices), weak marketing communications, or a misaligned sales strategy.

FIGURE 14.2 Productivity matrix
Combining efficiency and effectiveness leads to a measure of productivity, as reflected in the return on assets (ROA) ratio. If there is an issue with productivity, the source can be investigated. Low productivity could be caused by the following:
- Marketing and sales operations are inefficient even when they have the suitable assets.
- Marketing and sales operations are efficient, but they don't have the right assets.
- There is inefficient marketing and sales operations as well as ineffective assets.
Standard Financial Statements Are Not Enough
A handful of marketing metrics are relevant to financial calculations. These include marketing ROI, cost per action (CPA), customer acquisition cost (CAC), customer lifetime value (CLV), and revenue attribution. Although critical, not all marketers or companies use these key performance indicators (KPIs). Let's review each:
- ROI. In a marketing perspective, this is a way to calculate the effectiveness of any marketing activity. ROI is calculated by subtracting marketing cost and sales growth and dividing it by the marketing cost. The result is a percentage of ROI. For example, if the ROI of any marketing activity is 20%, it means the investment of the marketing activity creates 20% of the profit.6
- CPA. As the total cost of the campaign divided by the number of converted customers, the figure describes how much money we have to spend to get one new customer coming from a marketing campaign activity. The lower the CPA, the more efficient a marketing campaign is.7
- CAC. This refers to how much it costs to persuade one customer to purchase a product or service. It is found by taking the sales and marketing expenses and dividing them by the number of new customers.
- CLV. The formula calculates the total income a company can expect to receive from a typical customer as long as that individual purchases from the company. It is a measure of customer value and loyalty throughout the relationship.
- Revenue attribution. This term involves matching customer sales to a specific advertisement to see where the revenue is coming from. It is often used when deciding how to calculate future advertising budgets.
Some of these metrics are vital for measuring marketing performance. However, they are not usually included in standard mandatory financial statements. The financial statements are not typically marketing specific.
There are also marketing‐specific nonfinancial metrics to evaluate marketing performance. These provide insight into strategic and tactical decision‐making processes. Many of the common ones are listed in Table 14.1.
TABLE 14.1 Marketing‐Specific Nonfinancial Metrics
| General Marketing Metrics | Digital Marketing Metrics | ||||
|---|---|---|---|---|---|
|
|
|
|
|
|
These metrics are not always shared with non‐marketing divisions because they are often viewed as insignificant. Sometimes, the performance looks optimal based on these metrics. Unfortunately, with no or few financial results, they are deemed irrelevant. The difficulty in converting those nonfinancial results into financial results often raises skepticism from other departments, especially finance. Metrics that look solid but do not have meaning attached to them are often referred to as vanity metrics.
Marketing‐specific financial metrics are essential and should be presented in meetings, especially with the C‐suite. Despite their usefulness, many of the financial metrics in Table 14.2 are not used. If they do exist within a company, they are usually not part of the standard mandatory financial statement (with the exception of common ones such as sales and costs of goods sold).
TABLE 14.2 Marketing‐Specific Financial‐Related Metrics
| General Marketing Metrics | Digital Marketing Metrics | |
|---|---|---|
| Marketing‐Based | Standard Finance‐Based | |
|
|
|
It is ideal for entrepreneurial marketing organizations to combine finance and marketing teams and set agreeable metrics to interpret marketing activities financially. Without a good analysis and interpretation of these metrics, marketing decisions perhaps will be based on best guess, estimates, or assumptions. If we refer only to the standard mandatory financial statements, which are not marketing‐specific, our marketing decisions will be misleading and ineffective.
Using marketing‐specific financial and nonfinancial metrics that have been approved by finance counterparts, marketers can increase accuracy in measuring the efficiency, effectiveness, and productivity of their efforts. Teams should measure their marketing activities in all stages, from creating awareness to maintaining customer loyalty. It is important to select the appropriate marketing‐specific metrics based on the specific marketing objective.
Stages of Unification
There are five stages that can be used to indicate the relationship between marketing and finance. They range from two separate groups to full integration (see Figure 14.3). We'll look at each stage next.
Stage 0: Entirely Separated
Marketing and finance departments function and develop independently. The two share almost no meaningful information. Communication, even at an informal level, rarely occurs. The two only connect for urgent matters, problems, or issues.
Each person in the two departments focuses on their respective goals based on the KPIs of their department. They have separate routines and agendas and are not interested in collaborating to solve problems. The two departments have yet to show signs of coexistence.
In this stage, occasionally marketing and finance clash, primarily over budget allocation. Their relationship is full of “tug‐of‐war”. Marketers see that the finance team deliberately makes it difficult to disburse budgets. The finance team observes that the marketing group wastes money on ambiguous purposes without clear direction.
Stage 1: Basic Communication
In this phase, the relationship between the marketing and finance departments is still separated but has opened meaningful and essential communication lines. Information interaction has also begun. The information shared is not usually regarded as valuable. Each department functions strategically on its own.
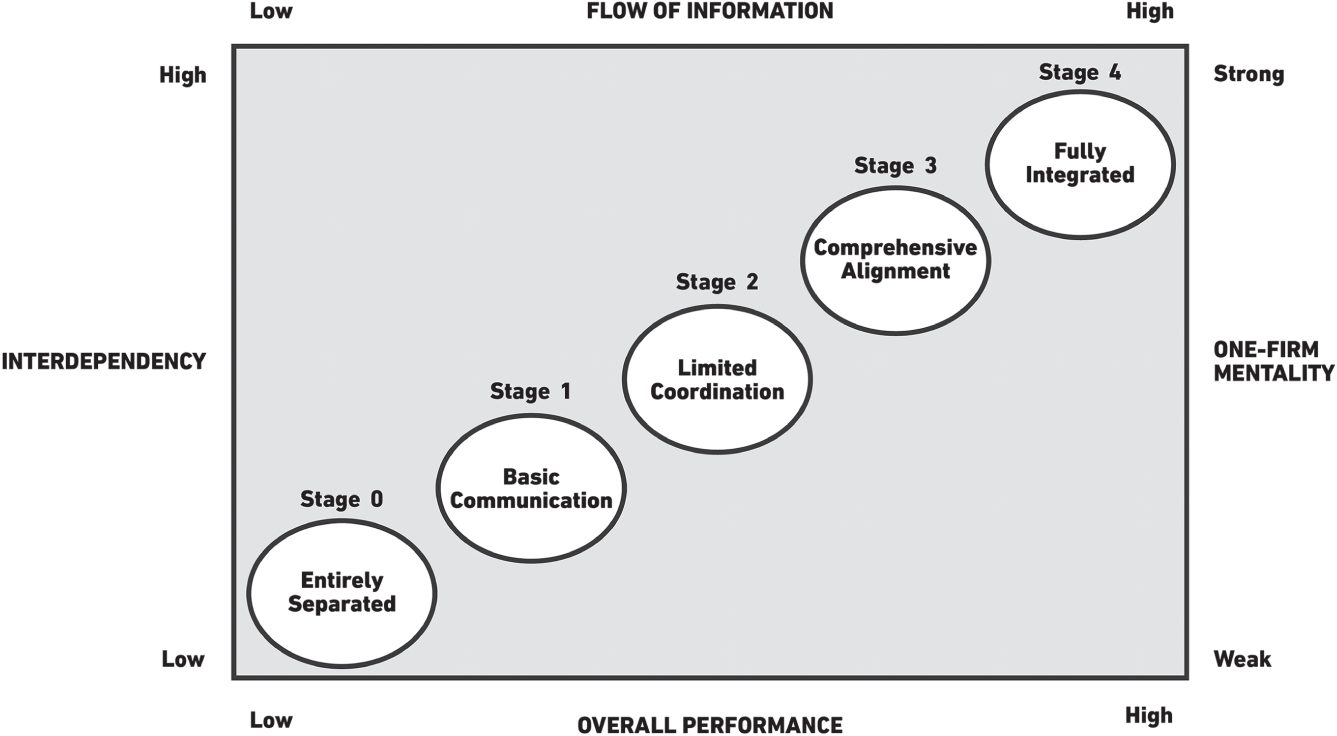
FIGURE 14.3 From separation to integration of the marketing and finance departments
Similar to the previous stage, each person in the two departments still focuses on their respective goals based on the KPIs of their given department. While maintaining their routines, they have begun paying attention to the agenda of one another. They recognize that these could have implications for other functions. Both departments have shown signs of coexistence but don't collaborate to solve internal problems.
Differences of views are evident between the two departments, especially regarding budget allocations, how to use them, and what they want to achieve. However, both departments intend to adjust to enhance suitability in operational matters. Financial professionals do not fully believe most assumptions that marketers use when submitting the marketing budgets. Yet the finance team has started to share information with marketing about their expectations regarding the budget allocation. Marketers have started to consider the financial team's concerns in using this budget.
Stage 2: Limited Coordination
In this second stage, the relationship between the marketing and finance departments has shown significant progress, marked by better coordination efforts. The two departments have more formal lines of communication to exchange more helpful information. Apart from scheduled formal communication, informal communication has become more fluid. Each department has viewed the other's challenges more comprehensively. The exchanged information is becoming more relevant and is sometimes used for strategic goals.
The marketing department has started to use general financial terms (other than sales) to bridge communications, such as margin per product or brand, break‐event points, customer acquisition costs, and so on. However, most of the KPIs used by the marketing team still tend to be nonfinancial. Meanwhile, the finance team has started to use some marketing jargon in discussion sessions. These include market segments that provide the most significant contribution to sales, the products or brands that are the most profitable, and customer lifetime value. Coexistence is aligning with the increasing interdependence between departments.
Although there are still differences in views between the two departments, they can be better reconciled. Finance professionals have started to believe some of the assumptions used by the marketing team when submitting their budgets.
The marketing team has become more dedicated to meeting some of the expectations of the finance team. The relationship is becoming harmonious due to the openness of communication and better information exchange. Physically, the workspace of the marketing and finance department in an office is adjacent or at least closer to one another. They hold regular monthly meetings to review business growth, budget use, and the results, both nonfinancially and financially. They resolve different expectations, problems, and issues in formal and informal meetings. Each department has appointed its liaison to facilitate better coordination. Both collectively establish policies and regulations to avoid disputes or unproductive conflicts.
Stage 3: Comprehensive Alignment
In the third stage, the relationship between the two departments progresses beyond limited coordination to become more comprehensively aligned toward common goals. In addition to strengthening the established communication lines, the two departments have started to use a shared information platform that both departments can update in real time. Both parties increasingly align their activities in terms of objectives they should achieve, KPIs agreed on and used, the division of tasks, decision‐making processes, implementation, and monitoring by a joint team of the two departments. There is more collaboration in almost every process, resulting in a growing interdependence.
There are no more obstacles regarding informal communication between departments. Even formal communication can run on a day‐to‐day basis. Each department sees problems in other departments more comprehensively and starts to discuss and resolve issues together. The information exchanged is no longer just relevant but always up‐to‐date, well disseminated, and quickly responded to by multiple parties from the two departments, for both strategic and tactical matters.
Information becomes a vital foundation because the two departments have entered the data‐driven alignment stage. The data is used to make accurate predictions. Inter‐departmental conflicts still occur, but only at a moderate level. Both departments are more focused on facing challenges together to ensure the best results for the company.
The marketing department has begun to use financial information fluently to make decisions regarding the budgets. They aim to effectively use company assets to increase sales. The marketing team uses several financial KPIs to complement and justify the outcomes measured by different nonfinancial KPIs.
The finance department team has also increasingly understood the marketing processes down to the operational level. They provide input on increasing efficiency and improving profit margins. The finance department has come to appreciate many aspects in marketing, such as the customer database, product innovation capability, and brand equity. The finance team believes that those intangible assets can affect financial results and the company's market value.
The ideal coexistence is becoming a reality, and interdependence is strong. Financial staff members have started to believe and are even involved in determining assumptions used by the marketing team. The fact‐based approach has become commonplace, enhancing objectivity in the budgeting decision process for the marketing department.
Marketing personnel have become more involved in setting marketing financial goals that are objective and achievable by the marketing team. Both departments have the same expectations. The relationship is harmonious because both communicate in an understandable language and refer to the same information platform that they can access in real time. The information is accurate and up‐to‐date. Financial people are fluent in using the lingo of the marketing person and vice versa; the marketing team understands and uses the language of the financial people.
The two departments hold regular weekly meetings to review the overall productivity. They look for available opportunities to grow the business. Both departments strive to avoid issues that could hinder the performance of either one.
Stage 4: Fully Integrated
The fourth stage is when the full integration of the marketing and finance departments occurs. Even though the boundaries are clear, all collaborative processes between the two departments are flexible and accommodative. Communication is carried out through offline and online platforms, allowing for a seamless relationship.
With the support of AI technology, management can use dynamic information to make predictions and contextual solutions, including customization and personalization. KPIs for both marketing and finance are monitored minute by minute on a dashboard that both departments can access. The decision‐making process is also swift and in line with the pace of changes in the business environment. Interdependence reaches its peak so management can reduce the margin for error to the lowest level.
Formal and informal communication occurs effortlessly. The unnecessary bureaucracy, which often slows down the company's managerial process, no longer exists. Each department further broadens its horizons by discussing operational and tactical matters related to strategic issues. Hence, the two departments always refer to the relationship between achievements of two different KPIs. For instance, they discuss the relationship between market share and profitability, the sensitivity of selecting market segments to profit margins, the relationship between customer data platform (CDP) use on customer loyalty and sales, and the influence the acquisition of a brand can have on the company's market value. This strategic relationship ultimately refers to one goal, namely, the company's sustainability, beyond the conventional KPIs of each department.
The integration of the marketing and finance departments is characterized by data‐ and tech‐driven decision‐making processes. Computational analysis of data, including big data, or extensive statistics is commonplace. This systematic analysis (or what is known as analytics) will produce meaningful information and insights that form the basis for joint decisions of the two departments. This simultaneously strengthens the integration of the two departments, both at strategic and tactical levels.
The use of company resources under the control of the marketing and finance department has been optimal for its effectiveness and efficiency, focusing on economies of scale and optimizing economies of scope. Full integration with the help of technology can eliminate conflicts and enhance a one‐firm mentality. There are no more communication problems because one department already understands the language of the other department and vice versa.
The finance department team sees the marketing department as a strategic business unit that requires budget allocation for operational needs (OPEX) and investment (CAPEX). The difference in perspectives is minimal, because processes tend to be fact‐based and data‐driven. If it is necessary to use some assumptions, the two departments will jointly develop them. This total interdependence also causes the two departments to create a “success and fail together” mentality, which shows strong cohesiveness and coexistence.
The finance department channels the operational budget and investment to the marketing department. Marketing provides returns to the finance department. Any value for money spent will have an obvious purpose for what it is, and it will also be clear about the results. The two departments have the same vision, develop a joint strategy consistent with the corporate strategy, and use the system or platform together. Coordination at C‐suite, especially among the CEO, CFO, and CMO, is becoming more harmonious, and the “tug‐of‐war” phenomenon is no longer visible.
To see an integration in action, consider the case of ABB Group, which appointed a double‐headed CFO. This position oversaw the global marketing team along with finances. This ensured the connectivity required to run business operations.8
The Finance–Marketing Loop
The finance–marketing looping runs flawlessly in a fully integrated condition. With the support of technology, it will strengthen the marketing and finance integration platform. Figure 14.4 relates this relationship.
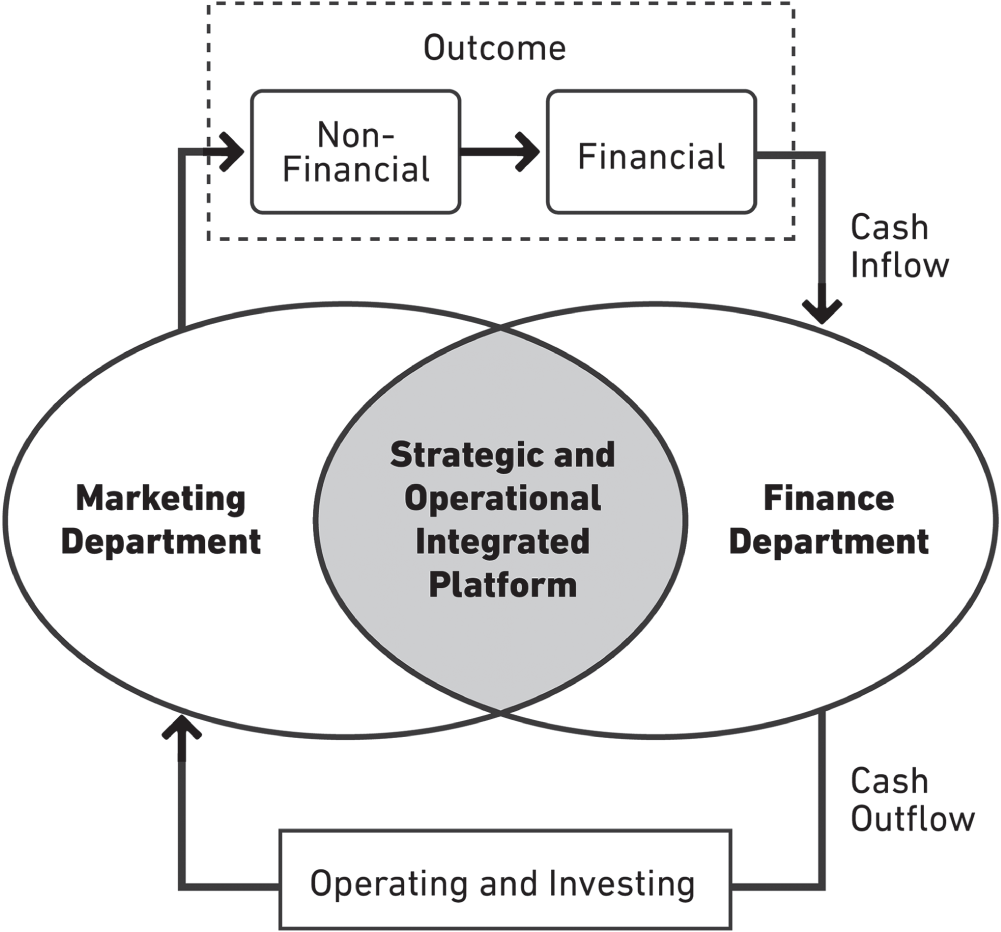
FIGURE 14.4 Simplification of finance–marketing loop
The looping process begins when the two departments set goals and strategies to achieve these goals before the budget allocation. In addition, the two departments outline and agree on technical or operational matters to ensure a smooth execution stage. Both departments do all their work through an integrated offline and online platform.
The marketing department will allocate the budget for marketing operational activities and investment on at least three elements: customer, product, and brand (see Table 14.3).
TABLE 14.3 Examples of Financial Activities on Customer, Product, and Brand
| Operational (Short Run) | Investment (Long Run) | |
|---|---|---|
| Customer |
|
|
|
| |
|
| |
|
| |
|
| |
|
| |
| Product |
|
|
|
| |
|
| |
|
| |
| Brand |
|
|
|
| |
Offline brand activation:
Online brand activation:
|
|
The marketing team must deliver to the finance department a demonstrable result from these operational and investment activities. First, the marketing department will achieve several nonfinancial goals by creating product or brand awareness in the eyes of prospective customers or their specific target market. If the market sees a clear value proposition, non‐overpromised positioning, strong differentiation, and the chance to receive real solutions, this will create a strong appeal for the product or brand and ultimately generate customer loyalty.
Later, the sales team will convert these nonfinancial achievements into financial results, step‐by‐step from a preference to an interest in buying, and finally, purchase. Purchases in cash will immediately generate cash inflows for the finance department, whereas noncash purchases will result in account receivables that will become cash and will be received by the finance department. If the nonfinancial KPIs achieved are strong enough, but the financial results are not satisfactory, it will be concluded that something is awry. Both departments will work to find the root cause and solve it quickly.
With tangible results in the form of returns, trust will be built between the finance and marketing departments. This accelerates the finance–marketing loop cycle. In essence, the marketing department must always link its efforts with actual value creation as reflected in both nonfinancial and financial metrics.
Marketing investments, usually in intangible assets such as brands, sales networks, loyal customers, and product differentiation, cannot be recorded in a balance sheet. However, these intangible assets have value at a certain range of prices, as indicated by the variance between book value and market value. If we find that the market value is higher than the book value, then the value of intangible assets, including those created through marketing investments, will have a higher value. The high value of intangible assets can be used as an indicator to show that the company's future financial performance is promising.10
Based on these explanations, marketing teams should not be lulled by the view that only marketing is everyone's job. Now finance is also everyone's job, especially for marketing people themselves. As such, marketers can understand and master the language of finance. With those tools in hand, the department can better communicate with other functions and show up at C‐suite meetings, ready to carry its own weight in strategic conversations.
Therefore, it is necessary to develop a focused finance course for marketers. This could be offered through educational institutions as well as in‐house training programs at companies. The lessons could demonstrate the key ratios to know, explain how to communicate with finance, and lay out the process to integrate both functions.
Key Takeaways
- A partnership between marketing and finance can reduce friction, lead to integration, and propel the company toward growth.
- The relationship between marketing and finance can be identified as five stages on a spectrum, ranging from both departments operating as separate groups to being fully integrated. These stages are: entirely separated (stage 0), basic communication (stage 1), limited coordination (stage 2), comprehensive alignment (stage 3), and fully integrated (stage 4).
- When fully integrated, there is a loop that runs flawlessly between finance and marketing; it can be continually strengthened and upleveled.
- Both marketing and finance knowledge are needed throughout an organization. To raise awareness, companies can hold internal training sessions to teach basics.
Notes
- 1 https://www.marketingweek.com/the-top-100-most-valuable-global-brands-2013/; Sunil Gupta, Srinivas Reddy, and David Lane, “Marketing Transformation at Mastercard,” Harvard Business Review Case 517–040 (2019); https://www.kantar.com/campaigns/brandz/global
- 2 https://cmosurvey.org/wp-content/uploads/2021/08/The_CMO_Survey-Highlights_and_Insights_Report-August_2021.pdf
- 3 Ibid.
- 4 https://www2.deloitte.com/us/en/insights/topics/strategy/impact-of-marketing-finance-working-together.html
- 5 https://smallbusiness.chron.com/accounting-marketing-work-together-38276.html
- 6 https://www.investopedia.com/articles/personal-finance/053015/how-calculate-roi-marketing-campaign.asp
- 7 https://www.bigcommerce.com/ecommerce-answers/what-is-cost-per-acquisition-cpa-what-is-benchmark-retailers/
- 8 https://hbr.org/2014/12/why-corporate-functions-stumble
- 9 Based on “Condensed Consolidated Statement of Operations (Unaudited) of Apple.” Apple considers R&D as operational expenses. Please see more at https://www.apple.com/newsroom/pdfs/FY20-Q3_Consolidated_Financial_Statements.pdf
- 10 https://knowledge.wharton.upenn.edu/article/non-financial-performance-measures-what-works-and-what-doesnt/