Chapter 12 Monitor and Troubleshoot Your Exchange Environment
In This Chapter
![]() Monitor Your Exchange Environment
Monitor Your Exchange Environment
![]() Use the Exchange 2007 Toolbox to Troubleshoot
Use the Exchange 2007 Toolbox to Troubleshoot
![]() Use the EMS Test Cmdlets for Troubleshooting
Use the EMS Test Cmdlets for Troubleshooting
Solution: There are two sides to monitoring—the manual side and the automatic side. Obviously, as a busy administrator you want to automate the process as much as possible. To accomplish that, you have to first determine what you really need to watch and then manually configure the software to monitor and report on itself.
NOTE Microsoft uses a methodology called the Microsoft Operations Framework to control the process it calls lifecycle management. This includes a great deal of time and planning along with mediation on the cycle and how you can maintain your infrastructure. Within the plan, Microsoft includes schedules you can use to help monitor Exchange. Go to the TechNet site at http://technet.microsoft.com/en-us/library/bb266969(EXCHG.80).aspx and note that there are daily, weekly, monthly, and as needed tasks to care for. You can print operations checklists too, or tweak them to make them your own.
Some of the tools you can use to assist you include the following:
![]() Performance Monitor
Performance Monitor
![]() Event Viewer
Event Viewer
![]() Performance Troubleshooter
Performance Troubleshooter
![]() Microsoft Operations Manager (MOM 2005)
Microsoft Operations Manager (MOM 2005)
![]() Systems Center Operations Manager (SCOM)
Systems Center Operations Manager (SCOM)
Let’s consider the use of each one.
The Reliability and Performance Monitor (which is the new tool introduced to us in Windows Vista, used for performance monitoring in Server 2008) is still a fine tool for checking out our Exchange situation. However, there is a Performance Monitor option from within the Toolbox that is already set up with all the needed objects and counters.
To use the EMC’s preconfigured Performance Monitor, perform the following:
1. Open the Exchange Management Console (EMC).
2. From the Navigation Tree, select Toolbox.
3. Scroll down to the Performance tools, select Performance Monitor, and then, from the Actions pane, select Open Tool.
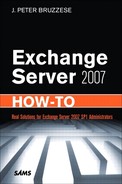
4. Here you can see (in Figure 12.1) the preconfigured options, some of which are server-oriented, such as Processor (% Processor Time) and Memory (Pages/sec). Others relate to the MSExchange Store Interface, the Information Store, the IS Mailbox, the Transport Queues, and the Transport SMTP Send and Receive.
5. If the screen appears too busy, you can deselect the checkboxes for the counters you do not need.
6. If you want to add new counters, you can click the plus button and choose the objects and counters you need.
Later in this chapter, we discuss what Microsoft is pushing for your Exchange monitoring tool—MOM 2005. One of the necessary features to any monitoring tool is the capability to alert an administrator when there is a problem. That problem can be something as simple as your server reaching low disk space, and you want to know about it as soon as possible.
However, even if you do not have MOM 2005 and don’t intend to purchase it and use its features in your environment, you can still use Performance Monitor to alert you to Exchange-oriented issues.
NOTE Keep in mind that the Performance Monitor tool for Server 2003 is different from Server 2008. With Server 2008, we now have Data Collector Sets, which you can use to define certain actions and alerts to occur. We present both methods of configuring the alerts.
You can create alerts for many different reasons. Here is just one example.
To place an alert for disk space issues (through either the normal Performance Monitor or the Exchange Server Performance Monitor) on a Server 2003 system, perform the following steps:
1. From within the Monitor tool, locate the option in the navigation pane called Performance Logs and Alerts.
2. Right-click Alerts and choose New Alert Settings.
3. Type in something logical, such as Low Disk, and click OK.
4. There is a Comment field you can use to explain the purpose of your alert.
5. Click the Add button.
6. Choose the Exchange server you want to monitor from the Select Counters from Computer drop-down box.
7. Choose Logical Disk from the Performance Object drop-down, and choose Free Megabytes from the Select Counters From list box.
8. Confirm your choices and click Add. Then click Close.
9. Select Under from the Alert and type in a number in MB that represents the amount of disk space you wish to be worried beyond. Perhaps it is 25%, 20%, 15% and so on—figure out the amount that percentage is in relation to the disk drive and use the MB.
10. Alter the Sample Data Every settings to once per day.
11. Select the Actions tab and select the way you want to be alerted.
12. From the Schedule tab, you can choose the time the alert can run (or set it to be run manually).
13. Click OK.
You can create alerts for many different reasons. Here is just one example.
To place an alert for disk space issues (through either the normal Performance Monitor or the Exchange Server Performance Monitor) on a Server 2008 system, perform the following:
1. From within the Monitor tool, locate the option in the Navigation pane called Performance Logs and Alerts.
2. Expand out the Performance Logs and Alerts.
3. Expand Data Collector Sets.
4. Select and then right-click User Defined.
5. Choose New and then Data Collector Set to open the wizard.
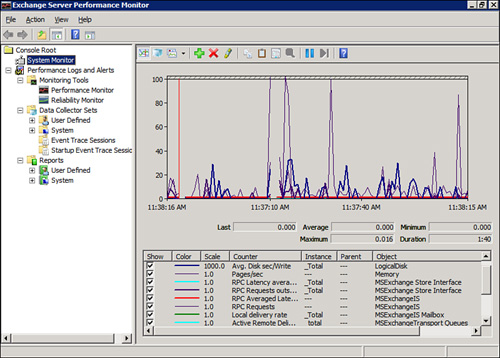
6. From the opening screen, shown in Figure 12.2, you can input a name (perhaps Low Disk Space), and then choose Create Manually (Advanced). Click Next.
7. When asked, “What type of data do you want to include?” select the Performance Counter Alert radio option. Then click Next.
8. When asked, “Which performance counters would you like to monitor?” click Add.
9. Choose the Exchange server from the Select Counters From Computer drop-down.
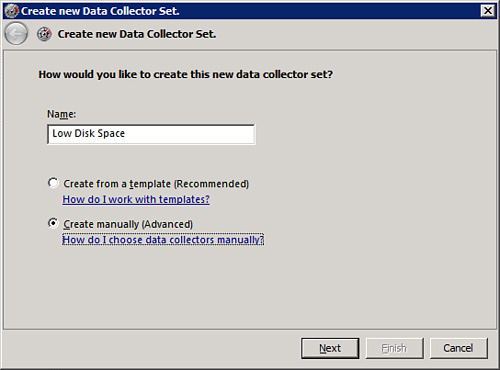
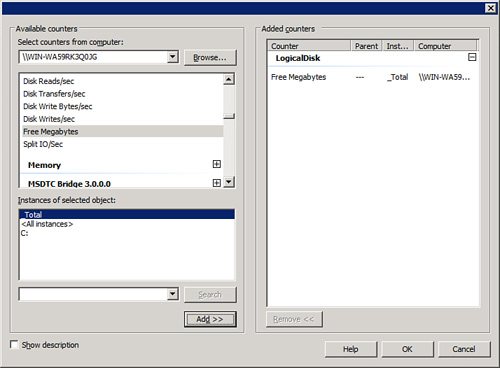
10. From the Available Counters list, select LogicalDisk.
11. Then select % Free Space or Free Megabytes as the counter. Choose Add, and it will be added to the Added Counters section, as shown in Figure 12.3.
12. When ready, click OK.
13. Then you can choose to alert when above or below a certain limit.
14. Click Next and Finish.
15. To configure the alert you want to occur, select your new Data Collector Set and then click Properties from the Actions pane.
16. On the Alerts tab, you should see the configuration for the collector set already.
17. Select the Alert Action tab and choose to write an entry to the application event log. (Note we discuss the Event Viewer in the next section.) You can also start another Data Collector Set if the alert criteria is met.
18. Select the Alert Task tab to choose a Windows Management Interface (WMI) task and arguments to run if the criteria are met.
19. When you are finished, click Apply, and then click OK.
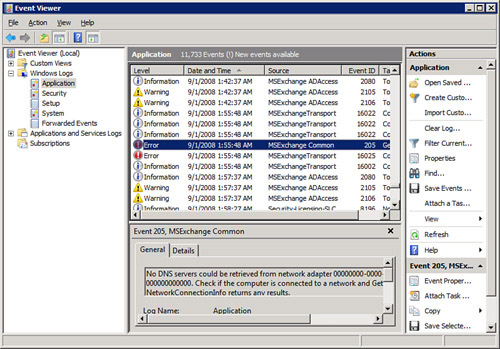
In both Server 2003 and Server 2008 (which includes the more advanced and complicated form of Event Viewer), there are Application logs. Because Exchange is considered an application, your informational or failure events are located here. This makes Event Viewer an essential part of your monitoring of Exchange.
There is software that automatically checks through event logs for predetermined flags with Exchange. However, you can manually open the Event Viewer to look for problems, too.
As you can see in Figure 12.4, you have Error, Warning, and Informational types of levels that are reported. The source might come from a variety of different places and the event IDs can range from the lower numbers into the thousands, so it is almost impossible to try to keep track of all this. Another solution that is programmed to keep track of all of those events would be a better solution, as we will see with MOM and/or SCOM. However, there are times when there are obvious codes or events that you are looking for, and you can use the filtering features of Event Viewer to track these down.
Another feature of the Event Viewer in Server 2008 is the capability to attach a task to an event. Let’s say you see an error is repeating on your server. You want to know the next time it happens immediately. So, you locate the error in the Event Viewer and perform the following:
1. Select the event to which you wish to attach a task.
2. From the Actions pane, select Attach Task To This Event to begin the Create Basic Task Wizard.
3. The first screen should have the name of the task already, but you can modify this. You can also include a description, and then click Next.
4. Because you are creating this task to occur based off of an actual event, the Log, Source, and Event ID are already filled in for you (and grayed out) on the When a Specific Event Is Logged screen. Click Next.
5. On the Action screen, you can choose to perform the following:
![]() Start a Program.
Start a Program.
![]() Send an E-mail.
Send an E-mail.
![]() Display a Message.
Display a Message.
6. Depending on the option you select in Step 5, you are able to configure which program you want, the email you wish to send, or the message you want displayed on the screen. Select your action and click Next.
7. Input the details of your action and then click Next.
8. On the Summary screen (shown in Figure 12.5), you are shown the name, the trigger (what will kick off the action), and the action. You can choose the option Open the Properties Dialog For This Task When I Click Finish in the event you want to make further adjustments to the task.
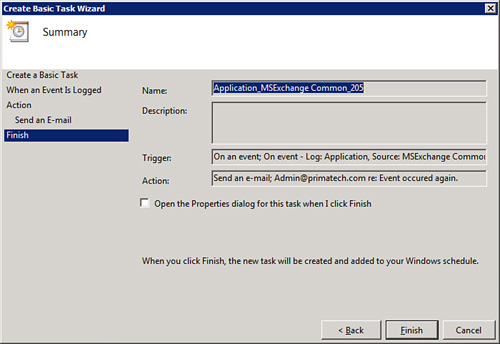
9. Click Finish.
In the Toolbox, directly beneath the Performance Monitor is a tool called the Performance Troubleshooter. This can be a monitoring tool or a troubleshooting tool, depending on what it is you are concerned about with your Exchange server. It can even assist with solutions to your problems or performance issues.
To use the Performance Troubleshooter, perform the following steps:
1. Open the EMC.
2. From the Navigation Tree, select Toolbox.
3. Scroll down to the Performance tools, select Performance Troubleshooter, and then from the Actions pane, select Open Tool.
4. You are first taken to the Update the Exchange Troubleshooting Assistant. If no updates are needed, select the Go to the Welcome Screen link.
5. You are asked to label the analysis that will be performed. Then select either the option Troubleshoot New Performance Issue or the Analyze Previously Collected Data option. If this is your first time looking at Performance Troubleshooter, you want to choose Troubleshoot New Performance Issue. If you have an analysis you want to view, choose Analyze Previously Collected Data. Then click Next.
6. You are asked, “What symptoms are you seeing?” and you can choose one of the following:
![]() Multiple users are complaining of delays while using Outlook or are seeing the Outlook cancellable RPC dialog frequently.
Multiple users are complaining of delays while using Outlook or are seeing the Outlook cancellable RPC dialog frequently.
![]() The number of RPC operations per second is higher than expected.
The number of RPC operations per second is higher than expected.
![]() The number of outstanding RPC requests is high.
The number of outstanding RPC requests is high.
7. Make a choice depending on the problems you notice, and click Next.
8. You are asked for a Server Name. The Global Catalog Server Name is usually filled in by default. You can Show Advanced Login Options and alter the credentials to be used. Then click Next.
9. In the Configure Data Collection section, there are many options. You are shown the root-data directory and you can start the collection immediately or set a scheduled time. If you show advanced data collection options, you can turn on or off settings such as the following:
![]() Collect PerfMon Data
Collect PerfMon Data
![]() Collect ExMon Data
Collect ExMon Data
![]() Collect Function Call Log (FCL) Data
Collect Function Call Log (FCL) Data
![]() Collect Event Log Data
Collect Event Log Data
10. Review the options, make the changes you prefer, and click Next.
11. The analysis is performed and the Connectivity Test Results page is displayed, as shown in Figure 12.6.

NOTE ExMon is the Exchange Server User Monitor, a tool that was developed to collect performance data regarding Outlook (MAPI) clients and their performance. Unfortunately, it is not easily obtained for Exchange 2007. It seems you have to open a support incident with Microsoft or be an MS Gold Partner to obtain the tool.
Now you can perform the analysis of the gathered data, either immediately or by restarting the process at a convenient time. To do so, perform the following:
1. From the Connectivity Test Results page, click Next.
2. The files are read and analyzed. In the end, you are presented with a Performance Summary tab, a Performance Details tab, and an Informational Items tab.
3. The tool offers to investigate user activity. Click Next.
4. You are presented with a variety of options from which to choose. For example, if high RPC is found on the server, there could be a third-party Outlook add-in to blame, so you are asked to provide additional information regarding the users of the server. Then click Next.
5. Your system will check the following items:
![]() Disk drives
Disk drives
![]() Location of the data files
Location of the data files
![]() Queue performance
Queue performance
![]() LDAP health
LDAP health
![]() Network performance
Network performance
![]() Miscellaneous checks
Miscellaneous checks
![]() ExMon RPC analysis
ExMon RPC analysis
![]() FCL analysis
FCL analysis
6. You are finally presented with a final set of results with the Overview of all items, Performance Issues, Execution Issues, Recommendations, and General Information, as you can see in Figure 12.7.
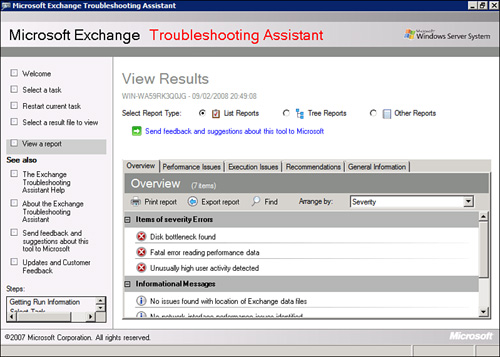
7. You can change the report type from List Reports to Tree Reports or Other Reports. You can see the various issues and print the report, export the report, use the Find option to locate something specific, or arrange by severity or issue.
This tool can be used for troubleshooting, but it is better to use it for monitoring and reporting first. Fix the problems before they grow too large.
It is beyond the scope of this book to venture into the world of Microsoft Operations Manager 2005. It’s an event and performance management system that watches event logs and does proactive alerting and reporting. It looks at a baseline and can perform trend analysis.
NOTE MOM 2005, although widely used in the workplace, has been replaced by Systems Center Operations Manager (SCOM) 2007. You can continue to use MOM if that is what is used in your environment, and Microsoft provides Management Packs for its continued use. However, if you do not have MOM in place, you should consider implementing SCOM, which also has management packs for Exchange 2007 SP1.
In terms of Exchange 2007, it can identify peak workload hours, detect abnormal behavior, and provide detailed reports regarding your environment.
To get MOM up and running, you need to install the SQL Server first and then the MOM database. Finally, to extend the functionality of MOM to give you the Exchange features, you need to install the Exchange Management Pack.
PS NOTE
The Exchange Management Pack takes advantage of the Test cmdlets (which we discuss in detail toward the end of this chapter), returns the results to MOM, and presents them in an easy-to-read report.
You need to install Internal Agents on the internal Exchange servers, such as the Hub Transport, Client Access, Unified Messaging, and Mailbox servers. Or, you can install External Agents to work with the Edge Transport servers.
You can download the management pack from Microsoft; it’s a free download. It comes in as an MSI file and you have to open it and extract the files first. If you have MOM already up and running, you can install a management pack by performing the following:
1. Open the MOM 2005 Administrator Console. Click Start, All Programs, Microsoft Operations Manager 2005, and then click Administrator Console.
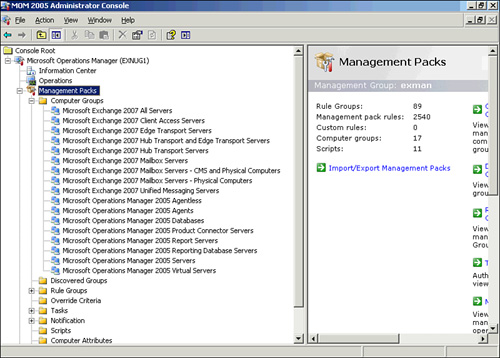
2. From the Navigation pane, you can see the Management Packs section. If you expand this and select Computer Groups, you see a variety of different MOM options, but none relate to Exchange 2007.
3. Click Management Packs.
4. Right-click Management Packs, and select Import/Export Management Pack to open the wizard. Click Next.
5. You can choose to import or export management packs. Select the radio button to import, and then click Next.
6. You can choose where the pack is located (which is where you extracted the files), and you can choose the type of report you want to perform. In this case, select Import Management Packs only. Click Next.
7. You are asked to select the management pack, and then you have to select import options. Choose either Update Existing Management Pack. Custom Rules, Enabled/Disabled Settings, and Company Knowledge Will Be Retained or Replace Existing Management Pack.
8. You can choose to back up the existing management pack and browse for a location. Then click Next.
9. You are shown the Import Status as it imports the information. When you return to the console and look at the Computer Groups again, you can see in Figure 12.8 that you now have a lot of Exchange 2007 options.
Next, you install agents. You can do that from the wizards provided in the Administrator Console for internal agents (for the Hub, CAS, MB, and UM roles). However, for your Edge transport servers, you have to install the agents manually.
NOTE Keep in mind that many other tools exist beyond what we have in our Toolbox. Troubleshooting is not an easy task at times, and we need to reach for a different set of tools, such as Eseutil.exe, which is used for offline defragmentation and analysis of the database’s integrity. Other tools can be located on Microsoft’s website and can be used to perform everything from benchmarking (Load Generator, Exchange Stress and Performance 2007, and Exchange Server Jetstress) to gathering information (Exchange Profile Analyzer and Information Store Viewer) and more. The point is that you should investigate more tools if you plan to be a solid Exchange Administrator.
Considered a management tool, the Exchange Best Practices Analyzer (ExBPA) performs monitoring and troubleshooting by ensuring best practices are being followed between your Exchange servers and the AD environment.
NOTE We discussed this tool earlier in Chapter 3, “Install Exchange 2007,” because it had a readiness check before installing your first Exchange server.
With the ExBPA, you can perform a baseline of your system to report differences it sees from that baseline and future scans. You can also perform a health check, a health/performance check, a permission check, a connectivity check, and the readiness check.
To run the tool, perform the following:
1. Open the EMC.
2. From the Navigation Tree, select Toolbox.
3. At the top, under Configuration Management Tools, select Best Practices Analyzer, and click Open Tool from the Actions pane.
4. The tool checks for updates, and then you can click the link Go to the Welcome Screen.
5. You can begin a new scan or look at a preexisting scan you performed at an earlier time. In this case, click Select Options for a New Scan.
6. You are asked to provide the name of the AD server (usually this is filled in for you), and you can show advanced login options if you need to change your credentials to access the AD server. Then click Connect to the Active Directory server.
7. As you can see from Figure 12.9, you need to provide a name for the scan, select a scope (an entire organization or individual servers), and then choose the type of scan to perform. Keep in mind that if you choose a baseline, it could take up to two hours. Then choose the speed of the network and click Start Scanning, or you can schedule a scan to occur at a better time.

8. After the scan has completed, you can choose the link View a Report of This Best Practices Scan.
9. You are shown a report that provides critical or informational issues that are affecting the health and performance of your Exchange organization. Suggestions are also made to correct the problems that are found.
10. When you see a problem, select it and you are shown options to learn more about the problem and how to resolve it.
11. When complete, close the analyzer.
Within the Toolbox, we have two disaster recovery tools.
When a disaster strikes with your database (or disks), the Database Recovery Management tool can help you to bring your system back online.
To run the Database Recovery Management tool, perform the following:
1. Open the EMC.
2. From the Navigation Tree, select Toolbox.
3. Under Disaster Recovery Tools, select Database Recovery Management and click Open Tool from the Actions pane.
4. Select Go to Welcome Screen.
5. You are asked for server and user information. Provide a label. Make sure you have both an Exchange server and domain controller name in the required fields. If there is a need to alter your logon options, you can select Advanced Logon Options and then click Next.
6. You are asked to select one of the following tasks:
![]() Manage Databases
Manage Databases
i. Analyze log drive space
ii. Repair database
iii. Show database related event logs
iv. Verify database and transaction log files
![]() Manage Recovery Storage Group (if you have one created; otherwise you have to create one first)
Manage Recovery Storage Group (if you have one created; otherwise you have to create one first)
v. Merge or copy mailbox contents
vi. Mount or dismount databases in the recovery storage group
vii. Remove the recovery storage group
viii. Set up ‘Database can be overwritten by restore’ flag
ix. Swap databases for ‘dial-tone’ scenario
![]() View Results
View Results
x. Go to Results Page
Obviously, there are many different ways to go with this tool. In fact, we already discussed recovery storage groups and dial-tone recovery quite extensively in Chapter 9, “Design and Deploy Disaster Recovery Settings.”
This tool is not quite as powerful as the Recovery Management tool. You use this tool in situations where the database won’t mount or there are inconsistencies in the log file—perhaps you have run out of disk space or the log files have run out of numbers for the log file naming (which is unlikely, but it can happen).
When you have a problem with your Exchange server that isn’t a database issue or a physical problem with a server, oftentimes it is a mail flow issue. Mail isn’t flowing properly, mail is getting stuck somewhere, mail isn’t leaving your organization to go to the outside—these issues can cause frustration on the part of your users.
Several tools within the Toolbox can assist in this regard. Let’s examine them one at a time.
When using the Mail Flow Troubleshooter, you can indicate the symptom that you are trying to track down. The symptoms include the following:
![]() Users receive unexpected nondelivery reports when sending messages.
Users receive unexpected nondelivery reports when sending messages.
![]() Expected messages from senders are delayed or are not received by some recipients.
Expected messages from senders are delayed or are not received by some recipients.
![]() Messages destined to recipients are delayed or are not received by some recipients.
Messages destined to recipients are delayed or are not received by some recipients.
![]() Messages are backing up in one or more queues on a server.
Messages are backing up in one or more queues on a server.
![]() Messages sent by user(s) are pending submission on their mailbox server(s) (for Exchange Server 2007 only).
Messages sent by user(s) are pending submission on their mailbox server(s) (for Exchange Server 2007 only).
![]() Problems with Edge Server synchronization with Active Directory (for Exchange Server 2007 only).
Problems with Edge Server synchronization with Active Directory (for Exchange Server 2007 only).
This is not a new tool in Exchange, but it is one that has evolved over time and we appreciate its purpose. Message tracking is enabled by default on the Hub and Edge Transport servers and the Mailbox servers.
You can use the Exchange Management Shell (EMS) to search message-tracking logs; however, the EMC offers a search tool with a simple interface to work with. If you wish to use the EMC to search the message tracking log, perform the following:
2. From the Navigation Tree, select Toolbox.
3. Under Mail Flow Tools, select Message Tracking, and from the Actions pane, click Open Tool.
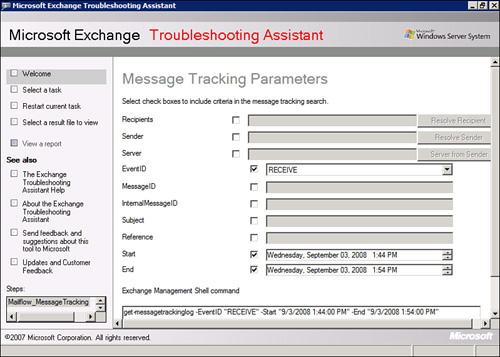
4. On the Message Tracking Parameters page shown in Figure 12.10, you can select checkboxes to include criteria in the message-tracking search. You can configure the following:
![]() Recipients
Recipients
![]() Ender
Ender
![]() Server
Server
![]() EventID (by default is set to RECEIVE)
EventID (by default is set to RECEIVE)
![]() MessageID
MessageID
![]() InternalMessageID
InternalMessageID
![]() Subject
Subject
![]() Reference
Reference
![]() Start
Start
![]() End
End
5. Make your configuration choices and then click Next.
PS NOTE
You can see the Exchange Management Shell command listed at the bottom of the Message Tracking Parameters with the options you have provided.
It’s impossible to say what you will look for at any given time, so these options change depending on your needs. Notice the extreme flexibility in this tool. Here you have the EventID, where, if you select the down arrow, you can see several options such as RECEIVE (which is used to look for messages received by the server), DELIVER (used to search for messages delivered to a mailbox), or SUBMIT (used by Mailbox servers that submit items to the Hub Transport servers).
The Queue Viewer is a tool that shows SMTP messages that have not completed their journey. These might be inbound or outbound messages, and they can be delayed for any number of reasons.
From within the Queue Viewer, you can choose the server you wish to connect to (the default is the local server). You are shown three different views of the queues: all queues on the server, all messages in all queues on the server, and all messages filtered for a specific queue.
You might be able to determine whether messages are sitting in the queue because DNS is failing, Hub Transport servers are not available, or perhaps the destination server is unavailable. Another feature is the capability to remove with NDR and remove without sending NDR, which is great for spam that is coming into your server.
NOTE If the Queue Viewer doesn’t start because the Transport Service isn’t starting, you might have an IPv6 issue. Before you try to start the service, go to your network properties, and even if IPv6 is enabled, provide a static IP address for the connection. Then start the Transport Service and you will have no trouble starting Queue Viewer.
The Routing Log Viewer is a new tool in Exchange 2007 SP1. It is designed to work on the Hub Transport and Edge Transport servers. This tool can help analyze the routing topology and determine whether the way mail moves is the best method for the site topology.
When you open the tool, it is a blank box. To open log files, perform the following:
1. From within the Routing Log Viewer, select File, and then select Open Log File.
2. You can type the name of the transport server, browse server files, or browse local files, depending on where you are running the tool. If you are on the Hub or Edge Transport server already, just click Browse Local Files. Then select a document you wish to analyze and click Open.
3. Here you can see the following tabs:
![]() Active Directory Sites and Routing Groups—Shows your sites and routing groups. You can see if a site whether a hub site (and if it is, the next hop site will be indicated, too). You can see the total cost to deliver mail to the site. The Backoff path is shown, too (in the event there is a problem delivering a message).
Active Directory Sites and Routing Groups—Shows your sites and routing groups. You can see if a site whether a hub site (and if it is, the next hop site will be indicated, too). You can see the total cost to deliver mail to the site. The Backoff path is shown, too (in the event there is a problem delivering a message).
![]() Servers—Lists all the servers within your Exchange organization. You can see the proximity from the local server to those other servers, so you are able to see a map between the servers. You can see server roles for each server, and the total cost to send messages from the local server to other servers.
Servers—Lists all the servers within your Exchange organization. You can see the proximity from the local server to those other servers, so you are able to see a map between the servers. You can see server roles for each server, and the total cost to send messages from the local server to other servers.
![]() Send Connectors—Shows a list of all SMTP connectors for your Exchange organization (including foreign connectors and routing group connectors).
Send Connectors—Shows a list of all SMTP connectors for your Exchange organization (including foreign connectors and routing group connectors).
![]() Address Spaces—Shows address spaces within the organization. Each space has a cost-associated connector that is ordered.
Address Spaces—Shows address spaces within the organization. Each space has a cost-associated connector that is ordered.
4. If you note any configuration changes that must be made, such as if you determine that messages are not routing according to the lowest cost path, consider reviewing your topology and making some changes.
5. When you are finished analyzing, you can close the tool.
One of the more interesting features of the Routing Log Viewer tool is that you can load different routing table logs and see the differences between them. If there are changes between them, they are highlighted and you can see the modification quickly.
Solution: There is a grouping of cmdlets that all begin with the verb Test, including the following:
![]()
Test-ActiveSyncConnectivity—Lets you perform a complete synchronization with the Client Access Server and a specific mailbox.
![]()
Test-EdgeSynchronization—Checks to ensure the Edge Transport servers are synchronized correctly with the Hub Transport servers.
![]()
Test-ExchangeSearch—Ensures search is enabled and indexing.
![]()
Test-ImapConnectivity—Verifies that the IMAP4 service is up and running.
![]()
Test-IPAllowListProvider—Tests the configuration on servers running the Hub or Edge Transport role (because these are the only two servers where the antispam settings can be configured).
![]()
Test-IPBlockListProvider—Tests the configuration on servers running the Hub or Edge Transport role (because these are the only two servers where the antispam settings can be configured).
![]()
Test-Mailflow—Determines whether the System Mailbox can send or receive mail.
![]()
Test-MAPIConnectivity—Determines whether there is MAPI functionality on the server. You can indicate a specific server or, if you do not indicate a server, it will use the System Mailbox.
![]()
Test-OutlookWebServices—This actually verifies that the Autodiscover service settings are running for the CAS server.
![]()
Test-OwaConnectivity—Verifies that Outlook Web Access is running.
![]()
Test-PopConnectivity—Verifies that the POP3 service is running.
![]()
Test-ReplicationHealth—Checks all forms of replication-like cluster services, storage group replication, and so forth.
![]()
Test-SenderID—Determines whether an IP address is legitimate.
![]()
Test-ServiceHealth—Checks to see whether all the required Exchange services that are set to start automatically have started.
![]()
Test-SystemHealth—Has been described as a mini-ExBPA because it checks the system and analyzes it according to best practices.
![]()
Test-UMConnectivity—Tests that the UM server role is functional.
![]()
Test-WebServicesConnectivity—Verifies Outlook anywhere on a CAS server.
PS NOTE
These cmdlets have parameters that make up a syntax for each one. Some can be run without the syntax, whereas others require all the parameters. Being that it is beyond the scope of this book to provide all the PowerShell syntax to every cmdlet, we recommend that you go to http://technet.microsoft.com and do a simple search for any of the PowerShell cmdlets you are interested in using, now that you know what their functions are.