
11.2 Measurement Uncertainty
When you step onto the bathroom scales in the morning, it translates the gravitational force, F, that you exert on it into a readout, which is your weight, W. The relation between them can be expressed as:
(11.1) ![]()
where a represents an offset, b is a proportionality constant (or slope), and ε is the random measurement error. If the scales are well calibrated the readout should be very close to zero when there is no weight on the scales, allowing for some random error. This means that a should be zero. The slope b should also be tuned so that correct readouts are produced when different weights are put on the scales. If either of these two parameters is off we say that there is bias in the readout. If ε is large we say that the readout suffers from noise.
This equation is quite a simplified description of the measurement chain, as the force is not directly translated into readout. In mechanical scales, the force of your body acts on levers, which extend a spring that turns a dial through a rack and pinion arrangement. Each of these components contributes both to the bias and the noise in the readout, and adds to the overall measurement uncertainty. If you want to improve the quality of your data, you must identify the components that contribute the most to the uncertainty and focus your efforts there.
Measurement uncertainty generally comes from a range of sources. Bias is not only due to poor calibration. It can result from drift; for example, if parts in an instrument become worn over time. Environmental factors may also affect the measurements, if humidity, ambient temperature or something similar affects the properties of the components in an instrument or of the measurement object. The measurement procedure is another source. For example, the readout from the scales will depend on if you weigh yourself before or after breakfast, your amount of clothing and so forth. If you do not settle on a specified procedure for weighing, such factors may add both bias and noise to the data. To understand the sources of uncertainty you must consider measuring instruments as well as measurement objects and measurement procedures, and investigate how these are affected by operator skill, calibration procedures, environmental factors and so on. In other words, measurement uncertainty does not only come from the measuring instrument. It comes from the whole measurement system, including the operator, the test object and the instrument.
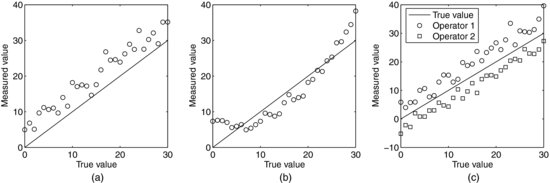
When discussing measurement data it is common to divide the error into a random and a systematic part. Random error produces randomly different results from repeated measurements and averaging over several measurements tends to reduce its effect. The random error is coupled to the measurement precision, or the noise as it was called above. Systematic error means that each repeated measurement at a certain condition is affected by the same influence. This situation is not improved by repeating measurements. It results in bias and is coupled to the measurement accuracy. A systematic error can simply be a constant offset over the entire range of values but, as illustrated in Figure 11.2, bias can also be more complex.
Figure 11.2 (a) Equal bias over the entire range of values; (b) unequal bias, where the offset is a function of the measured value; and (c) operator bias, where the offset is a function of the operator.
Systematic errors must be handled differently than random errors. Calibration of instruments is one important method. We may also know about some background effects and make corrections for them. For example, if we measure the length of objects that are known to expand with temperature, we could employ a temperature correction in the measurement procedure. To avoid uncertainty depending on operator skill or personal judgment it is also useful to formulate a standardized procedure for measurement and make sure that the data are collected according to it. A useful way to monitor the measurement quality is to run regular stability checks, as will be described at the end of this chapter. Repeating a certain measurement regularly, for example once a day, makes it possible to detect drift or sudden changes in the performance of the measurement system.
It is important to note that, although systematic and random errors are defined differently, it can sometimes be difficult to distinguish between them. The temperature expansion of the objects above, for example, is a systematic effect. On the other hand, if this effect is not known, repeated measurements of the same object would yield unexplained differences in the results if the temperature were not constant. This would be interpreted as random noise in the measurements.