
11.3 Developing a Measurement System
Experiments are devised to answer unique questions. For this reason, experimenters must often develop unique setups and unique measurement systems to obtain relevant data. It is of course difficult to give general advice that is useful in all possible situations across several disciplines, but there are a number of general problems that everyone setting up a measurement system has to consider.
Firstly, it is important to note that the measurement system includes the measuring instrument, the measurement object and the operator, and so is very much part of the experiment itself. In many of the previous examples in this book we have seen that the measurement system is co-developed with the experiment. In Chapter 6 we saw how Millikan developed the balanced drop method by trying to avoid the uncertainties inherent in the charged cloud method. In Experiment 1 in the last chapter the wooden arena for the dung beetles was developed to avoid the beetles using the camera stand for orientation. In Chapter 4 we saw how central the details of the measurements were to the successful implementation of Galileo's experiment on the inclined plane. The method for measuring time did not only have to be accurate in itself but also practically suited to the experiment. Keeping an internal rhythm by singing a song actually provided better time measurements than using the swings of a “sophisticated” pendulum, which would require the coordination of two external cues. The channel in the inclined plane was “straight, smooth and polished” to improve the data quality. Settle's reproduction of the experiment showed the importance of allowing the operator a few practice runs before measurement. Clearly, the development of a successful experiment, in many respects, is a process of finding a measurement system that is suited for the problem of interest.
Sometimes, research students are reluctant to engage in practical aspects such as developing or building experimental setups, although this work is often inseparable from the research task itself. It is just as important to research as making a literature study or analyzing data. The sooner we engage in the practicalities of experimentation the sooner we will become productive researchers. Taking an experiment from start to finish often requires that we develop new competencies. Perhaps we will need to learn a bit of electronics, a new programming language, something about materials, or a new statistical technique. Similarly, since each experiment is based on a unique research question, we cannot expect our laboratory to be furnished with equipment that is ready to produce results that are relevant to our problem. Pottering about with equipment and solving practical problems is an important part of what researchers do. How successful would Millikan have been if he had decided that it was someone else's job to develop the balanced drop method? How far would Mendel have come if he had not engaged in collecting and drying his peas or weeding the flowerbeds? Even if it is wise to leave some activities to others, such as manufacturing equipment, it is easier to obtain useful results from an experiment if you are engaged at some level during all steps from idea to conclusion.
When developing a measurement system, the first step is to determine what to measure. This is often straightforward, as the choice of variables is likely to be a natural consequence of the experimental idea. As previously mentioned, we should strive to use cause variables rather than control variables, as they make it easier to explain our results. We also need to form an idea of how to steer clear of background variables. In the last chapter we used the Ishikawa diagram to identify cause variables. As this diagram points to several variables that may influence the result it is useful also for identifying potential background variables in an experiment. The final purpose of identifying them is to develop strategies for avoiding their influence.
Example 11.1: During the early dung beetle experiments described in Chapter 10, the arena was a three-meter wide, circular area of flattened and leveled sand, enclosed within a circular cloth wall. The beetles were filmed using a video camera suspended from a wooden gantry above the center of the arena. During nighttime experiments the camera used a “Night Shot” facility, filming the arena in infrared light. A new setup had to be developed for the planetarium experiment. This was partly because the space available under the planetarium dome was limited, but also because the beetles could potentially use the camera stand as a landmark for orientation. The team had to develop a new method that did not involve a camera.
They constructed a two-meter wide, circular wooden arena that would completely eliminate the potential influence of cameras or other objects that could serve as landmarks. The beetles were to see nothing but the planetarium dome during the experiments. To achieve this, the arena was elevated one meter to allow the experimenter to sit beneath it. A small, circular trap door at the center of the arena could be removed from below to admit the beetle and its ball to the surface. The door was then inserted back into its original position in the floor of the arena, from where the beetle could begin to roll.
Instead of filming, the team assessed the straightness of the beetle's rolling path by measuring the rolling time. A timer was started when the beetle left the center of the arena. It was stopped at the sound produced when the ball fell over the edge into a collection trough located around the perimeter of the arena. With this measurement system the team could distinguish between situations where the beetle could orient itself and where it could not. A beetle would typically complete a perfectly straight rolling path in 20 seconds, while a convoluted path could exceed five minutes in duration.![]()
Another important property of a measurement system is that it must be practically useful. This may lead to trade-offs, as resources are always limited. If the measurements become too complicated, this may limit the amount of data that you can collect. On the other hand, the research task dictates the amount of data that you must collect to draw meaningful conclusions. As a result you may have to choose a simplified measurement strategy to achieve your goal. Let us use a simple example to discuss why simplifications do not necessarily decrease the quality of our conclusions.
As discussed in Chapter 4, researchers are frequently more interested in patterns and regularities than absolute units. An hypothesis could, for instance, suggest that lack of a certain enzyme causes a certain disease. This hypothesis would be discredited if a relevant set of data did not show any correlation between the level of the enzyme and the symptoms of the disease. Neither of these two variables would have to be measured in absolute units to draw the conclusion so long as the trends in the data were reliable enough to calculate the correlation (see the section on correlation in Chapter 8). You could have access to a measurement technique that yields the enzyme concentration in relative units. Turning them into absolute concentrations may require a substantial effort and, since absolute units are not needed to test the hypothesis, this effort would provide no additional value to your experiment.
Another practical aspect of measurements is that they often disturb the state of the measurement object to some degree. When measuring a temperature, for example, the thermometer must be in thermal equilibrium with the measurement object to provide a correct reading. This means that heat is transferred between the two and that the temperature is affected. The effect will be small if we measure the water temperature in the ocean, but substantial if we measure in a test tube. If we wish to measure the temperature in a flame by putting a thermometer into it we will disturb the flow in addition to cooling it. It is simply not the same flame with a thermometer in it. There are parallels to these scenarios in most measurement situations. To measure is to affect. In order to obtain representative data it is important to find ways to minimize this disturbance.
To develop a reliable measurement system we need to attend to the whole measurement chain. Information is fed into the measurement system and is transformed in various ways before it comes out as data. This information flow was exemplified above with the levers and springs of a bathroom scale, but a measurement chain – short or long – exists in every measurement situation. Even when measuring something as simple as the length of a rope a number of influences affect the result. The method for aligning the rope with the measuring tape is one, the method for reading the tape is another, and the expansion of the tape with temperature is yet another. A measurement can be seen as a process where each step contributes to the error. One way to identify the parts that are most critical to the reliability is to make an Ishikawa diagram. This diagram will be different from the one drawn in the last chapter because it focuses only on the measurement process. As the measurement represents a flow of information from input to output, the arrows of the diagram can be added from left to right in the order that the influences appear in the process. It helps to think in terms of the “5 Ms” when searching for all the relevant influences (man, machine, method, material, and measurement). Do not forget to consider environmental factors too.
Figure 11.3 Ishikawa diagram of the measurement system for the beetle experiment.
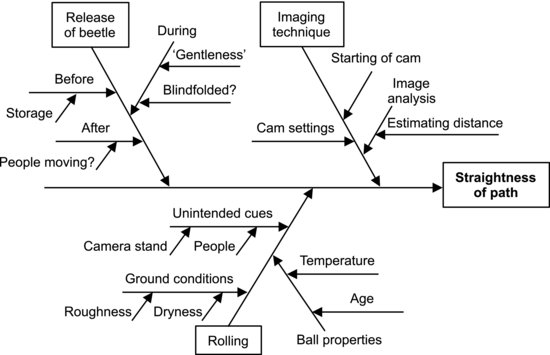
Example 11.2: A measurement on the sand arena consisted in releasing a dung beetle and capturing how it rolled its ball on film. Some influences on the outcome of this measurement chain are summarized in the Ishikawa diagram in Figure 11.3. We see that a number of practical considerations are necessary to avoid systematic and random errors. It is, for instance, important to handle the beetles in the same way during each measurement. Their performance could be affected if they are allowed visual cues before release, compared to if they are kept in a dark place (“blindfolded”) or if the gentleness of the release varies.![]()
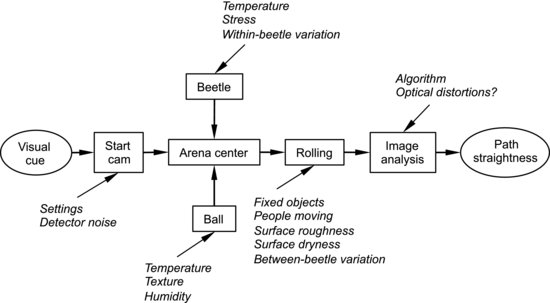
When the potential influences have been identified it is time to consider each influence in closer detail. It is convenient to document them in a process diagram. Close your eyes and visualize the steps through which the input is turned into an output in the measurement chain. List influences from all parts of the measurement system that add to the uncertainty in each step, including the operator, the measurement object and the environment. They may result in both systematic and random error. After taking this mental walk through the measurement process, take a sheet of paper and draw the process diagram. A process diagram based on the Ishikawa diagram above is shown in Figure 11.4, where oblique arrows indicate sources of uncertainty.
Figure 11.4 Process diagram based on the Ishikawa diagram in Figure 11.3.
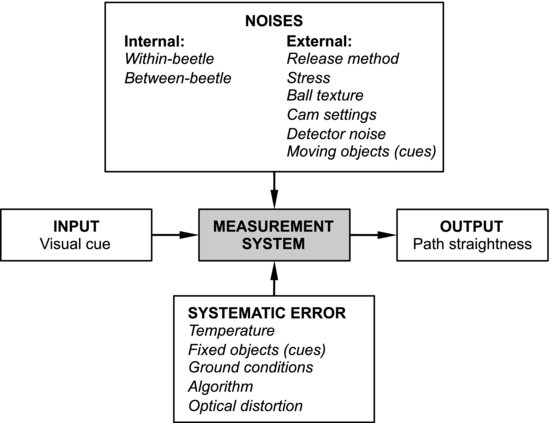
The purpose of making these diagrams is to identify as many potential sources of uncertainty as possible. As a final step it is useful to summarize and categorize these sources according to how they can be handled. This will be done in what we will call an input–output diagram. At first sight we may think that the measurement process only has one input and one output, but looking at the process diagram we realize that this is not quite true. The output is the information that you obtain from your measurements. In the beetle experiment this is the straightness of the path and in the diesel engine experiment (Experiment 2 in the last chapter) it is the lift-off length. The inputs, on the other hand, can be divided into three different categories. Hopefully, the treatment that you as experimenter exert on the system under study is the most important input, but background factors and noises also affect the output. Background factors lead to systematic errors and noises decrease the measurement precision. The noises can, in turn, be divided into internal and external noises. The internal noises arise from the measurement object itself. In the beetle experiment, for example, repeated measurements on a single beetle will give slightly different rolling times even at fixed conditions. There may also be differences between the beetles. This could seem like a systematic error but it will appear as noise in the measurements, at least if differences between the individuals are not assessed before the experiment. External noises arise outside the measurement object. They could be due to varying environmental conditions or to the operator failing to repeat settings exactly when a measurement is replicated. Figure 11.5 shows an input–output diagram based on the process diagram in Figure 11.4. The measurement system is represented by a box at the center; the inputs and output are connected to it by arrows.
Figure 11.5 Input–output diagram for the beetle experiment, listing the error sources by category.
Using this diagram we can now formulate countermeasures to avoid or at least decrease the effects of the undesired influences. Systematic errors are often handled by calibration or other types of corrections. Randomization is another common method to mitigate their influence, especially for influences that cannot be corrected for. Since noises are random influences it is not possible to correct for them but they can often be decreased. External noises can be decreased for example by isolating the experimental setup from environmental influences, such as vibrations and temperature fluctuations. If the measurement procedure is found to be a source of noise it can be amended by defining the measurement procedure more strictly and making sure that the operator adheres to it. Automation is another common method, since computers or machines tend to perform repetitive operations more consistently than humans. It is more difficult to decrease the influence of internal noises. Often, the only thing to do is to quantify them.
In some research fields, noisy signals are filtered. The interesting variations in a signal may occur over a longer timescale than the noise. Removing higher frequencies may then decrease the noise and make further analysis possible. In such cases it is important to filter with care in order not to lose useful information.
Example 11.3: In the beetle experiment, the research team suspected that the rolling speed depended on the temperature of both the beetle and the dung ball. The velocity was expected to increase at higher temperature. To obtain a quantitative relationship describing this influence, beetles and balls were warmed to temperatures in the range 17–25°C in a steam-bath chamber before timing the straight rolling trajectories in open conditions with all available cues. This relationship was used to avoid systematic errors in the actual experiments. The temperatures of the air and ball were measured in the field to correct the rolling durations.![]()
Example 11.4: Vibrations were an important external noise factor in Experiment 2 in the preceding chapter (the diesel engine experiment). The lift-off length was measured as the distance between the injector and the flames on the fuel sprays. It was therefore essential to know the precise location of the injector in each movie frame. Two problems needed to be solved. Firstly, the engine was moving during a combustion cycle, leading to slight changes in the injector position in the images. Secondly, the injector was not directly visible. A specific tracking algorithm was therefore developed to indirectly locate the injector in each movie frame. It used the fact that the four fuel sprays were visible close to the injector. Their positions were determined by tracking the signal level along a circle drawn around the center of the image. The brightness peaked at four angular locations on the circle. These locations provided four coordinates, and the intersecting point between them was the actual nozzle position.![]()