
Chapter 6. Polyesters
6.1. Background
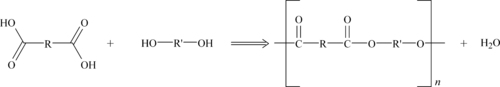
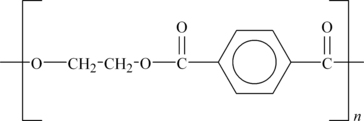
Polyesters are formed by a condensation reaction that is very similar to the reaction used to make polyamide or nylons. A diacid and dialcohol are reacted to form the polyester with the elimination of water as shown in Figure 6.1.
While the actual commercial route to making the polyesters may be more involved, the end result is the same polymeric structure. The diacid is usually aromatic. Polyester resins can be formulated to be brittle and hard, tough and resilient, or soft and flexible. In combination with reinforcements such as glass fibers, they offer outstanding strength, a high strength-to-weight ratio, chemical resistance, and other excellent mechanical properties. The three dominant materials in this plastics family are polycarbonate (PC), PET, and polybutylene terephthalate (PBT). Thermoplastic polyesters are similar in properties to Nylon 6 and Nylon 66, but have lower water absorption and higher dimensional stability than the nylons.
6.1.1. Polycarbonate
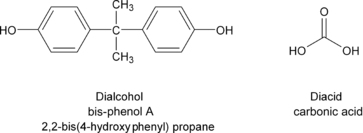
Theoretically, PC is formed from the reaction of bis-phenol A and carbonic acid. The structures of these two monomers are given in Figure 6.2.
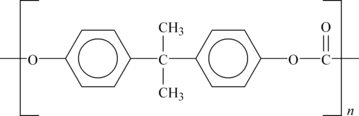
Commercially, different routes are used, but the PC polymer of the structure shown in Figure 6.3 is the result.
Polycarbonate performance properties include:
• Very impact resistant and is virtually unbreakable and remains tough at low temperatures
• “Clear as glass” clarity
• High heat resistance
• Dimensional stability
• Resistant to UV light, allowing exterior use
• Flame retardant properties
6.1.2. Polybutylene Terephthalate
PBT is a semi-crystalline, white or off-white polyester similar in both composition and properties to PET. It has somewhat lower strength and stiffness than PET, is a little softer but has higher impact strength and similar chemical resistance. As it crystallizes more rapidly than PET, it tends to be preferred for industrial scale molding. Its structure is shown in Figure 6.4.
PBT performance properties include:
• High mechanical properties
• High thermal properties
• Good electrical properties
• Dimensional stability
• Excellent chemical resistance
• Flame retardancy
6.1.3. Polyethylene Terephthalate
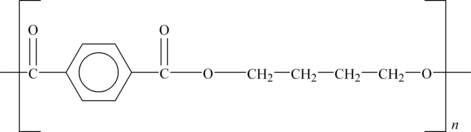
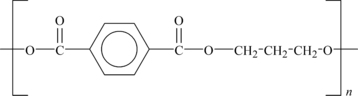
PET polyester is the most common thermoplastic polyester and is often called just “polyester”. This often causes confusion with the other polyesters in this chapter. PET exists both as an amorphous (transparent) and as a semi-crystalline (opaque and white) thermoplastic material. The semi-crystalline PET has good strength, ductility, stiffness, and hardness. The amorphous PET has better ductility but less stiffness and hardness.
It absorbs very little water. Its structure is shown in Figure 6.5.
PET has good barrier properties against oxygen and carbon dioxide. Therefore, it is utilized in bottles for mineral water. Other applications include food trays for oven use, roasting bags, audio/video tapes as well as mechanical components.
6.1.4. Liquid Crystalline Polymers
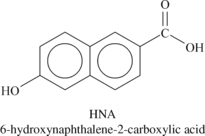
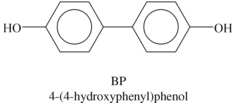
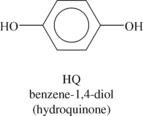
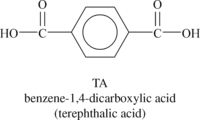
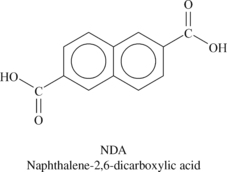
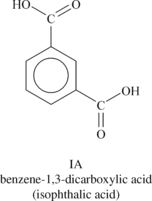
Liquid crystalline polymers (LCP) are a relatively unique class of partially crystalline aromatic polyesters based on 4-hydroxybenzoic acid and related monomers shown in Figure 6.6. Liquid crystal polymers are capable of forming regions of highly ordered structure while in the liquid phase. However, the degree of order is somewhat less than that of a regular solid crystal. Typically, LCPs have outstanding mechanical properties at high temperatures, excellent chemical resistance, inherent flame retardancy and good weatherability. Liquid crystal polymers come in a variety of forms from sinterable high temperature to injection moldable compounds.

LCPs are exceptionally inert. They resist stress cracking in the presence of most chemicals at elevated temperatures, including aromatic or halogenated hydrocarbons, strong acids, bases, ketones, and other aggressive industrial substances. Hydrolytic stability in boiling water is excellent. Environments that deteriorate these polymers are high-temperature steam, concentrated sulfuric acid, and boiling caustic materials.
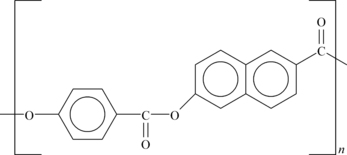
As an example, the structure of Ticona Vectra® A950 LCP is shown in Figure 6.7.
6.1.5. Polycyclohexylene-dimethylene Terephthalate
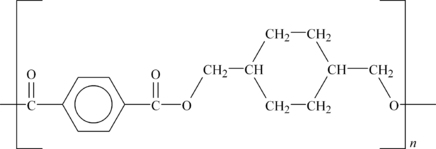
Polycyclohexylene-dimethylene terephthalate (PCT) is a high-temperature polyester that possesses the chemical resistance, processability, and dimensional stability of polyesters PET and PBT. However, the aliphatic cyclic ring shown in Figure 6.8 imparts added heat resistance. This puts it between the common polyesters and the LCP polyesters described in the previous section. At this time only DuPont makes this plastic under the trade name Thermx®.
This material has found use in automotive, electrical, and housewares applications.
6.1.6. Polyphthalate Carbonate
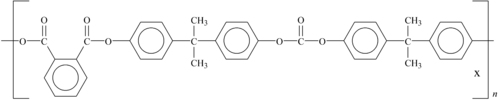
Amorphous polyphthalate carbonate copolymer (PPC) is another high-temperature PC. It provides excellent impact resistance, optical clarity, and abrasion resistance. The plastic offers UV protection as well. It is lightweight, impact-resistant, and can be reused after multiple exposures to sterilization. Its structure is shown in Figure 6.9.
6.1.7. Polytrimethylene Terephthalate
Polytrimethylene terephthalate (PTT) is a semi-crystalline polyester polymer that has many of the same property advantages as PBT and PET. However, compared to PBT, compounds composed of PTT exhibit better tensile strengths, flexural strengths, and stiffness. They also have excellent flow and surface finish. PTT can also be more cost-effective than PBT. PTT may have more uniform shrinkage and better dimensional stability in some applications. PTT, like PBT, has excellent resistance to a broad range of chemicals at room temperature, including aliphatic hydrocarbons, gasoline, carbon tetrachloride, perchloroethylene, oils, fats, alcohols, glycols, esters, ethers, and dilute acids and bases. Strong bases may attack PTT and many polyester resins.
The two monomer units used in producing this polymer are 1,3-propanediol and terephthalic acid and its structure is shown in Figure 6.10.
6.2. Polycarbonate
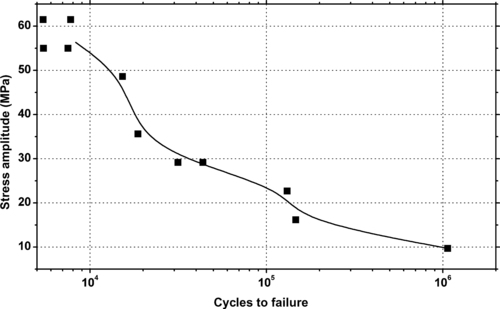
6.2.1. Fatigue Data
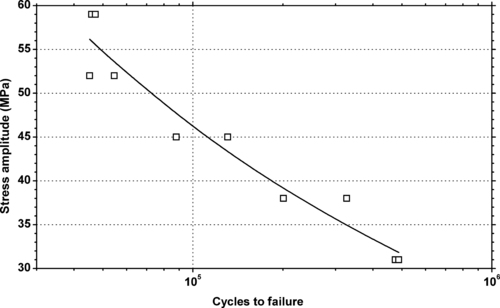 |
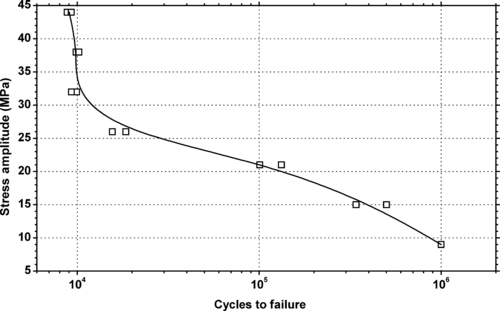
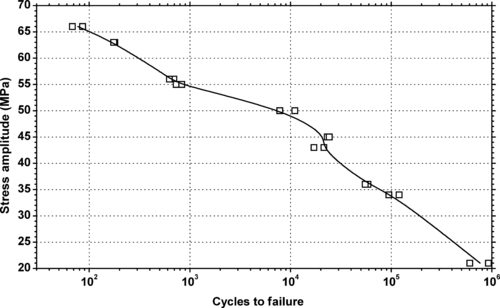
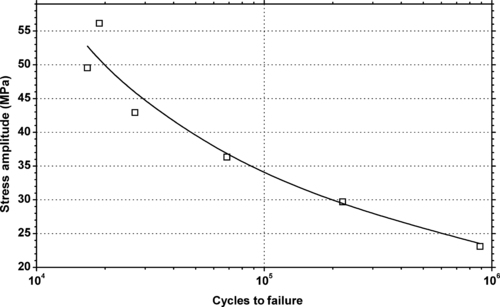
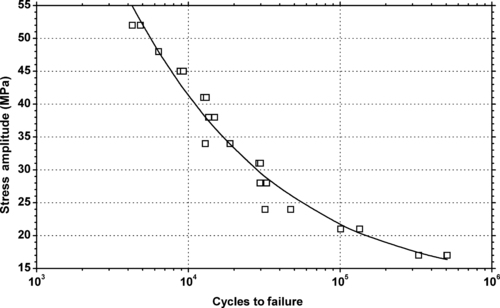
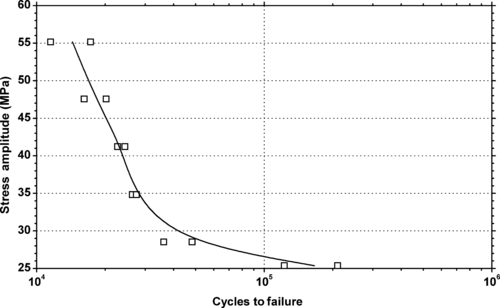
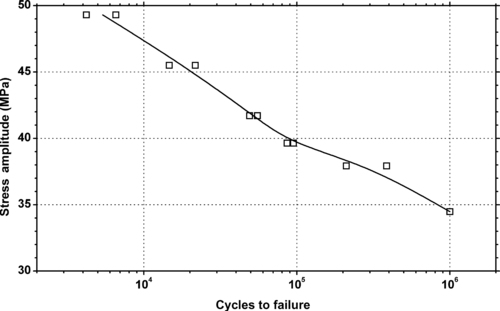
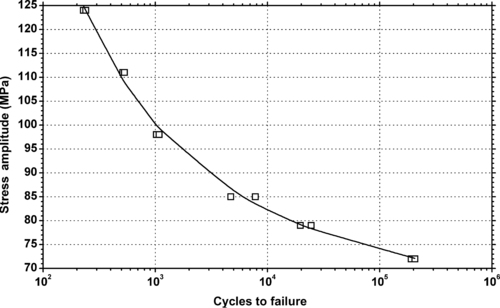
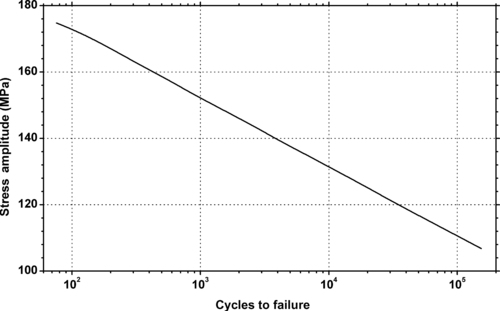
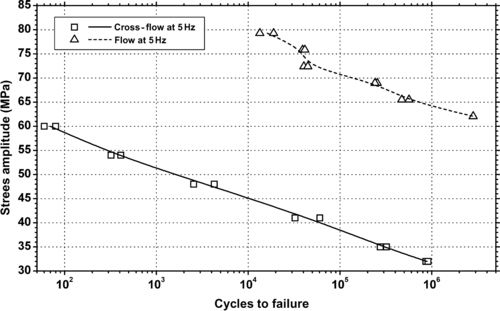
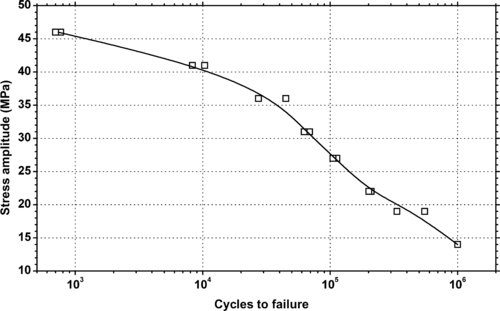
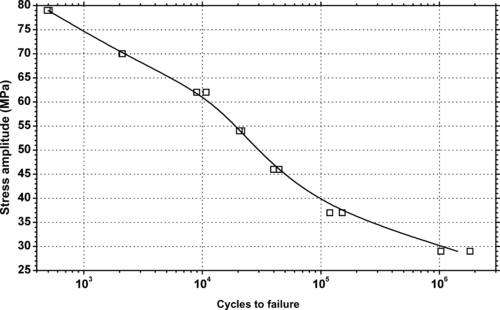
| Figure 6.11. |
| Tensile stress amplitude vs. cycles to failure of SABIC Innovative Plastics Lexan® 101—unreinforced, high viscosity, general-purpose extrusion PC. |
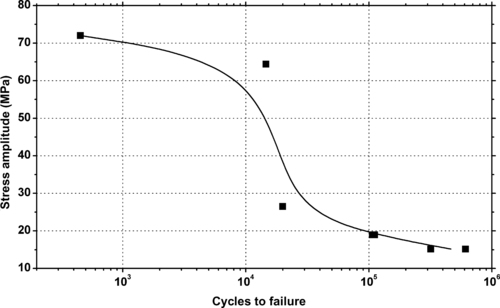
 |
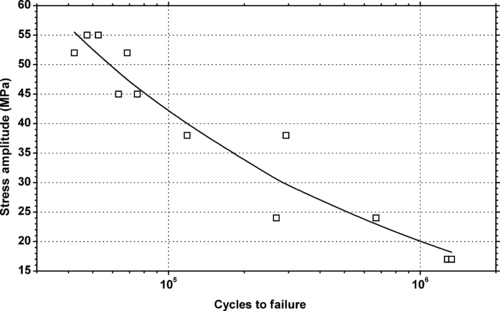
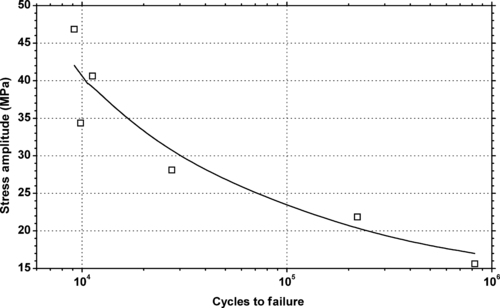
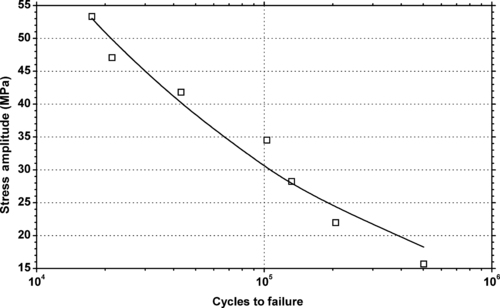
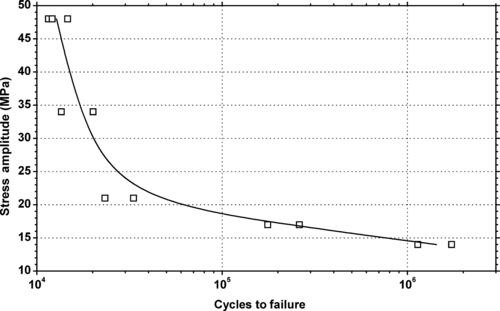
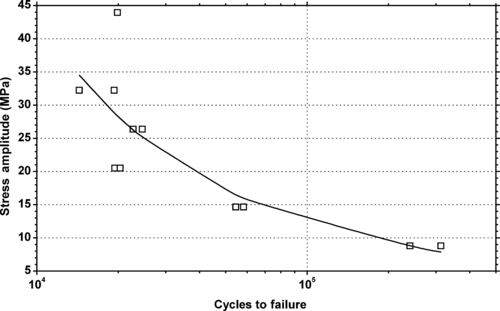
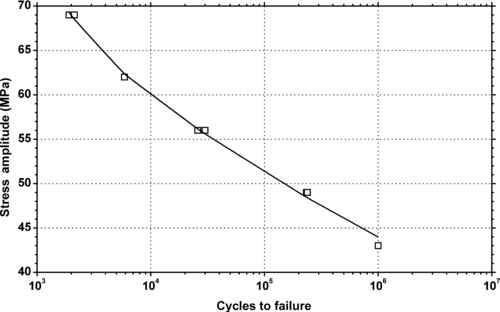
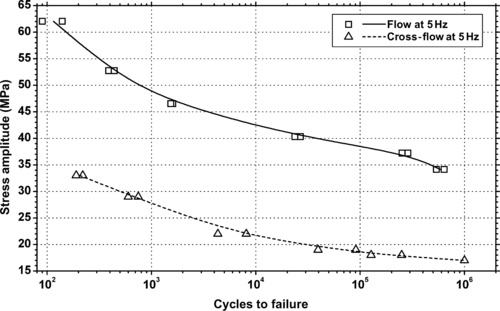
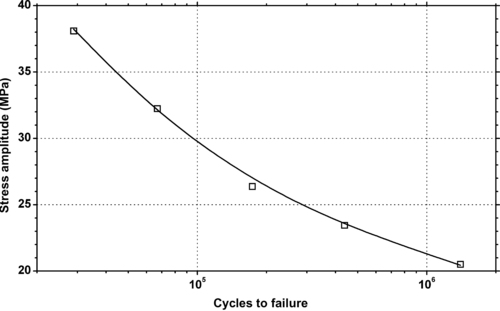
| Figure 6.12. |
| Tensile stress amplitude vs. cycles to failure of SABIC Innovative Plastics Lexan® 121—unreinforced, low viscosity, general-purpose PC. |
 |
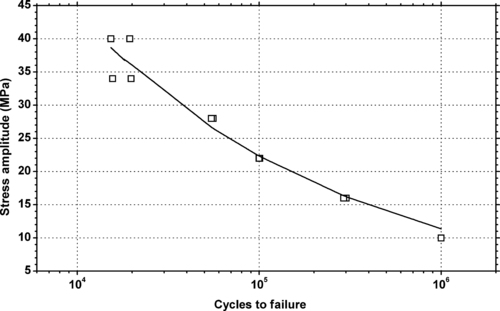
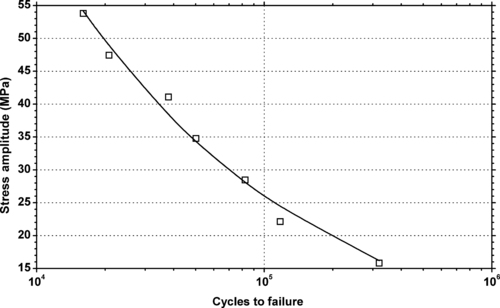
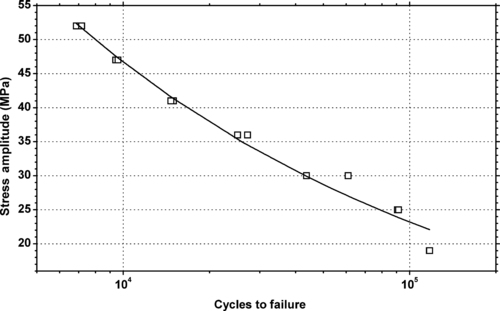
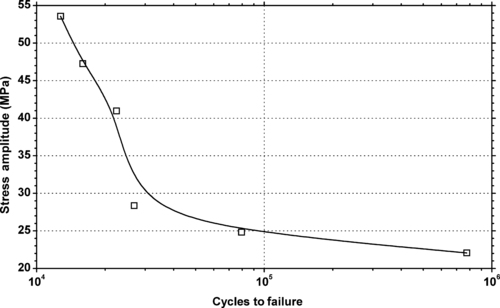
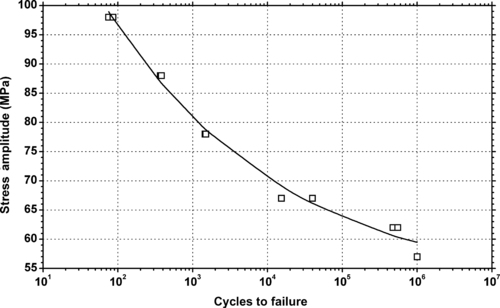
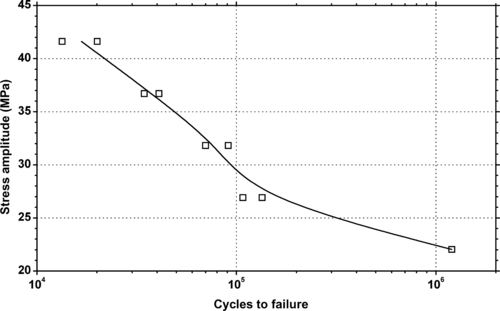
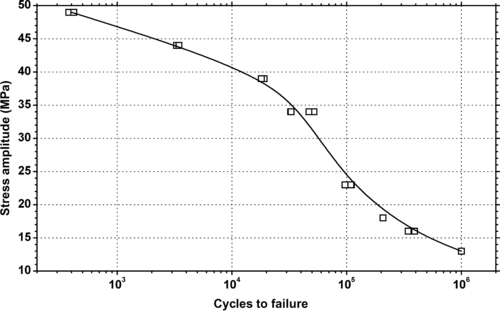
| Figure 6.13. |
| Tensile stress amplitude vs. cycles to failure of SABIC Innovative Plastics Lexan® 141—unreinforced, low–medium viscosity, general-purpose PC. |
 |
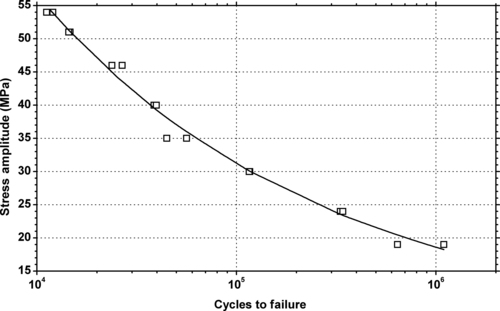
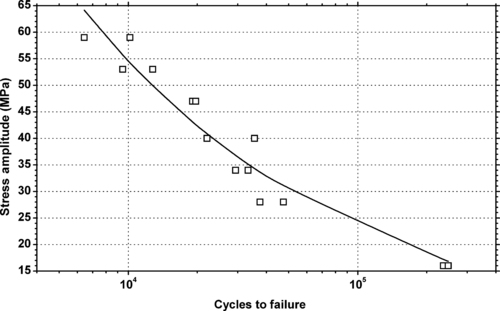
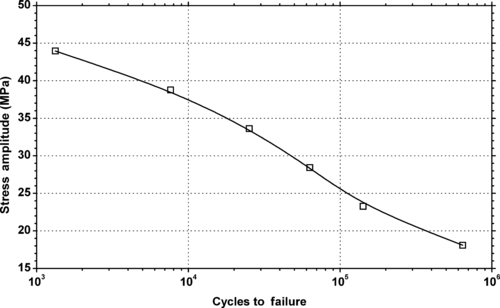
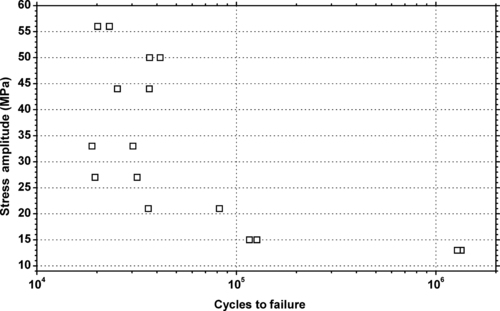
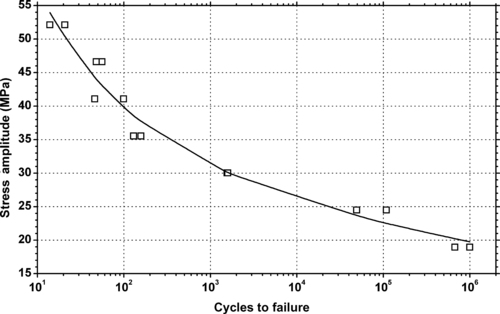
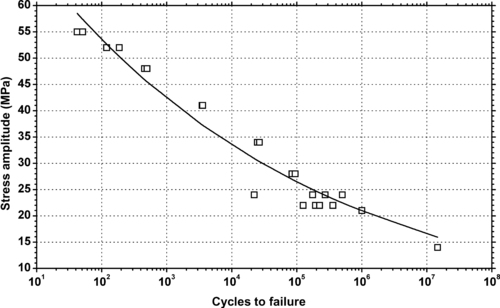
| Figure 6.14. |
| Tensile stress amplitude vs. cycles to failure of SABIC Innovative Plastics Lexan® 143R—unreinforced, low–medium viscosity, UV stabilized general-purpose PC. |
 |
| Figure 6.15. |
| Tensile stress amplitude vs. cycles to failure of SABIC Innovative Plastics Lexan® 191—high impact PC. |
 |
| Figure 6.16. |
| Tensile stress amplitude vs. cycles to failure of SABIC Innovative Plastics Lexan® 500—10% glass fiber reinforced PC. |
 |
| Figure 6.17. |
| Tensile stress amplitude vs. cycles to failure of SABIC Innovative Plastics Lexan® 915R—unreinforced, flame retardant, easy release reinforced PC. |
 |
| Figure 6.18. |
| Tensile stress amplitude vs. cycles to failure of SABIC Innovative Plastics Lexan® 920—low viscosity, unreinforced, flame retardant PC. |
 |
| Figure 6.19. |
| Tensile stress amplitude vs. cycles to failure of SABIC Innovative Plastics Lexan® 925—low viscosity, unreinforced, flame retardant, ECO conforming label grade PC. |
 |
| Figure 6.20. |
| Tensile stress amplitude vs. cycles to failure of SABIC Innovative Plastics Lexan® 940—medium viscosity, unreinforced, flame retardant, ECO conforming label grade PC. |
 |
| Figure 6.21. |
| Tensile stress amplitude vs. cycles to failure of SABIC Innovative Plastics Lexan® 945—low–medium viscosity, unreinforced, flame retardant, ECO conforming label grade PC. |
 |
| Figure 6.22. |
| Tensile stress amplitude vs. cycles to failure of SABIC Innovative Plastics Lexan® 955—medium viscosity, unreinforced, flame retardant, ECO conforming label grade PC. |
 |
| Figure 6.23. |
| Tensile stress amplitude vs. cycles to failure of SABIC Innovative Plastics Lexan® EM1210—automotive interiors, heat and impact-resistant PC. |
 |
| Figure 6.24. |
| Tensile stress amplitude vs. cycles to failure of SABIC Innovative Plastics Lexan® EM2212—automotive interiors, 10% glass-reinforced PC. |
 |
| Figure 6.25. |
| Tensile stress amplitude vs. cycles to failure of SABIC Innovative Plastics Lexan® EM3110—automotive interiors, optimized flow and processability for thinner wall uses PC. |
 |
| Figure 6.26. |
| Tensile stress amplitude vs. cycles to failure of SABIC Innovative Plastics Lexan® HF1110—high flow, heat-resistant PC. |
 |
| Figure 6.27. |
| Tensile stress amplitude vs. cycles to failure of SABIC Innovative Plastics Lexan® HF1130—high flow, UV stabilized, heat resistance PC. |
 |
| Figure 6.28. |
| Tensile stress amplitude vs. cycles to failure of SABIC Innovative Plastics Lexan® HF1140—high flow, FDA food compliant for disposable end-uses PC. |
 |
| Figure 6.29. |
| Tensile stress amplitude vs. cycles to failure of SABIC Innovative Plastics Lexan® LS1—automotive lens system, low-viscosity PC. |
 |
| Figure 6.30. |
| Tensile stress amplitude vs. cycles to failure of SABIC Innovative Plastics Lexan® OQ1030—optical quality for CD/DVD PC. |
6.2.2. Tribology Data
6.3. Polybutylene Terephthalate
6.3.1. Fatigue Data
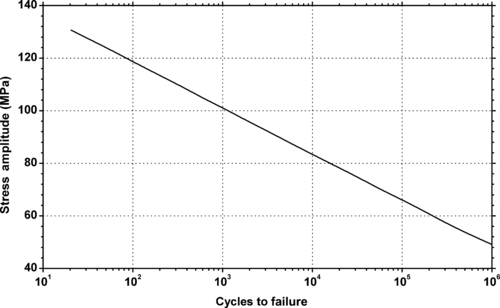 |
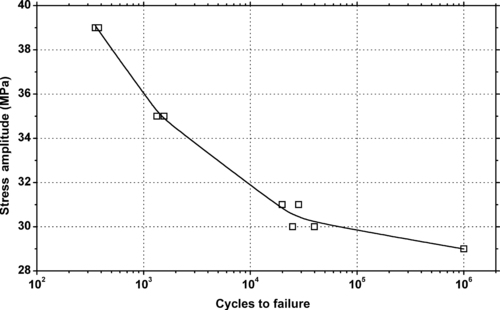
| Figure 6.34. |
| Stress amplitude vs. cycles to failure at 20°C and 50% relative humidity of DSM Arnite®—unreinforced PBT. |
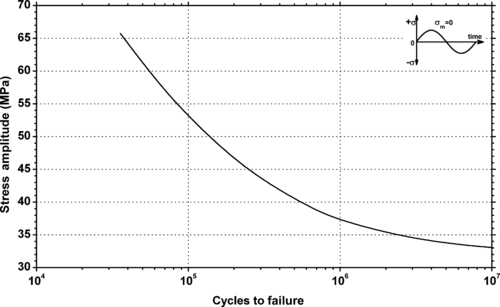 |
| Figure 6.35. |
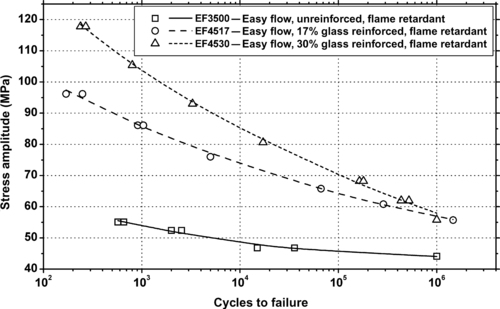
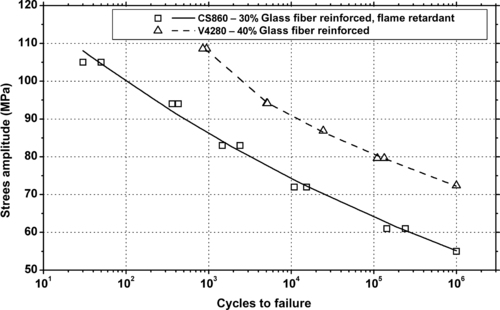
| Flexural stress amplitude vs. cycles to failure of Ticona Celanex® 2300 GV/30—general-purpose, 30% glass fiber reinforced PBT. |
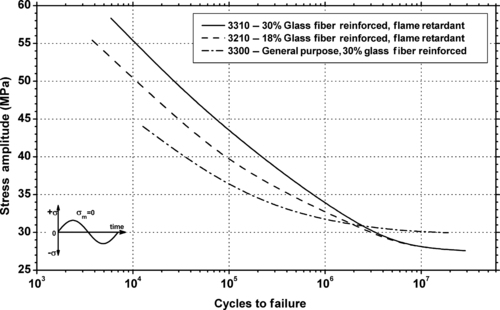 |
| Figure 6.36. |
| Flexural stress amplitude vs. cycles to failure of several Ticona Celanex® PBT plastics. |
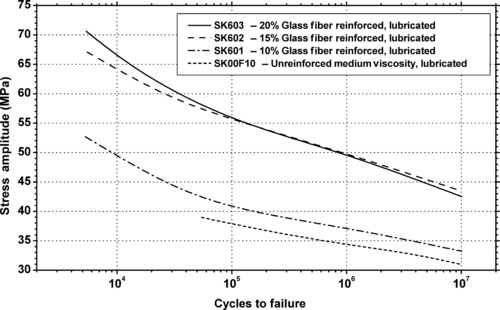 |
| Figure 6.37. |
| Flexural stress amplitude vs. cycles to failure at 23°C of several DuPont Engineering Polymers Crastin® PBT plastics. |
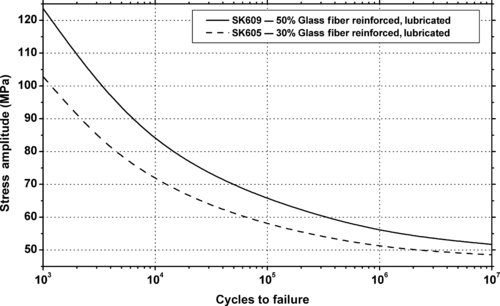 |
| Figure 6.38. |
| Flexural stress amplitude vs. cycles to failure at 23°C of several other DuPont Engineering Polymers Crastin® PBT plastics. |
 |
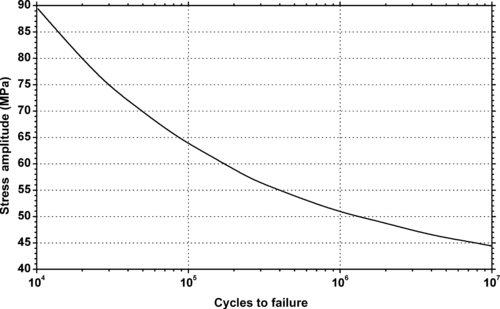
| Figure 6.39. |
| Flexural stress amplitude vs. cycles to failure at 23°C of DuPont Engineering Polymers Crastin® SK645FR—30% glass fiber reinforced, UL94 V-0 flame retardant PBT. |
 |
| Figure 6.40. |
| Flexural stress amplitude vs. cycles to failure at 23°C of SABIC Innovative Plastics LNP Stat-Kon® WC-4036—30% glass fiber reinforced PBT. |
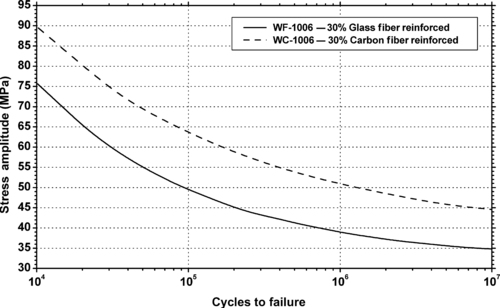 |
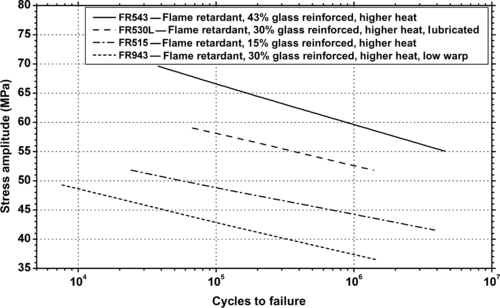
| Figure 6.41. |
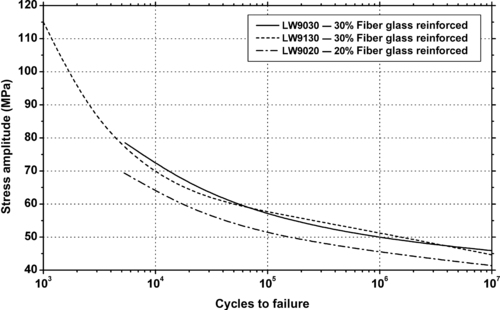
| Flexural stress amplitude vs. cycles to failure at 23°C of two SABIC Innovative Plastics LNP Thermocomp® fiber reinforced PBT plastics. |
 |
| Figure 6.42. |
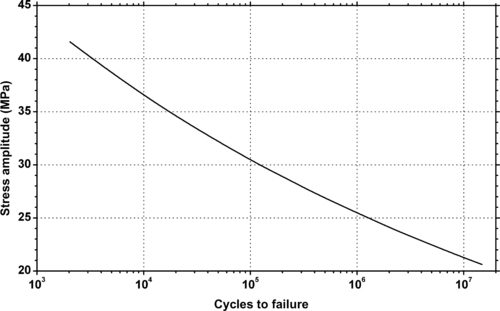
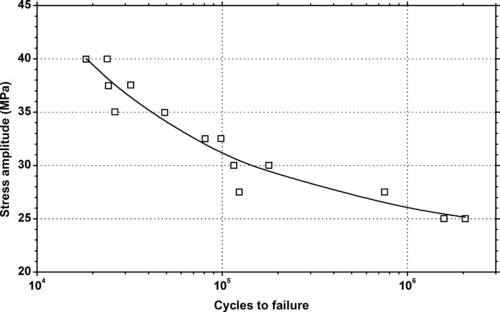
| Tensile stress amplitude vs. cycles to failure at 23°C of SABIC Innovative Plastics Valox® 310—unreinforced, general-purpose PBT. |
 |
| Figure 6.43. |
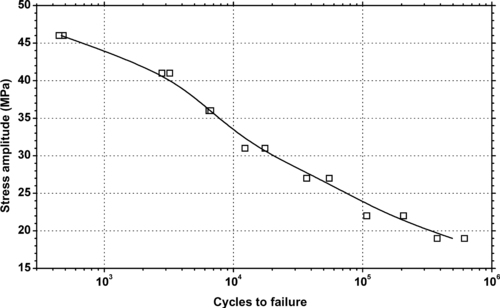
| Tensile stress amplitude vs. cycles to failure at 23°C of SABIC Innovative Plastics Valox® 337—unfilled, impact modified grade for low-temperature PBT. |
 |
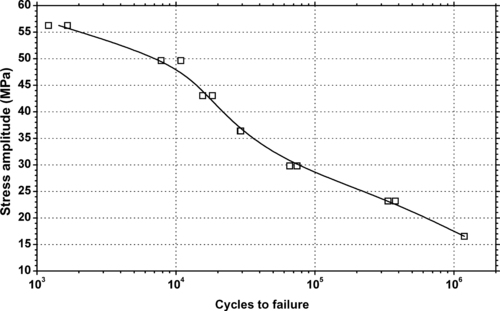
| Figure 6.44. |
| Tensile stress amplitude vs. cycles to failure at 23°C of SABIC Innovative Plastics Valox® 412E—20% glass fiber reinforced PBT. |
 |
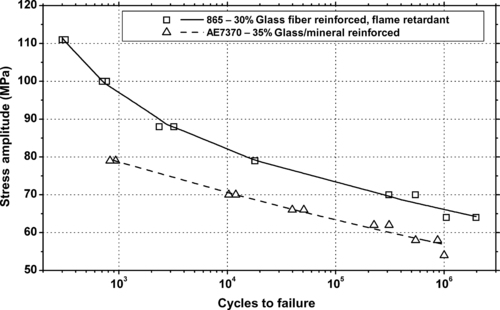
| Figure 6.45. |
| Tensile stress amplitude vs. cycles to failure at 23°C of SABIC Innovative Plastics Valox® 420—30% glass fiber reinforced, high heat PBT. |
 |
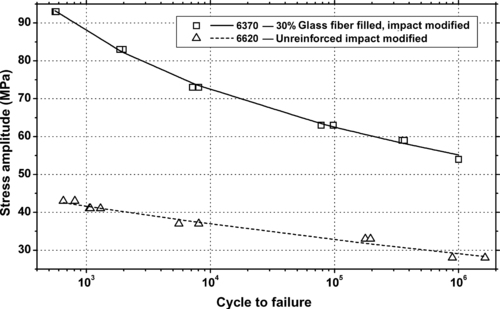
| Figure 6.46. |
| Tensile stress amplitude vs. cycles to failure at 23°C of SABIC Innovative Plastics Valox® 430—33% glass fiber reinforced, impact modified PBT. |
 |
| Figure 6.47. |
| Tensile stress amplitude vs. cycles to failure at 23°C of SABIC Innovative Plastics Valox® 732E—30% glass/mineral filled, thermal stabilized, low warpage, enhanced flow PBT. |
 |
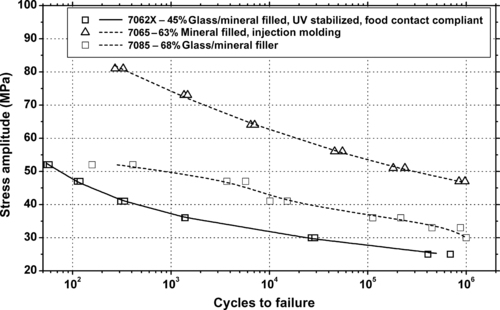
| Figure 6.48. |
| Tensile stress amplitude vs. cycles to failure at 23°C of SABIC Innovative Plastics Valox® 736—45% glass/mineral PBT. |

6.3.2. Tribology Data
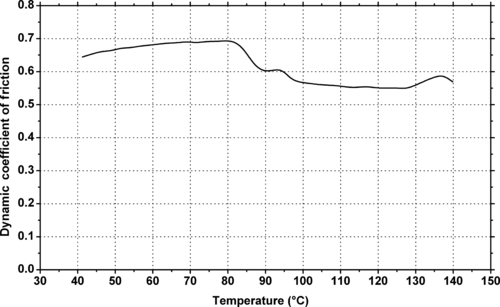
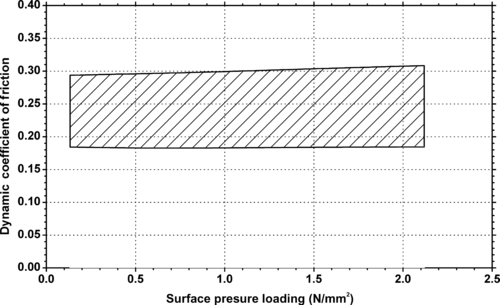 |
| Figure 6.51. |
| Dynamic coefficient of friction vs. pressure loading of Ticona Celanex® 2500—general purpose, nucleated, easy flow PBT (v = 10m/min, against steel with Rz = 2μm). |
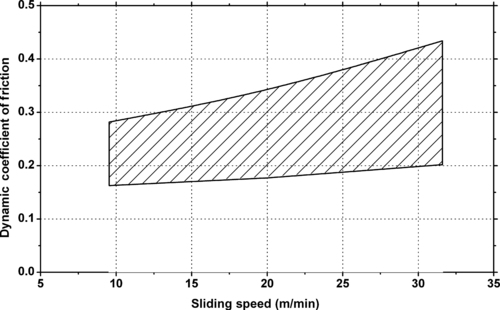 |
| Figure 6.52. |
| Dynamic coefficient of friction vs. sliding speed of Ticona Celanex® 2500—general purpose, nucleated, easy flow PBT (p = 1.25N/mm2, against steel with Rz = 2μm). |
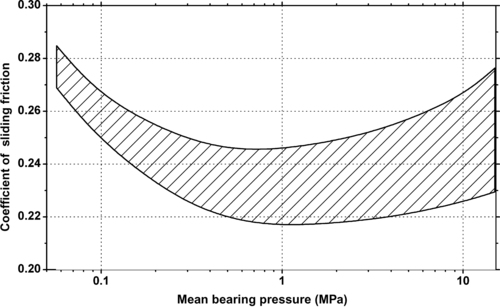 |
| Figure 6.53. |
| Range of sliding coefficient of friction vs. pressure of Evonik Industries Vestodur® 2000—unreinforced, medium viscosity PBT (v = 0.5m/s). |
6.4. Polyethylene Terephthalate
6.4.1. Fatigue Data
 |
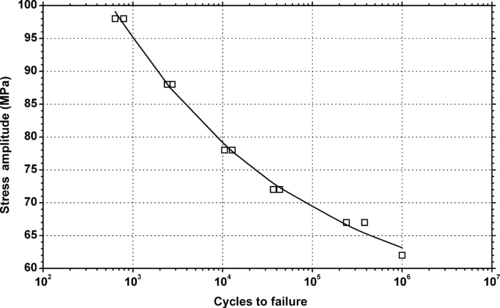
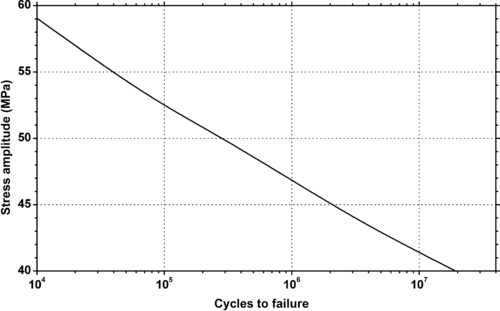
| Figure 6.54. |
| Stress amplitude vs. cycles to failure at 20°C and 50% relative humidity of DSM Arnite®—35% glass fiber reinforced PET. |
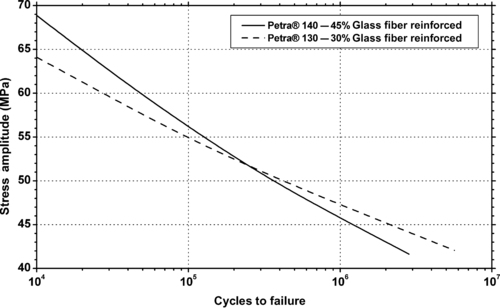 |
| Figure 6.55. |
| Flexural stress amplitude vs. cycles to failure of two BASF Petra®—glass fiber reinforced PET plastics. |
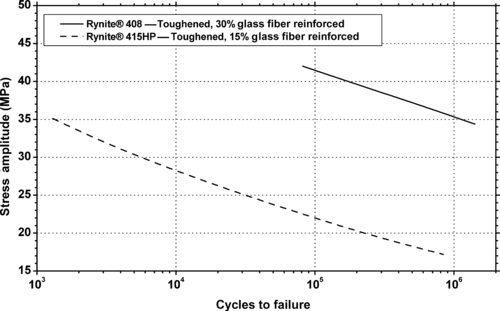 |
| Figure 6.56. |
| Flexural stress amplitude vs. cycles to failure at 23°C of two DuPont Engineering Polymers Rynite® PET plastics. |
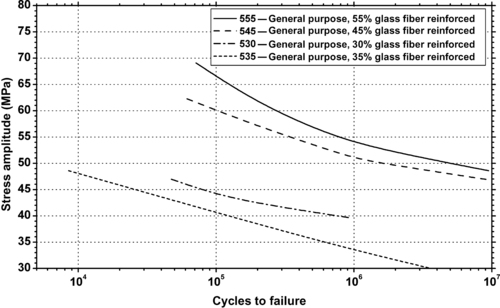 |
| Figure 6.57. |
| Flexural stress amplitude vs. cycles to failure of several DuPont Engineering Polymers Rynite® 500 Series—general purpose, glass fiber reinforced PET plastics. |
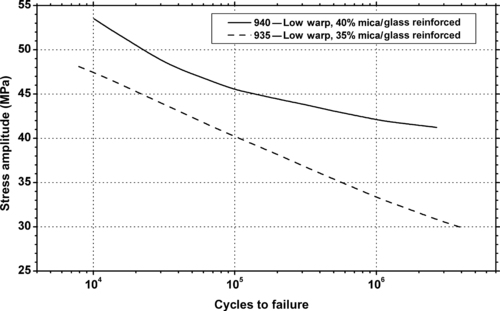 |
| Figure 6.58. |
| Flexural stress amplitude vs. cycles to failure of two DuPont Engineering Polymers Rynite® 900 Series—low warp, mica/glass fiber reinforced PET plastics. |
6.4.2. Tribology Data
6.5. Liquid Crystal Polymer
6.5.1. Fatigue Data
6.5.2. Tribology Data
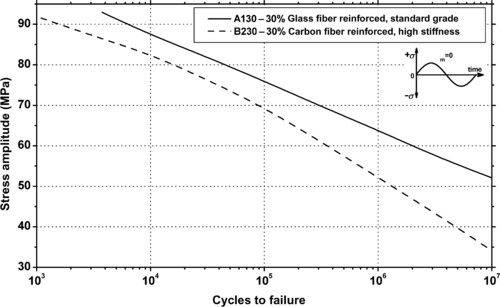
Ticona Vectra® A130—30% Glass fiber reinforced, standard grade LCP
Ticona Vectra® A230—30% Carbon fiber reinforced, high-stiffness LCP
Ticona Vectra® A530—30% Mineral-filled LCP
Ticona Vectra® A430—PTFE modified, standard grade LCP
Ticona Vectra® A435—Glass/PTFE-filled LCP
Ticona Vectra® A625—25% Graphite-filled LCP
Ticona Vectra® B130—30% Glass fiber reinforced, high-stiffness LCP
Ticona Vectra® B230—30% Carbon fiber reinforced, high-stiffness LCP
Ticona Vectra® C130—30% Glass fiber reinforced, heat resistant LCP
Ticona Vectra® L130—30% Glass fiber reinforced, high flow LCP
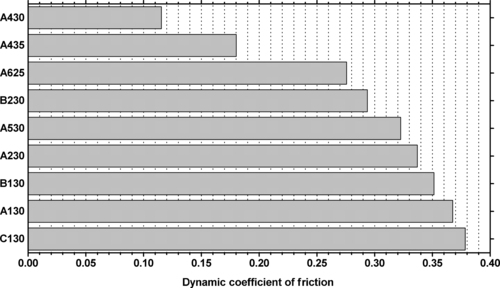 |
| Figure 6.63. |
| Dynamic coefficient of friction for various Ticona Vectra® LCP resins (P = 6N, v = 60cm/min). |
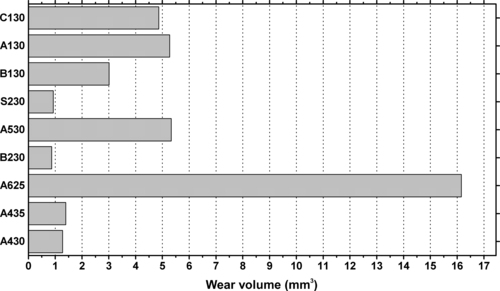 |
| Figure 6.64. |
| Wear volumes after 60 hours of testing for various Ticona Vectra® LCP resins (P = 3N, v = 136m/min). |
6.6. Polyphthalate Carbonate
6.7. Polycyclohexylene-Dimethylene Terephthalate
6.8. Polyester Blends and Alloys
6.8.1. Fatigue Data
 |
| Figure 6.68. |
| Flexural stress amplitude vs. cycles to failure at 23°C of several DuPont Engineering Polymers Crastin®—injection molding PBT/ASA Alloy plastics. |
 |
| Figure 6.69. |
| Tensile stress amplitude vs. cycles to failure at 23°C of SABIC Innovative Plastics Xenoy® CL101—automotive exterior PC/PBT Alloy. |
 |
| Figure 6.70. |
| Tensile stress amplitude vs. cycles to failure at 23°C of SABIC Innovative Plastics Valox® 368—flame retardant, impact modified, mold release PBT/PC Alloy. |
 |
| Figure 6.71. |
| Tensile stress amplitude vs. cycles to failure at 23°C of SABIC Innovative Plastics Valox® 508—30% glass fiber reinforced PBT/PC Alloy. |
 |
| Figure 6.72. |
| Tensile stress amplitude vs. cycles to failure at 82°C of SABIC Innovative Plastics Valox® 508—30% glass fiber reinforced PBT/PC Alloy. |
 |
| Figure 6.73. |
| Tensile stress amplitude vs. cycles to failure at 23°C of SABIC Innovative Plastics Valox® 3706—impact modified PBT/PC Alloy. |
 |
| Figure 6.74. |
| Tensile stress amplitude vs. cycles to failure at 23°C of SABIC Innovative Plastics Xenoy® K4630—17% glass fiber reinforced PC/PBT Alloy. |
 |
| Figure 6.75. |
| Tensile stress amplitude vs. cycles to failure at 23°C of SABIC Innovative Plastics Xenoy® 1102—unreinforced PBT/PC Alloy. |
 |
| Figure 6.76. |
| Tensile stress amplitude vs. cycles to failure at 23°C of SABIC Innovative Plastics Xenoy® 1103—unreinforced, impact modified PBT/PC Alloy. |
 |
| Figure 6.77. |
| Tensile stress amplitude vs. cycles to failure at 23°C of SABIC Innovative Plastics Xenoy® 1402B—blowmoldable, unreinforced PBT/PC Alloy. |
 |
| Figure 6.78. |
| Tensile stress amplitude vs. cycles to failure at 23°C of SABIC Innovative Plastics Xenoy® 1403B—PBT/PC Alloy. |
 |
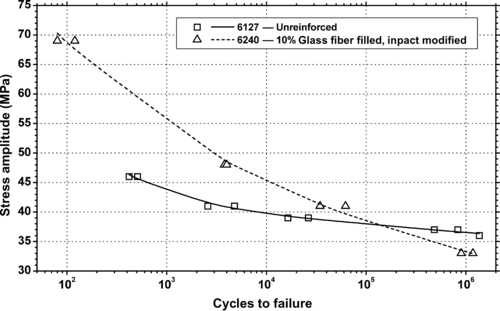
| Figure 6.79. |
| Tensile stress amplitude vs. cycles to failure at 23°C of two SABIC Innovative Plastics Xenoy®—PBT/PC Alloys. |
 |
| Figure 6.80. |
| Tensile stress amplitude vs. cycles to failure at 23°C of SABIC Innovative Plastics Xenoy® 1760E—high flow, 11% glass-filled PBT/PC Alloy. |
 |
| Figure 6.81. |
| Tensile stress amplitude vs. cycles to failure at 23°C of two SABIC Innovative Plastics Xenoy® 52xx series PBT/PC Alloys. |
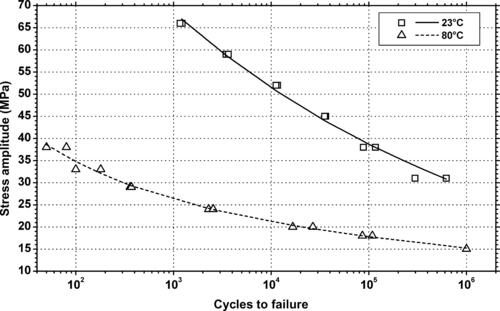 |
| Figure 6.82. |
| Tensile stress amplitude vs. cycles to failure at two temperatures of SABIC Innovative Plastics Xenoy® 5770—20% glass fiber/mineral filled, impact modified PBT/PC Alloy. |
 |
| Figure 6.83. |
| Tensile stress amplitude vs. cycles to failure at 23°C of two SABIC Innovative Plastics Xenoy® 5xxx series PBT/PC Alloys. |
 |
| Figure 6.84. |
| Tensile stress amplitude vs. cycles to failure at 23°C of two other SABIC Innovative Plastics Xenoy® 5xxx series PBT/PC Alloys. |
 |
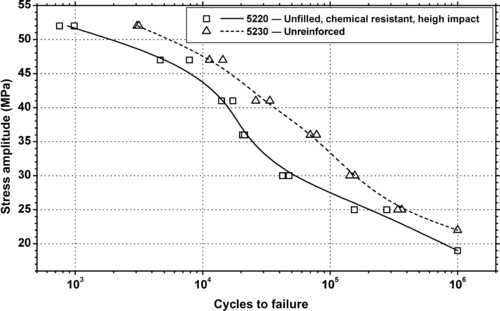
| Figure 6.85. |
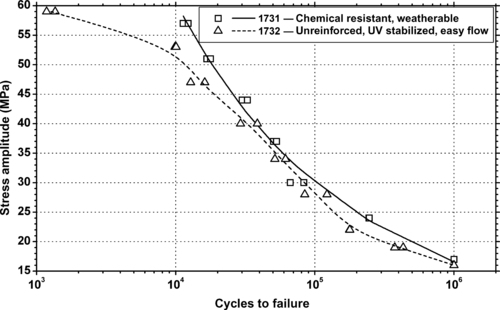
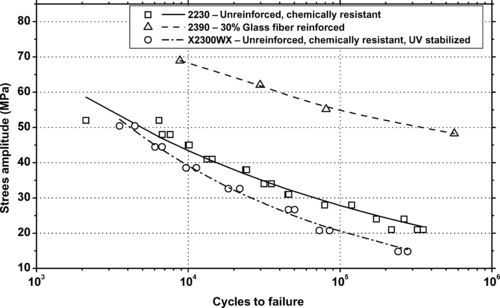
| Tensile stress amplitude vs. cycles to failure at two temperatures of SABIC Innovative Plastics Xenoy® X5300WX—unreinforced, chemically resistant, UV stabilized PBT/PC Alloy. |
 |
| Figure 6.86. |
| Tensile stress amplitude vs. cycles to failure at 23°C of several SABIC Innovative Plastics Enduran® PET/PBT Alloy plastics. |
 |
| Figure 6.87. |
| Tensile stress amplitude vs. cycles to failure at 23°C of two SABIC Innovative Plastics Valox® PET/PBT Alloy plastics. |
..................Content has been hidden....................
You can't read the all page of ebook, please click here login for view all page.