
Chapter 7. Polyimides
7.1. Background
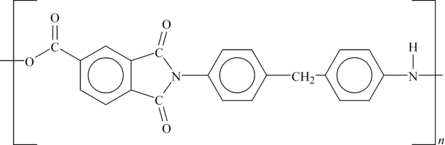
This chapter covers a series of plastics of which the imide group is an important part of the molecule. The imide group is formed by a condensation reaction of an aromatic anhydride group with an aromatic amine as shown in Figure 7.1.
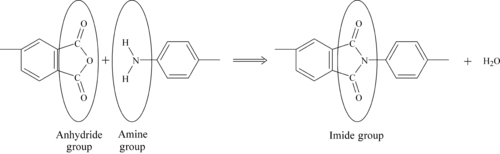
This group is very thermally stable. Aliphatic imides are possible, but the thermal stability is reduced, and thermal stability is one of the main reasons to use an imide type polymer.
7.1.1. Polyetherimide
Polyetherimide (PEI) is an amorphous engineering thermoplastic. Thermoplastic PEIs provide the strength, heat resistance, and flame retardancy of traditional polyimides (PIs) with the ease of simple melt processing seen in standard injection-molding resins like polycarbonate and ABS.
The key performance features of PEI resins include:
• excellent dimensional stability at high temperatures under load
• smooth as-molded surfaces
• transparency, though slightly yellow
• good optical properties
• very high strength and modulus
• high continuous-use temperature
• inherent ignition resistance without the use of additives
• good electrical properties with low ion content
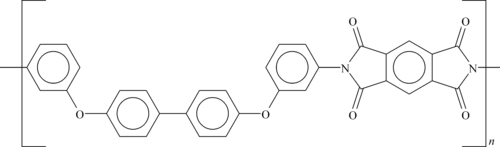
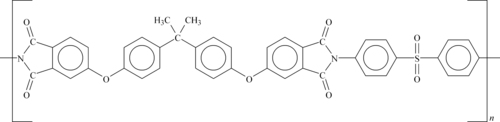
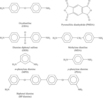
There are several different polymers that are offered in various PEI plastics. The structures of these are shown in Figure 7.2, Figure 7.3, Figure 7.4, Figure 7.5 and Figure 7.6 with references to one of the product lines that utilize that molecule.
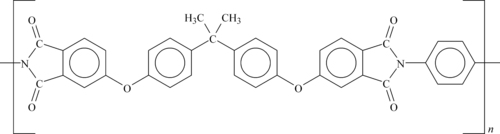
The acid dianhydride used to make most of the PEIs is 4,4′-bisphenol A dianhydride (BPADA), the structure of which is shown in Figure 7.7.

Some of the other monomers used in these PEIs are shown in Figure 7.8.
Many products are called thermoplastic polyimide (TPI) by their manufacturer. These can usually be classified as PEIs.
7.1.2. Polyamide-Imide
Polyamide-imides (PAIs) are thermoplastic amorphous polymers that have useful properties:
• Exceptional chemical resistance
• Outstanding mechanical strength
• Excellent thermal stability
• Performs from cryogenic up to 260°C
• Excellent electrical properties
The monomers used to make PAI resin are shown in Figure 7.9.
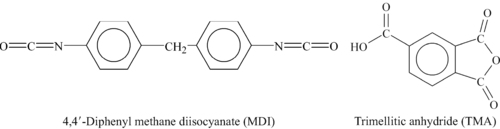
When these monomers are reacted carbon dioxide, rather than water, is generated. The closer the monomer ratio is to 1:1 the higher the molecular weight of the polymer shown in Figure 7.10.
7.1.3. Polyimide
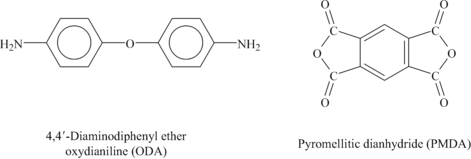
PIs are high-temperature engineering polymers originally developed by the DuPont Company. PIs exhibit an exceptional combination of thermal stability (>500°C), mechanical toughness, and chemical resistance. They have excellent dielectric properties and inherently low coefficient of thermal expansion. They are formed from diamines and dianhydrides such as those shown in Figure 7.11.
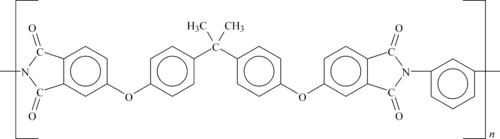
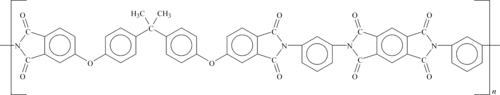
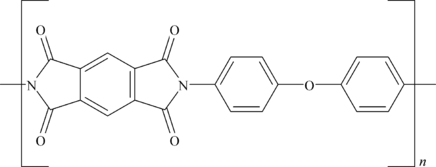
Many other diamines and several other dianhydrides may be chosen to tailor the final properties of a polymer whose structure is like that shown in Figure 7.12.
7.1.4. Imide Polymer Blends
PI-based resins, especially PEI and PAI polymers, may also be combined with other polymers. The PEI resins have produced a surprising number of miscible (one-phase) and compatible blends. Compatible blends are phase-separated mixtures having sufficient attraction between phases to provide some level of molecular adhesion, resulting in stable morphology and giving rise to good mechanical properties.
PEI forms miscible blends with polyesters such as PBT and PET. These blends have a single glass transition temperature between that of the PEI and polyester. However, few of these are commercial products yet.
Blends of BPADA-based PIs are also miscible with polyaryl ether ketones such as polyetheretherketone (PEEK). As injection molded, many PEEK–PEI blends are transparent.
7.2. Polyetherimides
7.2.1. Fatigue Data
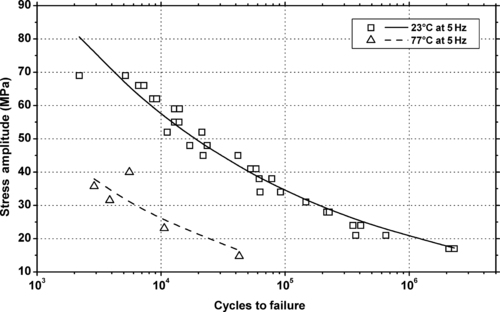 |
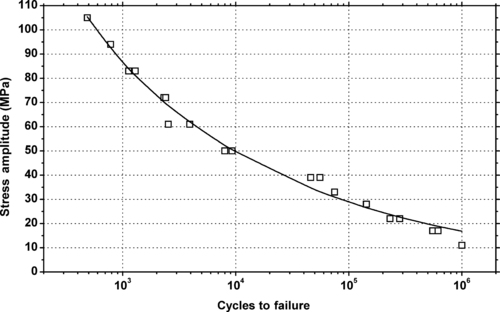
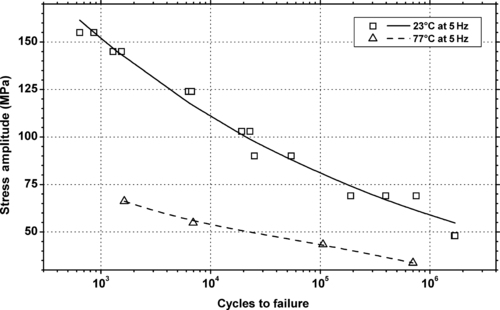
| Figure 7.13. |
| Tensile stress amplitude vs. cycles to failure of SABIC Innovative Plastics Ultem® 1000—transparent, standard flow, unreinforced general-purpose PEI. |
 |
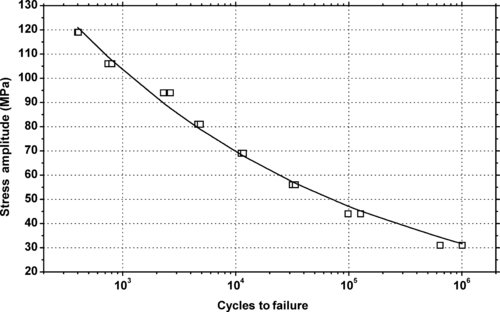
| Figure 7.14. |
| Tensile stress amplitude vs. cycles to failure at 23°C of SABIC Innovative Plastics Ultem® 1010—transparent, enhanced flow, unreinforced general-purpose PEI. |
 |
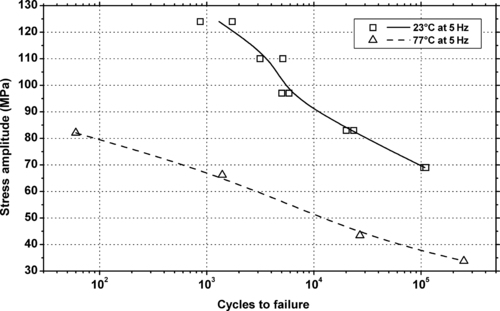
| Figure 7.15. |
| Tensile stress amplitude vs. cycles to failure at 23°C of SABIC Innovative Plastics Ultem® 2100—10% glass fiber reinforced, standard flow PEI. |
 |
| Figure 7.16. |
| Tensile stress amplitude vs. cycles to failure at 23°C of two SABIC Innovative Plastics Ultem®—20% glass reinforced PEI plastics. |
 |
| Figure 7.17. |
| Tensile stress amplitude vs. cycles to failure of SABIC Innovative Plastics Ultem® 2300—30% glass fiber reinforced, standard flow PEI. |
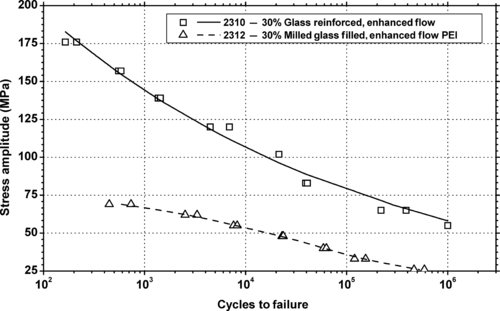 |
| Figure 7.18. |
| Tensile stress amplitude vs. cycles to failure at 23°C of two SABIC Innovative Plastics Ultem®—30% glass reinforced PEI plastics. |
 |
| Figure 7.19. |
| Tensile stress amplitude vs. cycles to failure of SABIC Innovative Plastics Ultem® 2400—40% glass fiber reinforced, standard flow PEI. |
 |
| Figure 7.20. |
| Tensile stress amplitude vs. cycles to failure of SABIC Innovative Plastics Ultem® 3452—45% glass/mineral reinforced, enhanced flow PEI. |
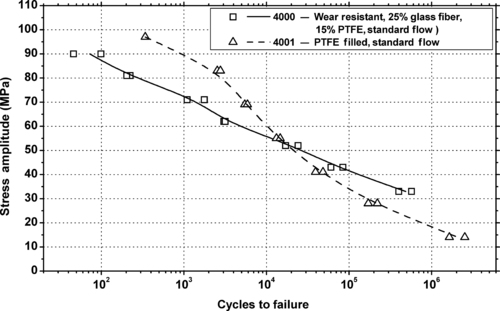 |
| Figure 7.21. |
| Tensile stress amplitude vs. cycles to failure of two SABIC Innovative Plastics Ultem® 4000 series PEI plastics. |
 |
| Figure 7.22. |
| Tensile stress amplitude vs. cycles to failure of two SABIC Innovative Plastics Ultem® 9000 series PEI plastics. |
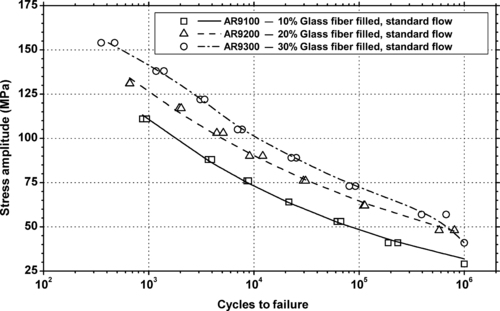 |
| Figure 7.23. |
| Tensile stress amplitude vs. cycles to failure of two SABIC Innovative Plastics Ultem® AR9000 series PEI plastics. |
 |
| Figure 7.24. |
| Tensile stress amplitude vs. cycles to failure of three SABIC Innovative Plastics Ultem® CRS5000 series PEI plastics. |
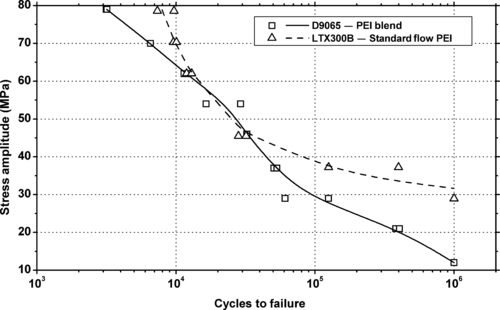 |
| Figure 7.25. |
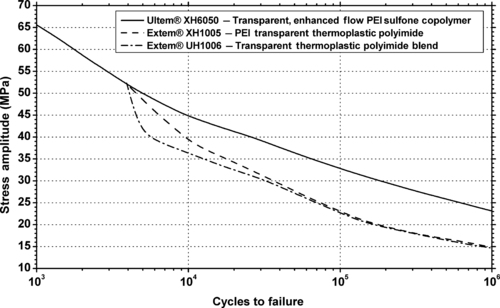
| Tensile stress amplitude vs. cycles to failure of two SABIC Innovative Plastics Ultem® series PEI plastics. |
7.2.2. Tribology Data
7.3. Polyamide-Imides
7.3.1. Fatigue Data
 |
| Figure 7.28. |
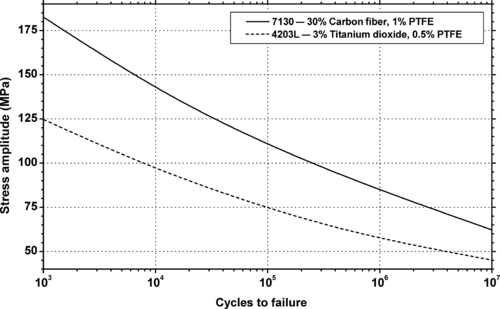
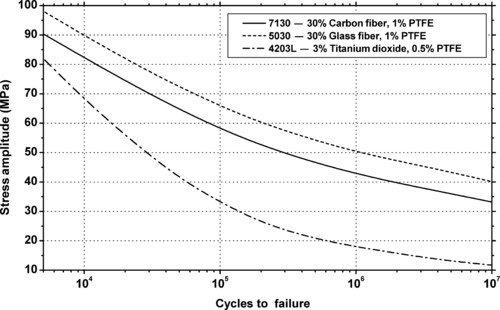
| Tension/tension stress amplitude vs. cycles to failure at 30Hz of two Solvay Torlon® PAI plastics. |
 |
| Figure 7.29. |
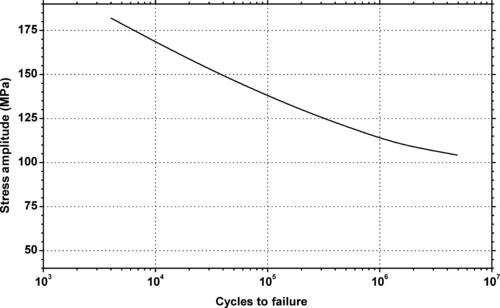
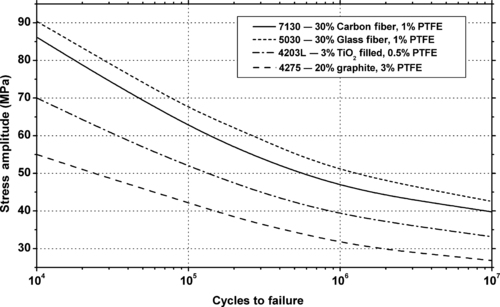
| Tension/tension stress amplitude vs. cycles to failure at 2Hz of Solvay Torlon® 7130—30% carbon fiber, 1% PTFE PAI. |
7.3.2. Tribology Data
 |
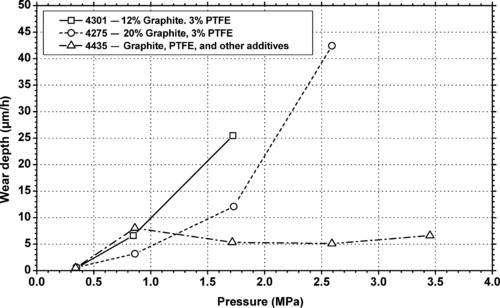
| Figure 7.32. |
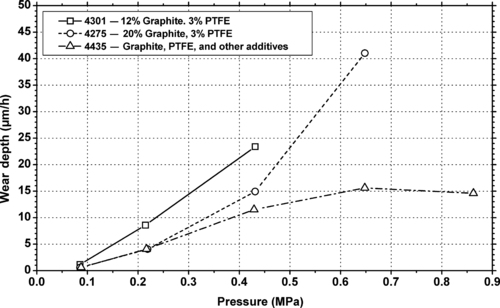
| Wear resistance vs. pressure at high velocity (4.06m/s) of several Solvay Torlon® PAI plastics. |
 |
| Figure 7.33. |
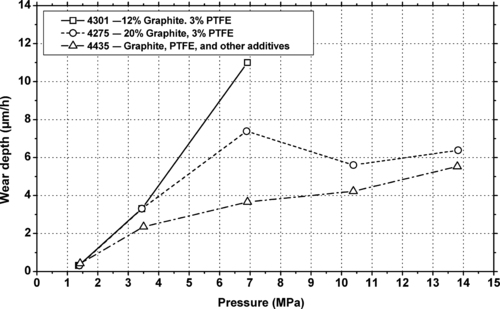
| Wear resistance vs. pressure at low velocity (0.25m/s) of several Solvay Torlon® PAI plastics. |
 |
| Figure 7.34. |
| Wear resistance vs. pressure at moderate velocity (1.02m/s) of several Solvay Torlon® PAI plastics. |
 |
| Figure 7.35. |
| Wear factor vs. extended cure time at 260°C of Solvay Torlon® 4301—12% Graphite, 3% PTFE PAI. |
7.4. Polyimides
7.4.1. Fatigue Data
7.4.2. Tribology Data
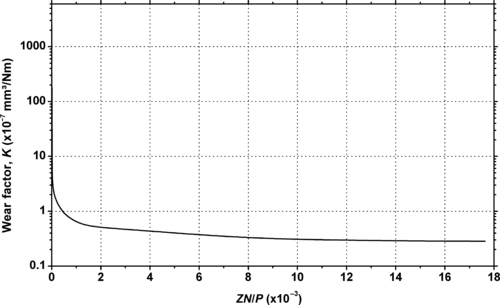 |
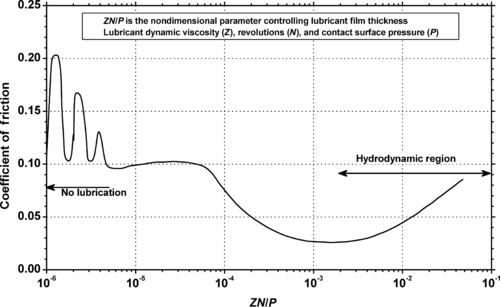
| Figure 7.38. |
| Lubricated friction test: wear factor vs. ZN/P by thrust bearing test against steel with Sunvis 31 Oil lubricant of DuPont Engineering Polymers Vespel® SP21—15% graphite filled PI. |
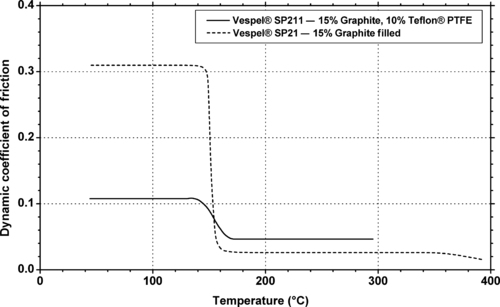 |
| Figure 7.40. |
| Dynamic coefficient of friction vs. temperature by thrust bearing test against unlubricated steel of two DuPont Engineering Polymers Vespel® SP PI plastics. |
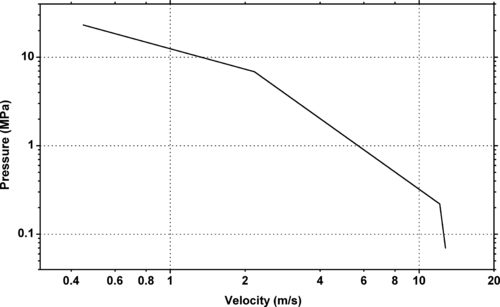 |
| Figure 7.41. |
| Pressure vs. velocity limit at 395°C against unlubricated carbon steel of DuPont Engineering Polymers Vespel® SP21—15% graphite filled PI. |
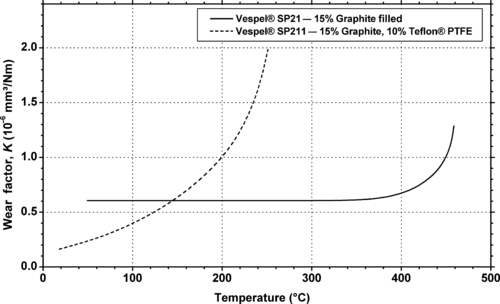 |
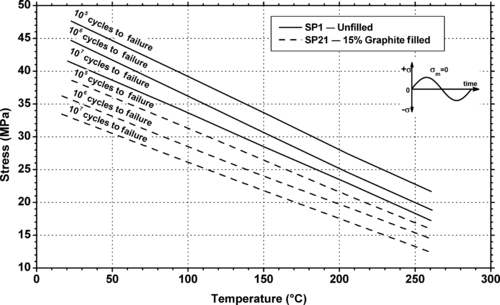
| Figure 7.42. |
| Wear factor vs. temperature against unlubricated mild carbon steel of two DuPont Engineering Polymers Vespel® SP PI plastics. |
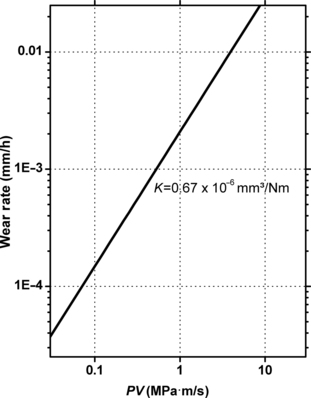 |
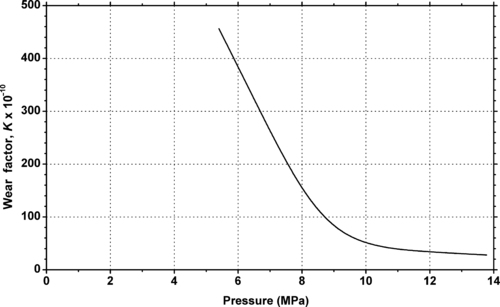
| Figure 7.43. |
| Wear rate vs. PV against unlubricated mild carbon steel in thrust bearing tester of DuPont Engineering Polymers Vespel® SP21—15% graphite filled PI. |
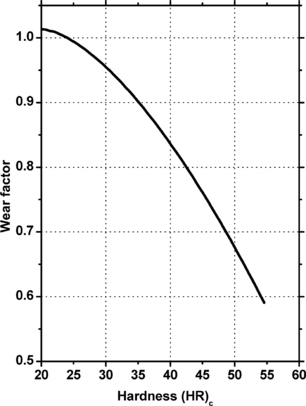 |
| Figure 7.44. |
| Wear factor vs. unlubricated counter material hardness in thrust bearing tester of DuPont Engineering Polymers Vespel® SP21—15% graphite filled PI. |
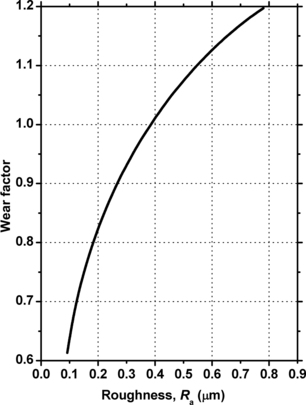 |
| Figure 7.45. |
| Wear factor vs. roughness of unlubricated counter material hardness in thrust bearing tester of DuPont Engineering Polymers Vespel® SP21—15% graphite filled PI. |
| SP1 | SP21 | SP22 | SP211 | SP3 | |||||
|---|---|---|---|---|---|---|---|---|---|
| Ma | DFb | M | DF | M | DF | M | DF | M | |
| Wear Rate (m/s × 10–10) c | 17–85 | 17–85 | 6.3 | 6.3 | 4.2 | 4.2 | 4.9 | 4.9 | 17–23 |
| Coefficient of Friction: | |||||||||
| At PV = 0.875MPam/s | 0.29 | 0.29 | 0.24 | 0.24 | 0.30 | 0.30 | 0.12 | 0.12 | 0.25 |
| At PV = 3.5MPam/s | – | – | 0.12 | 0.12 | 0.09 | 0.09 | 0.08 | 0.08 | 0.17 |
| In vacuum | – | – | – | – | – | – | – | – | 0.03 |
| Static in air | 0.35 | – | 0.30 | – | 0.27 | – | 0.20 | – | – |
| Vespel® SP1—Unfilled. | |||||||||
| Vespel® SP21—15% graphite filled. | |||||||||
| Vespel® SP22—40% graphite filled. | |||||||||
| Vespel® SP211—15% graphite, 10% Teflon® PTFE. | |||||||||
| Vespel® SP3—15% molybdenum sulfide filled. | |||||||||
| aM = machined part. | |||||||||
| bDF = direct formed part. | |||||||||
| cUnlubricated in air (PV = 0.875MPam/s). | |||||||||
..................Content has been hidden....................
You can't read the all page of ebook, please click here login for view all page.