
Chapter 5. Polyether Plastics
5.1. Background
This chapter covers polymers in which the most important linking group is the ether moiety, which is –O–.
5.1.1. Polyoxymethylene (or Acetal Homopolymer)
Acetal polymers, also known as polyoxymethylene (POM) or polyacetal, are formaldehyde-based thermoplastics that have been commercially available since the 1960s. Polyformaldehyde is thermally unstable. It decomposes on heating to yield formaldehyde gas. Two methods of stabilizing polyformaldehyde for use as an engineering polymer were developed and introduced by DuPont in 1959 and Celanese in 1962 (now Ticona).
DuPont’s method for making polyacetal yields a homopolymer through the condensation reaction of polyformaldehyde and acetic acid (or acetic anhydride). The acetic acid puts acetate groups (CH3COO–) on the ends of the polymer as shown in Figure 5.1, which provide thermal protection against decomposition to formaldehyde.
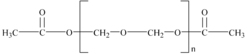
Further stabilization of acetal polymers also includes the addition of antioxidants and acid scavengers. Polyacetals are subject to oxidative and acidic degradation, which leads to molecular weight decline. Once the chain of the homopolymer is ruptured by such an attack, the exposed polyformaldehyde ends may decompose to formaldehyde and acetic acid.
5.1.2. Polyoxymethylene Copolymer (POM-Co or Acetal Copolymer)
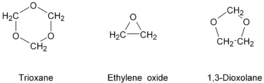
The Celanese route for the production of polyacetal yields a more stable copolymer product via the reaction of trioxane, a cyclic trimer of formaldehyde, and a cyclic ether, such as ethylene oxide or 1,3-dioxolane. The structures of these monomers are shown in Figure 5.2. The polymer structure is given in Figure 5.3.
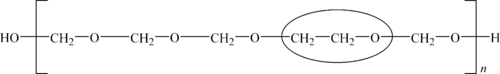
The improved thermal and chemical stability of the copolymer versus the homopolymer is a result of randomly distributed oxyethylene groups, which is circled in Figure 5.5. All polyacetals are subject to oxidative and acidic degradation, which leads to molecular weight reduction. Degradation of the copolymer ceases, however, when one of the randomly distributed oxyethylene linkages is reached. These groups offer stability to oxidative, thermal, acidic and alkaline attack. The raw copolymer is hydrolyzed to an oxyethylene end cap to provide thermally stable polyacetal copolymer.
The copolymer is also more stable than the homopolymer in an alkaline environment. Its oxyethylene end cap is stable in the presence of strong bases. The acetate end cap of the homopolymer, however, is readily hydrolyzed in the presence of alkalis, causing significant polymer degradation.
The homopolymer is more crystalline than the copolymer. The homopolymer provides better mechanical properties, except for elongation. The oxyethylene groups of the copolymer provide improved long-term chemical and environmental stability. The copolymer’s chemical stability results in better retention of mechanical properties over an extended product life.
Acetal polymers have been particularly successful in replacing cast and stamped metal parts due to their toughness, abrasion resistance and ability to withstand prolonged stresses with minimal creep. Polyacetals are inherently self-lubricating. Their lubricity allows the incorporation of polyacetal in a variety of metal-to-polymer and polymer-to-polymer interface applications such as bearings, gears and switch plungers. These properties have permitted the material to meet a wide range of market requirements.
The properties of polyacetals can be summarized as follows:
• Excellent wear resistance
• Very good strength and stiffness
• Good heat resistance
• Excellent chemical resistance
• Opaque
• Moderate to high price
• Somewhat restricted processing
5.1.3. Modified Polyphenylene Ether/Polyphenylene Oxides
Polyphenylene ether (PPE) plastics are also referred to as polyphenylene oxide (PPO). The structure of the polymer is shown in Figure 5.4.

The PPE materials are always blended or alloyed with other plastics, so they are called modified PPE or PPO. PPE is compatible with polystyrene (PS) and is usually blended with high-impact PS over a wide range of ratios. Because both PPE and PS plastics are hydrophobic, the alloys have very low water absorption rates and high dimensional stability. They exhibit excellent dielectric properties over a wide range of frequencies and temperatures. PPE/PS alloys are supplied in flame-retardant, filled and reinforced, and structural foam molding grades. PPE can also be alloyed with polyamide (nylon) plastics to provide increased resistance to organic chemicals and better high-temperature performance.
End uses include automotive electrical applications, water pump impellers, HVAC equipment, solar heating systems, packaging and circuit breakers.
5.2. Acetals–POM Homopolymer
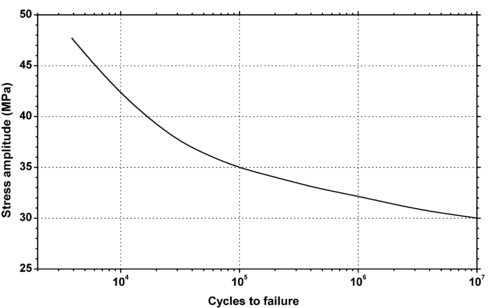
5.2.1. Fatigue Data
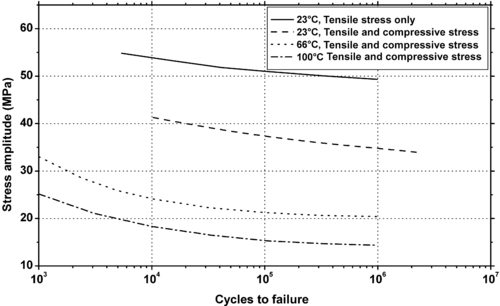 |
| Figure 5.5 |
5.2.2. Tribology Data
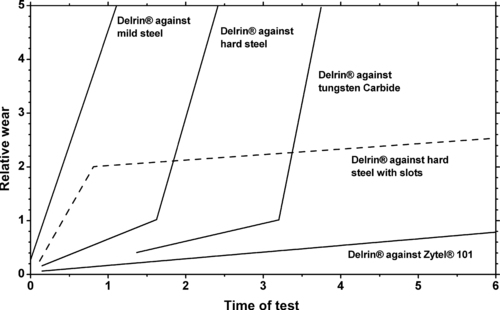 |
| Figure 5.9. |
| Wear against various materials of DuPont Engineering Polymers Delrin® 100, 500 and 900—unfilled POM. |
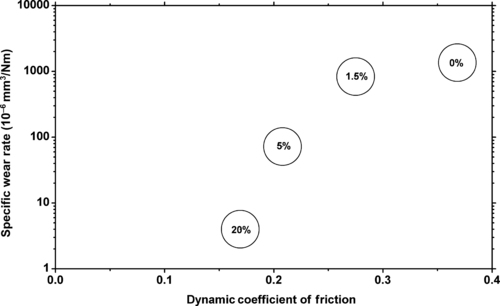 |
| Figure 5.10. |
| The effect of Teflon® PTFE levels in DuPont Engineering Polymers Delrin® on wear rate and dynamic coefficient of friction. |
5.3. Acetals–POM-Co
5.3.1. Fatigue Data
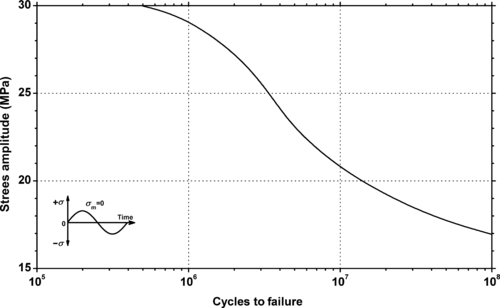 |
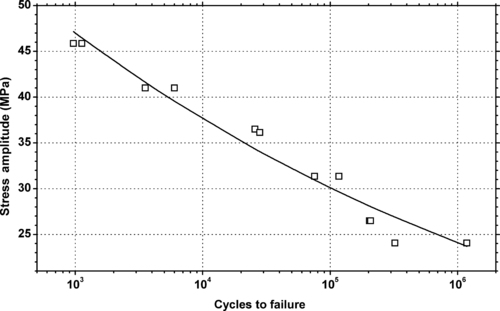
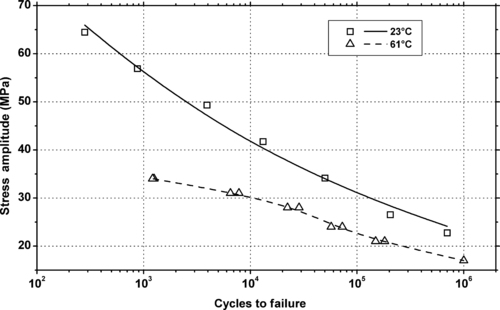
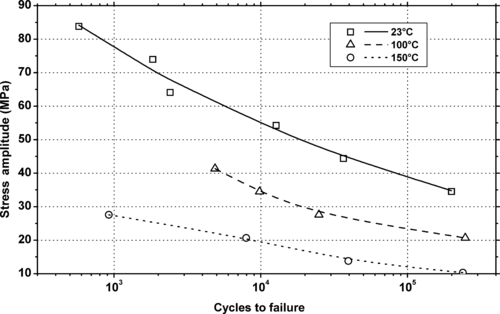
| Figure 5.12. |
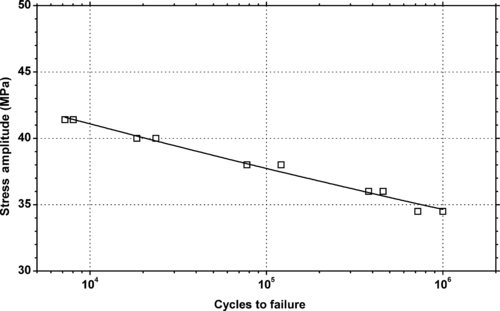
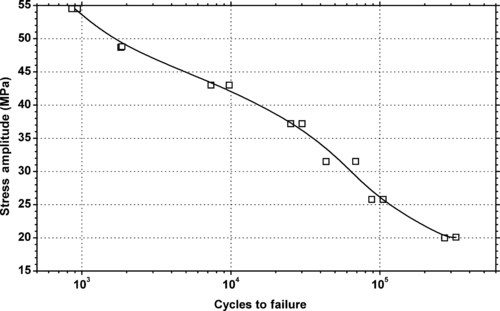
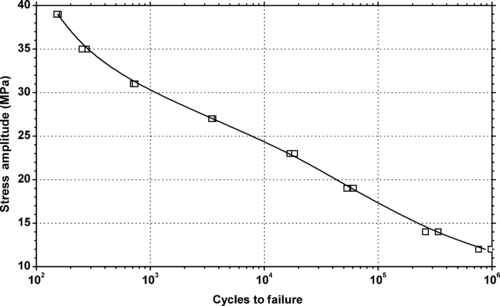
| Fluctuating stress amplitude vs. cycles to failure at 23°C and 10Hz for Ticona Hostaform® C 9021—Standard Injection Molding Grade POM-Co. |
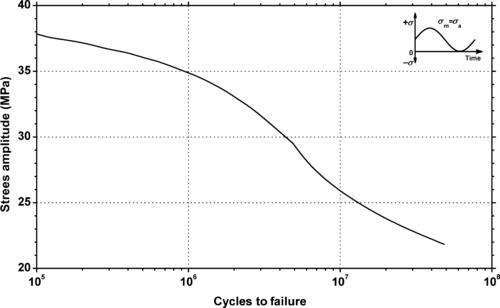 |
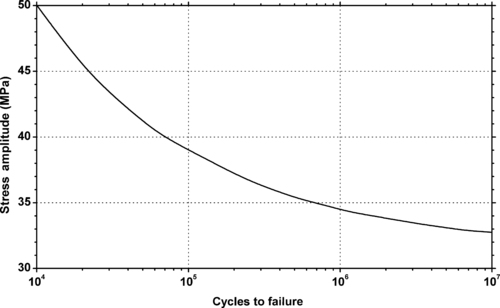
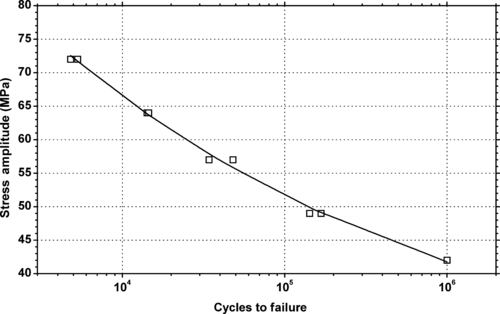
| Figure 5.13. |
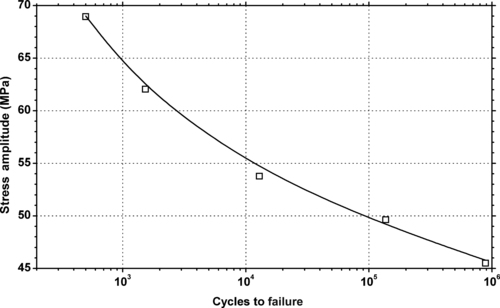
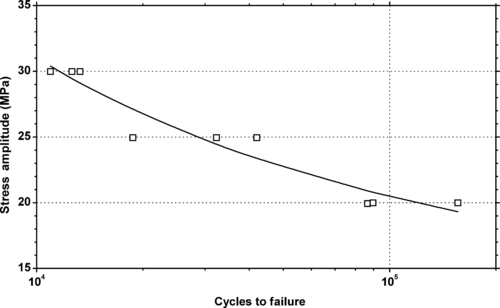
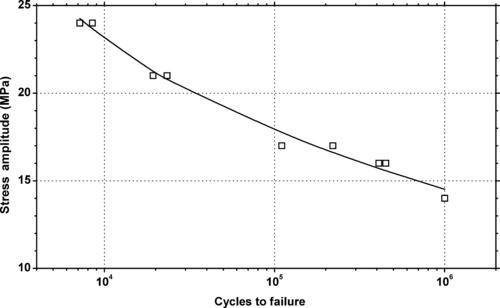
| Tensile stress amplitude vs. cycles to failure at 23°C and 10Hz for Ticona Hostaform® C 9021—Standard Injection Molding Grade POM-Co. |
 |
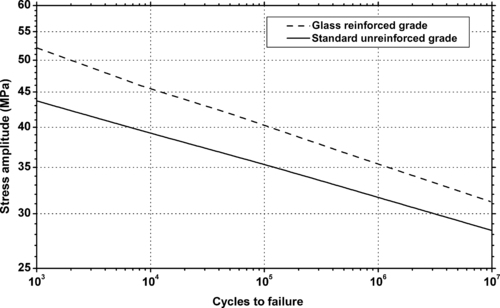
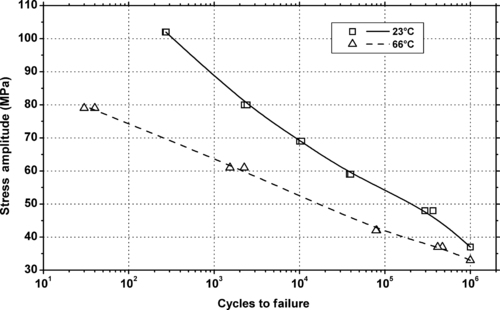
| Figure 5.14. |
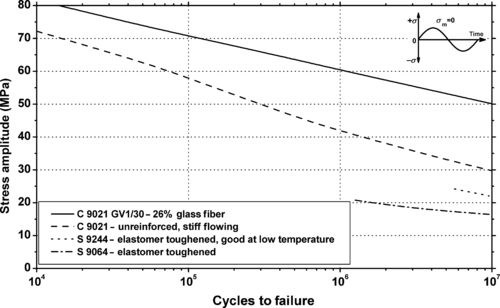
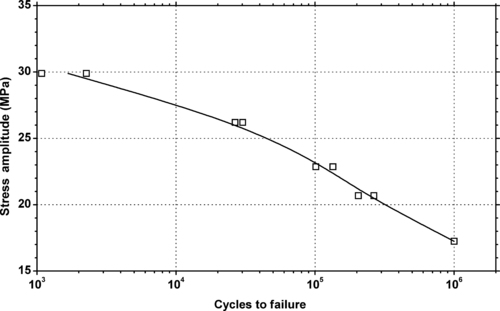
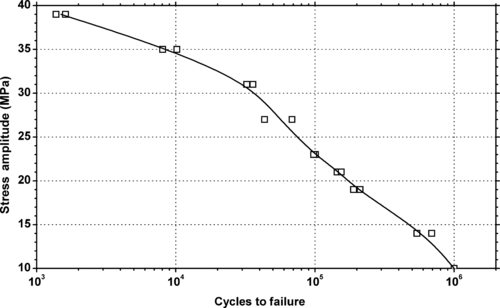
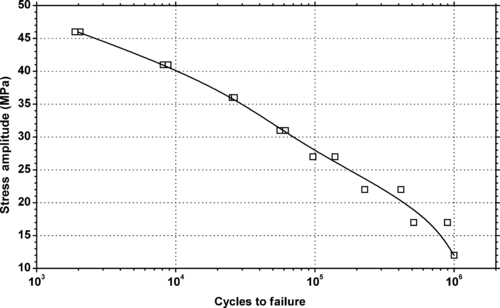
| Flexural stress amplitude vs. cycles to failure at 23°C and 10Hz for several Ticona Hostaform® POM-Co plastics. |
 |
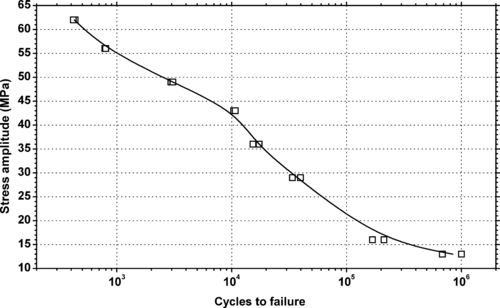
| Figure 5.15. |
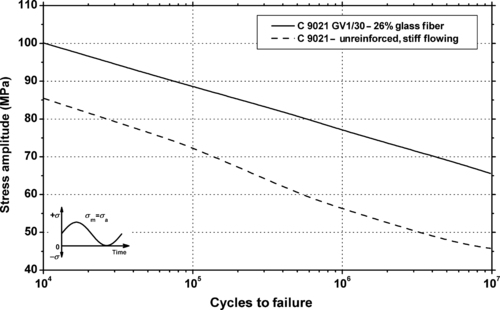
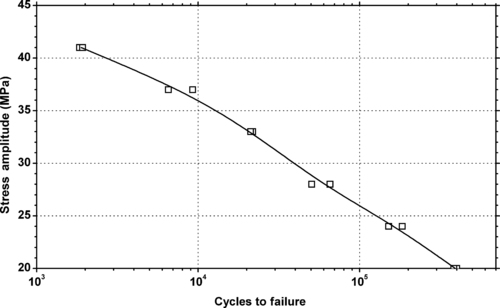
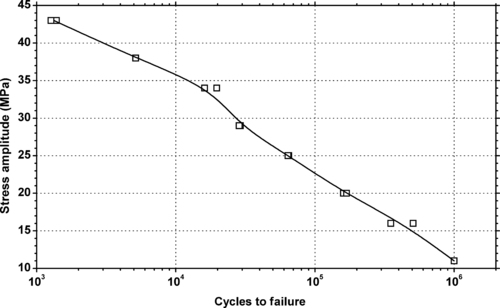
| Flexural stress amplitude vs. cycles to failure at 23°C and 10Hz for two Ticona Hostaform® C 9021 POM-Co plastics. |
 |
| Figure 5.16. |
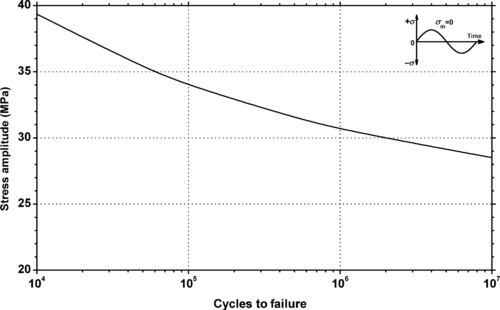
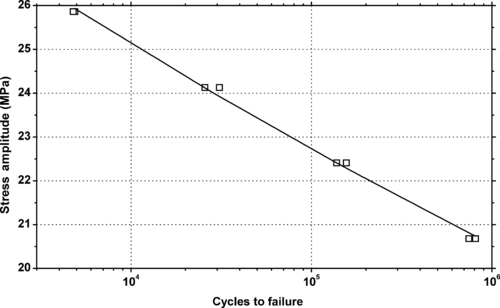
| Torsional stress amplitude vs. cycles to failure at 23°C and 10Hz for Ticona Hostaform® C 9021—Standard Injection Molding Grade POM-Co. |
5.3.2. Tribology Data
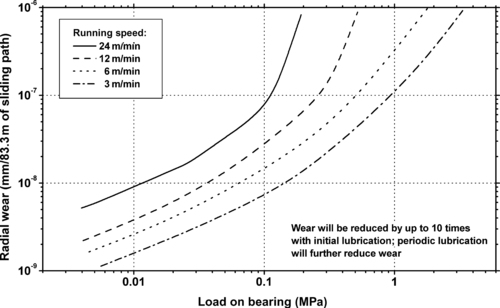 |
| Figure 5.19. |
| Radial wear vs. load on unlubricated journal bearing of Ticona Celcon® POM-Co at various running speeds at 23°C. |
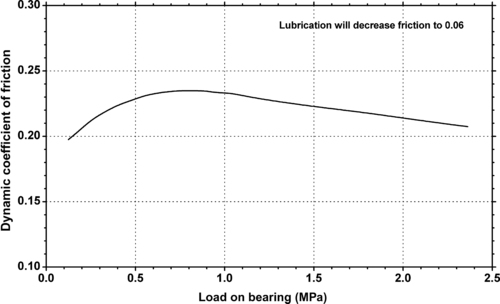 |
| Figure 5.20. |
| Dynamic coefficient of friction vs. bearing pressure on unlubricated hardened and polished steel shaft of Ticona Celcon® POM-Co at a running speed of 10m/min. |
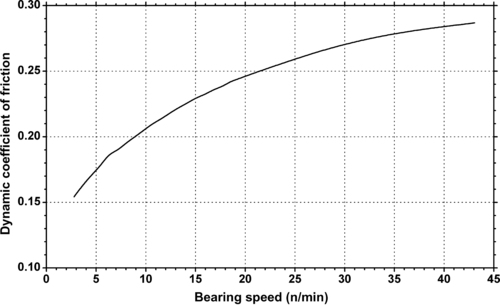 |
| Figure 5.21. |
| Dynamic coefficient of friction vs. bearing speed on unlubricated hardened and polished steel shaft of Ticona Celcon® POM-Co at a bearing pressure of 0.26Mpa. |
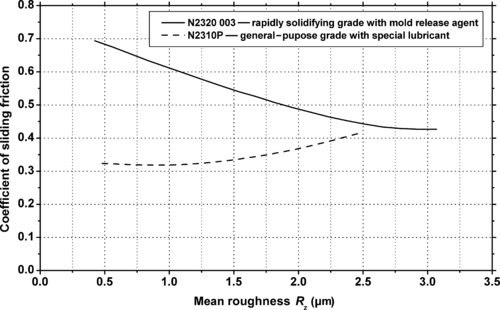 |
| Figure 5.23. |
| Coefficient of sliding friction vs. roughness of a sliding steel disk (HRC = 54–56 at 40°C, P = 1MPa, V = 0.5m/s) for two BASF Ultraform® POM-Co plastics. |
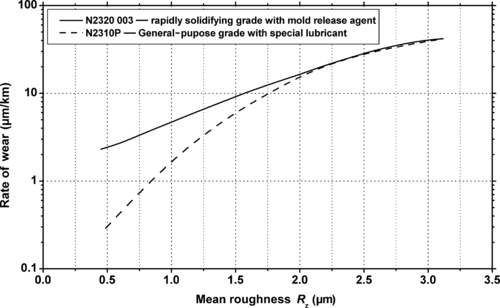 |
| Figure 5.24. |
| Wear rate vs. roughness of a sliding steel disk (HRC = 54–56 at 40°C, P = 1MPa, V = 0.5m/s) for two BASF Ultraform® POM-Co plastics. |
| Grade | Wear Volume (mm2) | Dynamic COFa |
|---|---|---|
| C 9021 AW | 0.62 | |
| C 9021 K | 0.73 | 0.39 |
| C 9021 TF + 3% Si oil | 1.23 | 0.27 |
| C 9021 G | 1.96 | 0.29 |
| C 9021 TF | 3.64 | 0.23 |
| C 9021 + 3% Si oil | 6.56 | 0.39 |
| C 9021 | 7.96 | 0.34 |
| aSpeed = 20m/min, pressure = 1.25N/mm2, test duration 30min. | ||
5.4. Modified Polyphenylene Ether/Polyphenylene Oxide
5.4.1. Fatigue Data
 |
| Figure 5.25. |
| Tensile stress amplitude vs. cycles to failure at 23°C of SABIC Innovative Plastics Noryl® GTX954—unfilled impact modified PPE/PS/PA plastic. |
 |
| Figure 5.26. |
| Flexural stress amplitude vs. cycles to failure at 23°C of SABIC Innovative Plastics Thermocomp® ZF-1006—30% glass fiber PPO. |
 |
| Figure 5.27. |
| Tensile stress amplitude vs. cycles to failure at 23°C of SABIC Innovative Plastics Noryl® PPX615—15% glass fiber reinforced, impact modified PPE/PP plastic. |
 |
| Figure 5.28. |
| Tensile stress amplitude vs. cycles to failure at 23°C of SABIC Innovative Plastics Noryl® PPX630—30% glass fiber reinforced PPE/PP plastic. |
 |
| Figure 5.29. |
| Tensile stress amplitude vs. cycles to failure at 23°C of SABIC Innovative Plastics Noryl® PPX640—40% glass fiber reinforced PPE/PP plastic. |
 |
| Figure 5.30. |
| Tensile stress amplitude vs. cycles to failure at 23°C of SABIC Innovative Plastics Noryl® PPX7110—high-impact, good heat resistant PPE/PP plastic. |
 |
| Figure 5.31. |
| Tensile stress amplitude vs. cycles to failure at 23°C of SABIC Innovative Plastics Noryl® PPX7112—paintable, exterior automotive PPE/PP plastic. |
 |
| Figure 5.32. |
| Tensile stress amplitude vs. cycles to failure at 23°C of SABIC Innovative Plastics Noryl® PPX7115—high-modulus/impact/heat PPE/PP plastic. |
 |
| Figure 5.33. |
| Tensile stress amplitude vs. cycles to failure at 23°C of SABIC Innovative Plastics Noryl® 731 general-purpose, UL94 HB rated PPE/PS plastic. |
 |
| Figure 5.34. |
| Tensile stress amplitude vs. cycles to failure at 23°C of SABIC Innovative Plastics Noryl® HH195—PPE/PS plastic. |
 |
| Figure 5.35. |
| Tensile stress amplitude vs. cycles to failure at 23°C of SABIC Innovative Plastics Noryl® EM6100F—automotive interiors. 240°F HDT, high-impact, PPE/PS plastic. |
 |
| Figure 5.36. |
| Tensile stress amplitude vs. cycles to failure at 23°C of SABIC Innovative Plastics Noryl® EM6101—automotive interiors, improved flow and processing 250°F DTUL PPE/PS plastic. |
 |
| Figure 5.37. |
| Tensile stress amplitude vs. cycles to failure at 23°C of SABIC Innovative Plastics Noryl® EM7100—automotive interiors. 200F DTUL. Excellent processability/economy. PPE/PS plastic. |
 |
| Figure 5.39. |
| Tensile stress amplitude vs. cycles to failure at 23°C of SABIC Innovative Plastics Noryl® FN150X—improved productivity, thin wall capable, UL94 V-0/5VA rated PPE/PS plastic. |
 |
| Figure 5.40. |
| Tensile stress amplitude vs. cycles to failure at 23°C of SABIC Innovative Plastics Noryl® FN215X—structural foam PPE/PS plastic. |
 |
| Figure 5.41. |
| Tensile stress amplitude vs. cycles to failure at 23°C of SABIC Innovative Plastics Noryl® GFN1—10% glass fiber reinforced, UL94 HB rated PPE/PS plastic. |
 |
| Figure 5.42. |
| Tensile stress amplitude vs. cycles to failure at 23°C of SABIC Innovative Plastics Noryl® GFN2—20% glass fiber reinforced, UL94 HB rated PPE/PS plastic. |
 |
| Figure 5.43. |
| Tensile stress amplitude vs. cycles to failure of SABIC Innovative Plastics Noryl® GFN3—30% glass fiber reinforced, UL94 HB rated PPE/PS plastic. |

..................Content has been hidden....................
You can't read the all page of ebook, please click here login for view all page.