
Chapter 12. High-Temperature Polymers
12.1. Background
This section contains information and multipoint properties for several high-temperature, high-performance plastics. They might be classified or been appropriate to include in another chapter, but they are grouped in this chapter because of their performance levels.
12.1.1. Polyetheretherketone
Polyetheretherketones (PEEK) are also referred to as polyketones. The most common structure is given in Figure 12.1.
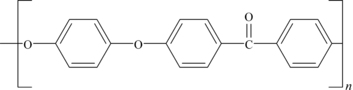
PEEK is a thermoplastic with extraordinary mechanical properties. The Young’s modulus of elasticity is 3.6GPa and its tensile strength is 170MPa. PEEK is partially crystalline, melts at around 350°C, and is highly resistant to thermal degradation. The material is also resistant to both organic and aqueous environments, and is used in bearings, piston parts, pumps, compressor plate valves, and cable insulation applications. It is one of the few plastics compatible with ultrahigh vacuum applications. In summary, the properties of PEEK include:
• outstanding chemical resistance
• outstanding wear resistance
• outstanding resistance to hydrolysis
• excellent mechanical properties
• outstanding thermal properties
• very good dielectric strength, volume resistivity, tracking resistance
• excellent radiation resistance
12.1.2. Polyethersulfone
Polyethersulfone (PES) is an amorphous polymer and a high-temperature engineering thermoplastic. Even though PES has high-temperature performance, it can be processed on conventional plastics processing equipment. Its chemical structure is shown in Figure 12.2. PES has an outstanding ability to withstand exposure to elevated temperatures in air and water for prolonged periods.

Because PES is amorphous, mold shrinkage is low and is suitable for applications requiring close tolerances and little dimensional change over a wide temperature range. Its properties include:
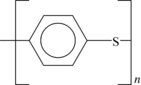
12.1.3. Polyphenylene Sulfide
Polyphenylene sulfide (PPS) is a semicrystalline material. It offers an excellent balance of properties, including high-temperature resistance, chemical resistance, flowability, dimensional stability, and electrical characteristics. PPS must be filled with fibers and fillers to overcome its inherent brittleness. Because of its low viscosity, PPS can be molded with high loadings of fillers and reinforcements. Because of its outstanding flame resistance, PPS is ideal for high-temperature electrical applications. It is unaffected by all industrial solvents. The structure of PPS is shown in Figure 12.3.
There are several variants to regular PPS that may be talked about by suppliers or may be seen in the literature. These are:
• Regular PPS is of “modest” molecular weight. Materials of this type are often used in coating products.
• Cured PPS is PPS that has been heated to high temperature, above 300°C, in the presence of air or oxygen. The oxygen causes some cross-linking and chain extension called oxidative cross-linking. This results in some thermoset-like properties such as improved thermal stability, dimensional stability, and improved chemical resistance.
• High-molecular-weight (HMW) linear PPS has a molecular weight about double of that of regular PPS. The higher molecular weight improves elongation and impact strength.
• High-molecular weight (HMW) branched PPS has higher molecular weight than regular PPS, but it also has polymer chain branches along the main molecule backbone. This provides improved mechanical properties.
PPS properties are summarized:
• Continuous use temperature of 220°C
• Excellent dimensional properties
• Transparent
• Improved impact strength and toughness as compared to PES
• Excellent hydrolytic stability
• High stress cracking resistance
• Good chemical resistance
• Good surface release properties
• Expected continuous temperature of 180°C
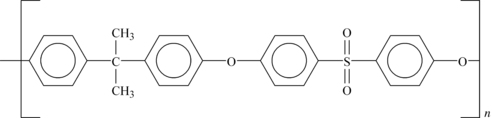
12.1.4. Polysulfone
Polysulfone (PSU) is a rigid, strong, tough, high-temperature amorphous thermoplastic. The structure of PSU is shown in Figure 12.4.
Its properties summarized:
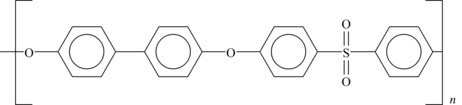
12.1.5. Polyphenylsulfone
Polyphenylsulfone (PPSU) is a rigid, strong, tough, high-temperature amorphous thermoplastic. It has a high heat deflection temperature of 405°F (207°C); it can withstand continuous exposure to heat and still absorb tremendous impact without cracking or breaking. It is inherently flame retardant and offers exceptional resistance to bases and other chemicals. The structure of PPSU is shown in Figure 12.5.
Its properties summarized:
• 207°C HDT
• Superior toughness
• Exceptional hydrolytic stability
• Good chemical resistance
• Transparent
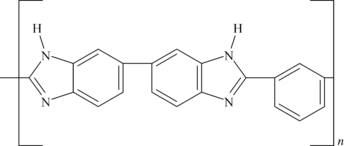
12.1.6. Polybenzimidazole
Polybenzimidazole (PBI) is a unique and highly stable linear heterocyclic polymer. The chemical structure is shown in Figure 12.6. PBI exhibits excellent thermal stability, resistance to chemicals, acid and base hydrolysis, and temperature resistance. PBI can withstand temperatures as high as 430°C, and in short bursts, to 760°C. PBI does not burn and maintains its properties as low as −196°C.
Ideally suited for its application in extreme environments, PBI can be formed into stock shapes and subsequently machined into high precision finished parts. Since PBI does not have a melt point, moldings from virgin PBI polymer can only be formed in a high-temperature, high-pressure compression molding process.
PBI is highly resistant to deformation, and has low hysteresis loss and high elastic recovery. PBI exhibits ductile failure, and may be compressed to over 50% strain without fracture. Celazole® PBI has the highest compressive strength of any thermoplastic or thermosetting resin at 400MPa. There is no weight loss or change in compressive strength of Celazole® PBI exposed to 260°C in air for 500 hours. At 371°C, no weight or strength change takes place for 100 hours. In spite of these unusual properties, PBI is usually blended with other plastics, particularly polyesters and PEEK.
12.2. Polyetheretherketone
12.2.1. Fatigue Data
12.2.2. Tribology Data
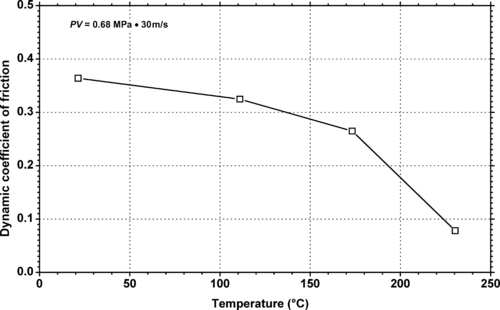 |
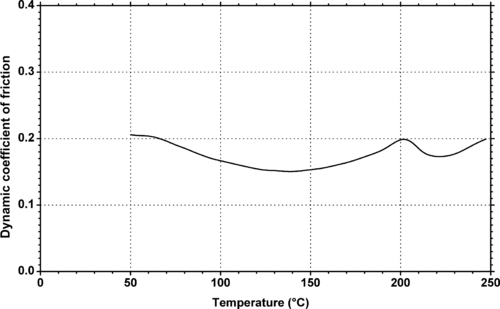
| Figure 12.9. |
| Dynamic coefficient of friction vs. temperature of Greene, Tweed & Co. Arlon® 1260—carbon fiber reinforced PEEK. |
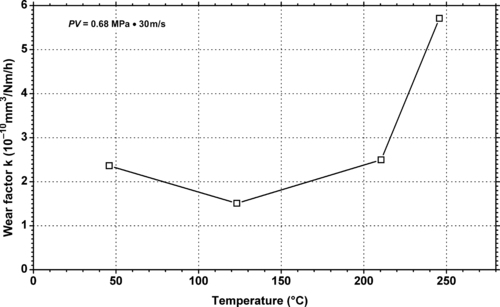 |
| Figure 12.10. |
| Wear factor vs. temperature of Greene, Tweed & Co. Arlon® 1260—carbon fiber reinforced PEEK. |
 |
| Figure 12.11. |
| Dynamic coefficient of friction vs. temperature of Victrex plc Victrex® 450FC30—lubricated, 30% carbon fiber/PTFE PEEK. |
| Material | 20°C | 200°C | ||||||
|---|---|---|---|---|---|---|---|---|
| Load (kg) | Lpv (MPa) | μa | Wear Rateb (μmmin−1) | Load (kg) | Lpv (MPa) | μa | Wear Rateb (μmmin−1) | |
| Victrex® 450FC30 450FC30—Lubricated, 30% carbon fiber/PTFE | 40 | 794 | 0.17 | 3.2 | 40 | 622 | 0.14 | 132 |
| Victrex® 450G—general-purpose grade | 8 | 145 | 0.58 | 7.5 | 8 | 147 | 0.51 | 150 |
| Victrex® 450CA30—30% carbon fiber | 22 | 376 | 0.28 | 3.8 | 13 | 445 | 0.25 | — |
| aAverage of the coefficient of friction at Lpv and 50% Lpv. | ||||||||
| bWear rate at 50% Lpv. | ||||||||
| Material Type | Sliding Condition | Friction Coefficient | Relative Error (%) | Wear Rate (10−6mm³/Nm) | Relative Error (%) |
|---|---|---|---|---|---|
| MA, low-molecular-weight PEEK | |||||
| 1MPa,1m/s | 0.34 | 3.28 | 19.69 | 13.87 | |
| 2MPa,1m/s | 0.38 | 1.36 | 25.85 | 21.57 | |
| 4MPa,1m/s | 0.41 | 5.63 | 18.10 | 23.18 | |
| MB, medium-molecular weight PEEK | |||||
| 1MPa,1m/s | 0.37 | 16.10 | 12.41 | 33.93 | |
| 2MPa,1m/s | 0.39 | 1.18 | 16.37 | 21.60 | |
| 4MPa,1m/s | 0.39 | 9.49 | 14.14 | 1.70 | |
| MC, high-molecular weight PEEK | |||||
| 1MPa,1m/s | 0.37 | 13.14 | 11.59 | 21.63 | |
| 2MPa,1m/s | 0.41 | 3.44 | 13.00 | 35.62 | |
| 4MPa,1m/s | 0.42 | 5.55 | 22.30 | 15.62 | |
| MB FC30, medium-molecular weight PEEK, with 10 wt% silicone carbide fiber, 9.1 vol% graphite and PTFE | |||||
| 1MPa,1m/s | 0.35 | 11.93 | 0.51 | 7.64 | |
| 2MPa,1m/s | 0.41 | 3.30 | 0.75 | 6.53 | |
| 4MPa,1m/s | 0.37 | 18.87 | 0.99 | 13.36 | |
| MC FC30, high-molecular weight PEEK, with 10 wt% silicone carbide fiber, 9.1 vol% graphite and PTFE | |||||
| 1MPa,1m/s | 0.36 | 12.05 | 0.60 | 13.16 | |
| 2MPa,1m/s | 0.41 | 10.14 | 0.75 | 5.24 | |
| 4MPa,1m/s | 0.27 | 1.80 | 0.83 | 3.36 | |
| aZhang G, Schlarb AK, Correlation of the tribological behaviors with the mechanical properties of poly-etherether-ketones (PEEKs) with different molecular weights and their fiber filled composites. Wear 2008, doi: 10.1016/j.wear.2008.07.004. | |||||
12.3. Polyethersulfone
12.3.1. Fatigue Data
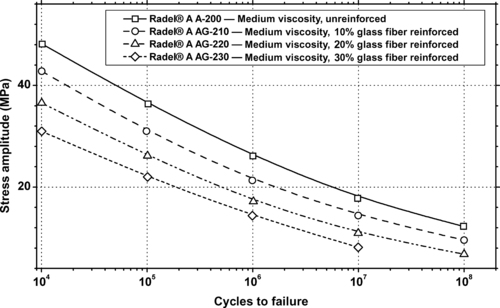 |
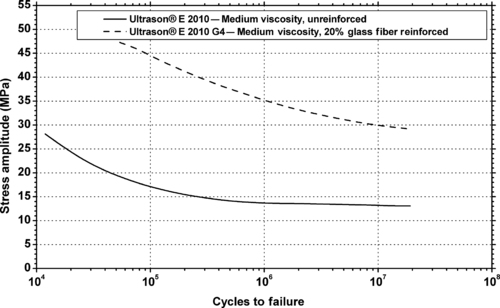
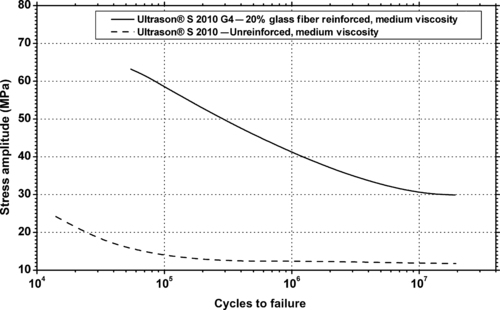
| Figure 12.12. |
| Flexural stress amplitude vs. cycles to failure at 23°C and 30Hz of several Solvay Advanced Polymers, L.L.C. Radel® PES plastics. |
12.3.2. Tribology Data
12.4. Polyphenylene Sulfide
12.4.1. Fatigue Data
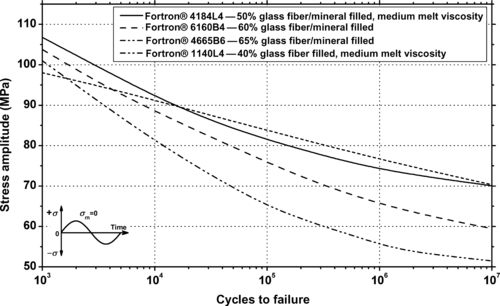 |
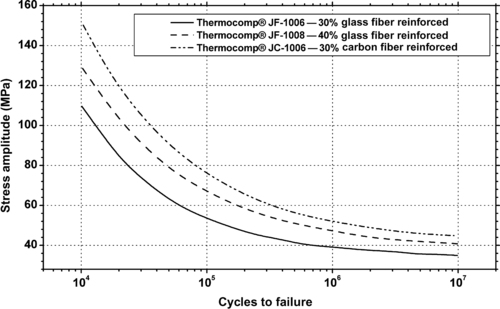
| Figure 12.16. |
| Flexural stress amplitude vs. cycles to failure at 23°C and 10Hz of several fiber reinforced Ticona Fortron® PPS plastics. |
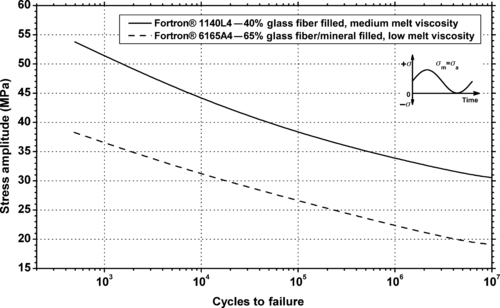 |
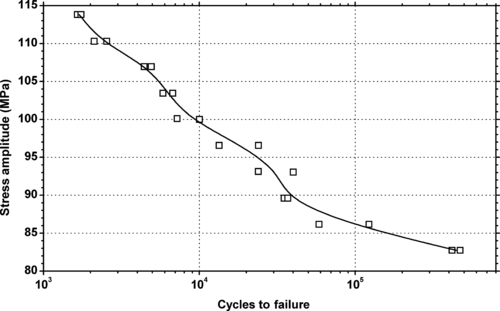
| Figure 12.17. |
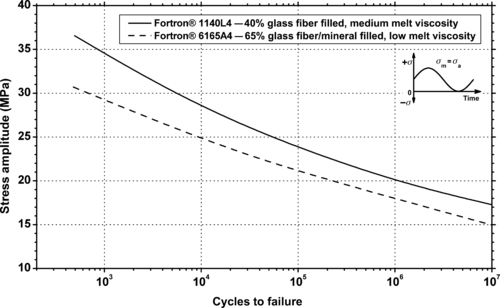
| Tensile stress amplitude vs. cycles to failure at 23°C and 5Hz of two fiber reinforced Ticona Fortron® PPS plastics. |
 |
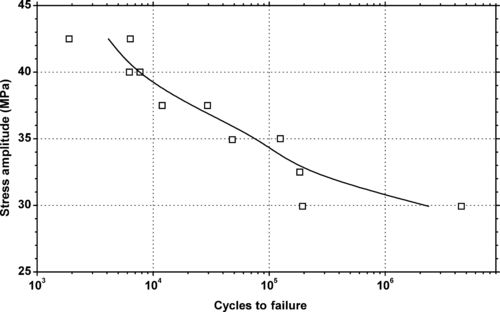
| Figure 12.18. |
| Tensile stress amplitude vs. cycles to failure at 90°C and 5Hz of two fiber reinforced Ticona Fortron® PPS plastics. |
 |
| Figure 12.19. |
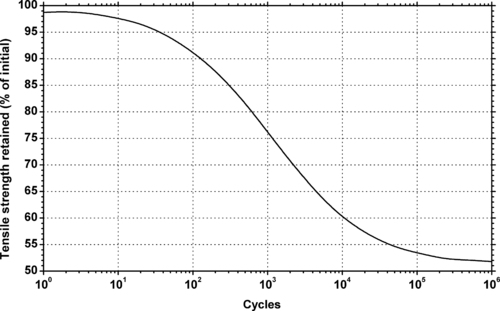
| Tensile strength retained vs. cycles to failure at 23°C and 10Hz of Chevron Phillips Chemical Ryton® A-200 PPS. |
 |
| Figure 12.20. |
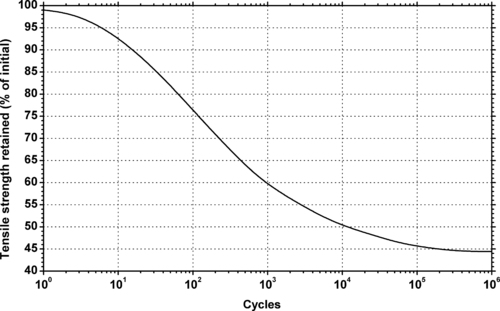
| Tensile strength retained vs. cycles to failure at 23°C and 10Hz of Chevron Phillips Chemical Ryton® R-4 02XT—40% glass fiber filled PPS. |
 |
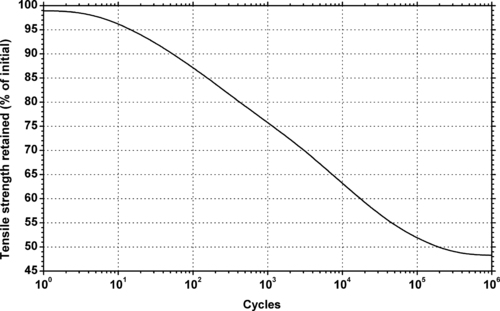
| Figure 12.21. |
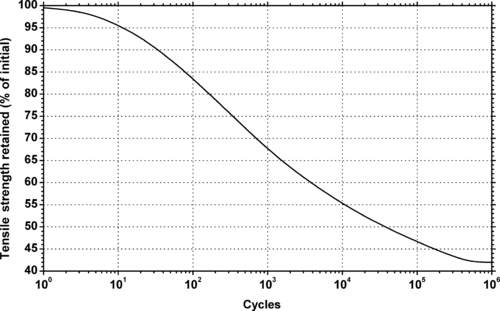
| Tensile strength retained vs. cycles to failure at 23°C and 10Hz of Chevron Phillips Chemical Ryton® R-4 04—40% glass fiber filled PPS. |
 |
| Figure 12.22. |
| Tensile strength retained vs. cycles to failure at 23°C and 10Hz of Chevron Phillips Chemical Ryton® R-7—65% glass fiber/mineral filled PPS. |
 |
| Figure 12.23. |
| Flexural stress amplitude vs. cycles to failure at 23°C and 10Hz of SABIC Innovative Plastics Supec® G401—40% glass fiber reinforced PPS. |
 |
| Figure 12.24. |
| Flexural stress amplitude vs. cycles to failure at 23°C and 10Hz of SABIC Innovative Plastics Supec® G620—40% glass fiber reinforced PPS. |
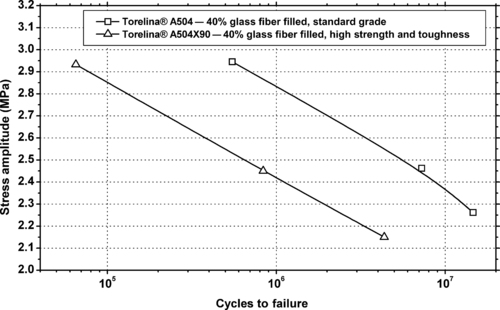 |
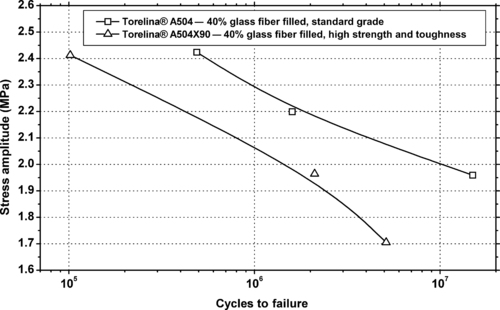
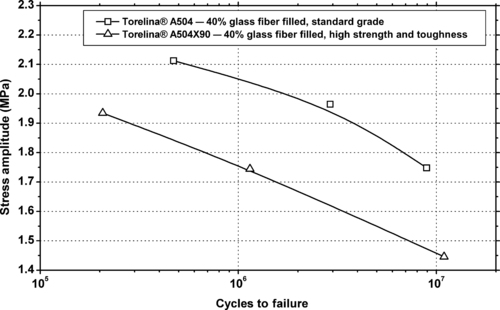
| Figure 12.25. |
| Stress amplitude vs. cycles to failure at 110°C and 2000Hz of two Toray Resin Company Torelina® PPS plastics. |
12.4.2. Tribology Data
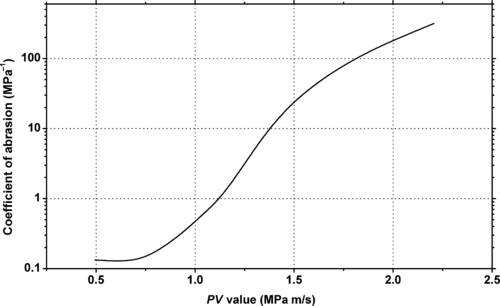 |
| Figure 12.28. |
| Coefficient of abrasion (against SCM21 steel) vs. PV value of Toray Resin Company Torelina® A504—40% glass fiber filled, standard grade PPS. |
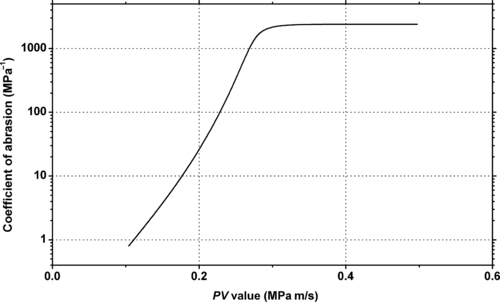 |
| Figure 12.29. |
| Coefficient of abrasion (against itself) vs. PV value of two Toray Resin Company Torelina® A504—40% glass fiber filled, standard grade PPS. |
12.5. Polysulfone
12.5.1. Fatigue Data

12.5.2. Tribology Data
..................Content has been hidden....................
You can't read the all page of ebook, please click here login for view all page.