20
Modular Production Timing Flexibility: We Explore the Timing Option to Pause and Restart the Project Any Time After its Commencement
The flexibility to delay the start of a project, which we explored in the previous chapter, is common. However, it is only one type of option for the timing of production in development projects. Indeed, Chapter 15 described three different types of timing options: overall project start timing, modular production timing, and phasing. We now look at the second of these.
Modular production timing flexibility is the option to pause the production process of a multi‐asset development project after the project has started. To enable developers to implement this flexibility, the project design has to consist of modules that can exist independently. This flexibility is thus an option “in” the project, in the meaning of Section 13.3. It is, in this sense, distinct and separate from the start‐delay option of Chapters 18 and 19, which is an option “on” the project.
20.1 Modular Production Timing Flexibility
We introduced the concept of modular production timing flexibility at a general level in Section 15.3. Here, we describe it in a little more depth, and relate it specifically to our Garden City project.
The essential idea of modular production is to give the developer the flexibility to vary the rate of production—for example, of housing units. In some cases, developers can accelerate their production schedule if the market becomes more favorable than anticipated. More commonly, the base plan specifies a normative rate of production. The flexibility that actually exists once the project has begun is effectively the ability to delay or pause the project. For practical purposes, the flexibility to time modular production is thus a defensive option.
We illustrate such an option using our Garden City project, producing housing units. The planning for such a development typically culminates in a base plan that envisions a certain schedule of production. The base plan for the Garden City project is a typical example (see Table 16.1). It specifies a temporal profile of the rate of housing unit production, calling for 144 units to be sold in the first year, 392 in the second year, and so on (850 units altogether).
We model the option to time production using a decision rule that triggers a pause in the sale of housing units in Garden City. This rule acts in years when the market price for housing is sufficiently unfavorable to cause the profitability of sales to dip below a specified threshold level. The simulation model thus reflects the decision rule as follows:
- If demand is stronger than expected, sales prices for the housing units will be higher than in the pro forma;
- If demand is lower than expected, sales prices will either be lower, or there will be a pause in the sales of any housing units if the delay option is triggered.
We model modular production timing as an all‐or‐nothing option within any given year of a future scenario. The amount of housing in the base plan for that year of the project will either sell out entirely or not be offered for sale at all, according to whether the decision rule triggers the pause option or not for that calendar year. The practical reality may be subtler than this (for example, partial sales are possible), but, for demonstration purposes, the all‐or‐nothing option well represents the essence of the type of flexibility that could exist. As previously mentioned (Section 17.1), it is important in any simulation analysis to balance the desire to make the model as complete and realistic as possible with the need to keep it sufficiently simple to be practical, and to present the big picture that matters to decision‐makers. We should always strive to “see the forest through the trees”!
20.2 Modeling the Modular Production Option
How can we conveniently represent in a computer spreadsheet the essence of the type of modular production timing flexibility described in the previous section? The guiding principle is to retain the general temporal pattern or “shape” (or “profile”) of the base plan production timing, only allowing for possible pauses that shift production to later. Put another way, we can open up gaps in the base plan production schedule, but otherwise preserving the temporal profile of that schedule. Figure 20.1a shows the production schedule in the base plan for the Garden City project, a repeat of Figure 16.2a. Figure 20.1b shows an actually realized production schedule in one randomly realized future scenario for the first 11 years. The relative and absolute temporal pattern of production is the same in both panels, except that the exercise of the option to delay production has introduced two gaps in the sequence in the lower panel. (We implement the introduction of this type of otherwise‐profile‐preserving gap using the “LOOKUP()” function referring to the base plan schedule—see details in the documentation of the Microsoft Excel® templates for this chapter available on the book’s companion website.)

Figure 20.1a Production schedule for the Garden City project’s base plan.

Figure 20.1b Production schedule for one future scenario with the option to delay (modular production timing flexibility).
In the DCF investment valuation, we implement the analysis of modular production flexibility in the same way as for the overall project start‐delay flexibility described in the previous chapter. We represent the flexibility to time modular production using delay decision rules entered as formulas into appropriate cells in the DCF spreadsheet. These rules implement the criteria for exercising the option to stop the project. We base these criteria on the combination of pricing factor realizations within each scenario and threshold trigger values that we specify. For example, in the present chapter, we assume the Simple Myopic Delay Rule, as in Chapter 19.
In detail, the decision rule governs the DCF analysis as follows. In any given year, in a given future scenario:
- If the average profitability of the housing sales based on the current year’s pricing factor realizations is below the input trigger value, then we pause the sale of units for that year.
- We check again the next year, and so on.
- As soon as there is a year that passes the criterion, we resume selling housing units at the rate indicated in the base plan schedule for the year where we left off selling houses.
Our model allows us to pause, or resume, in this fashion in any given year, up through a 24‐year horizon, after which our model cuts off the analysis. If the project is not complete by Year 24, we assume it will remain incomplete. (This cutoff is arbitrary, but far enough in the future that it has no significant economic impact.)
If we set the trigger value to zero, then this decision rule effectively sells houses only in years when the marginal profit is positive, relative to the base case. However, the exact, actual effect on cash flow is a bit more complicated in our Garden City project. Recall that buyers pay for sales in any year in three equal, consecutive annual installments, based on the price as of the year of the sales contract. Meanwhile, construction occurs equally during the following 2 years, reflecting construction costs prevailing as of those 2 subsequent years, and not in the preceding year when the trigger profit criterion prevailed and the house price was fixed. Nevertheless, construction costs are not nearly as variable as real estate market prices and are not highly correlated with those prices (see Section 11.2.) Thus, the Simple Myopic Delay Rule criterion typically plays out reasonably well in practice. Furthermore, and importantly, it seems to be a reasonably realistic decision rule. That is, it is probably not too different from the way production decisions are actually made in many development projects.
There is a guiding principle for the way we should formulate decisions about flexibility in the simulation model. Decision rules should be realistic, yet sufficiently simple and transparent so that users can easily understand them. It’s important for the actual managers, the decision‐makers, to be able to relate to the decision model and help to guide its realism.
20.3 Value of Modular Production Timing Flexibility
What is the value of the flexibility to time production in the modular manner described here? In Chapter 19, we saw that flexibility to delay the project overall tends to add about 5% to the apparent gross value of our typical Garden City project, effectively increasing the implied value of the land by about 20%. How does modular production timing flexibility compare to that?
Figures 20.2–20.5 compare the simulated distributions of investment outcomes for the Garden City project with modular production timing flexibility versus with no flexibility at all. No other type of flexibility is considered; the overall project must start immediately at Year 1. These target curves for NPV and IRR assume the base case values for the discount rate and land price (18%, $200 M), with the delay trigger set at zero. Thus, the differences in simulated outcomes in Figures 20.2–20.5 purely represent the value of the modular delay option by itself.
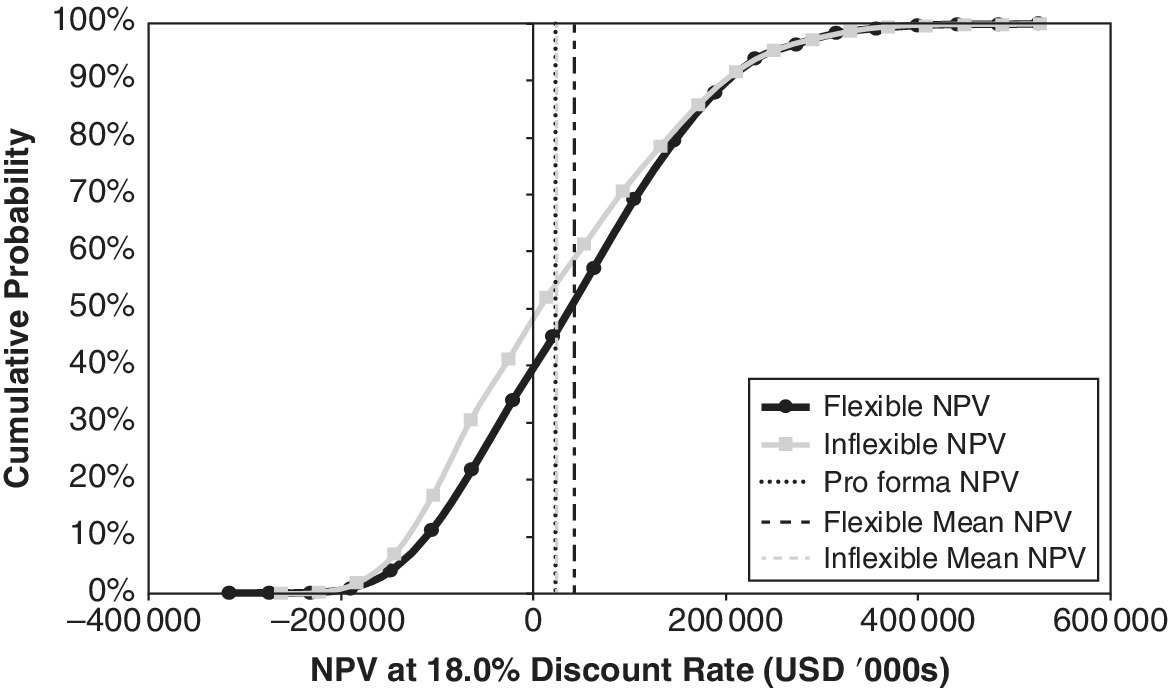


Modular production delay flexibility acts as a defensive option, as in the case of the overall start‐delay option analyzed in Chapters 18 and 19. It primarily shifts the downside (left‐hand) tail of the target curves to the right. As it hardly has any impact on the upside tail of the distribution, it also shifts the ex‐post mean outcome in a positive direction. However, this positive shift for the modular timing option is not as large as that from the overall start‐delay option. Its ex‐post mean NPV increases only to around $45 M (instead of $70 M with the start‐delay option). Still, this adds almost $20 M to the value of the project from the approximately $25 M NPV without considering any flexibility. The $20 M increase in expected NPV of the project is almost 3% of the gross present value of the project assets to be built.
Importantly from an investment perspective, the expected IRR (at the $200 M land price) increases to 26% with the production timing flexibility, from less than 20% without flexibility. And the standard deviation in the realized IRR reduces to around 15%, from 24%. The increase in mean IRR is only slightly less than what we observed in Chapter 19 with the overall project delay option.
The scatterplot of the joint IRR outcomes in Figure 20.6 reveals that modular production timing flexibility produces a higher IRR only slightly more often than the converse. But there is a strong downward slope in the scatterplot dot cloud. The dots below the zero‐difference horizontal axis are only in the lower‐right quadrant, and they are not as far below the axis as the dots in the upper‐left quadrant are above it. This means that the modular timing flexibility does a good job of providing downside protection, without sacrificing too much upside potential. There is, however, a tendency in moderately upside outcomes for the modular flexibility to modestly reduce the realized IRR, as compared to if there were no timing flexibility. This in part reflects a tendency of the zero trigger level to act too cautiously in the case of modular delay.
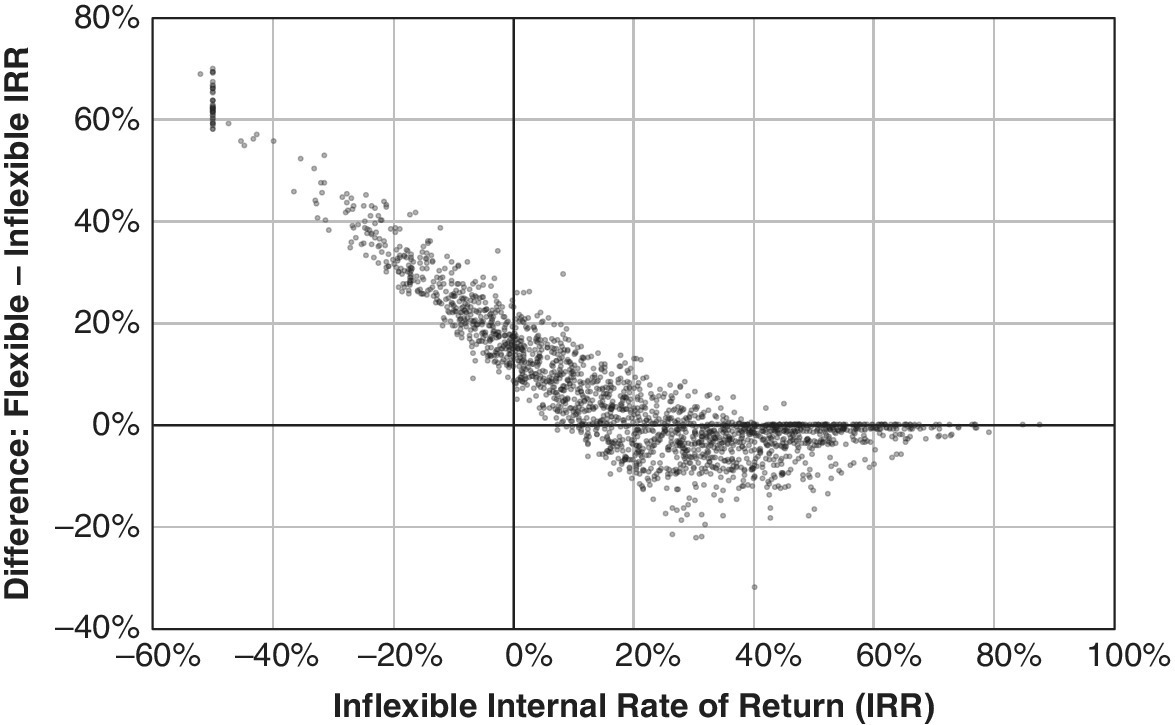
Figure 20.6 Scatterplot of IRR outcomes for modular production timing flexibility (Simple Myopic Delay Rule, trigger = 0).
20.4 Effect of Trigger Values (Bias toward Pause or Continue)
Analogous to the project start‐delay option, negative or positive levels of the Simple Myopic Delay Rule trigger value suggest a decision posture that is biased, respectively, either for, or against, continuing the project. In other words, negative triggers discourage pausing the production. Conversely, positive triggers encourage pausing the production, as they require more than just zero relative profit in order to continue the sales of housing units.
In contrast to what we saw in Chapters 18 and 19 with overall project start‐delay flexibility, in the case of modular start delay, it is better to be a bit aggressive, a bit biased against triggering the pause option, after the project has begun. In part, this may reflect the fact that infrastructure cost is likely to have already been sunk by the time the pause option might be triggered. With infrastructure cost sunk, there is a stronger NPV‐based argument to continue the project to completion.
Figure 20.7 reveals that the optimal trigger value for the modular delay option (by itself, without any other options) is approximately negative 20% (or even a little lower)—that is, it is on the “aggressive” side. The project should not be paused even if profitability is currently 20% below the base case of the pro forma. With the trigger set at negative 20%, modular delay flexibility increases the ex‐post mean NPV to over $50 M, more than a $25 M gain over the inflexible benchmark and base case pro forma NPV. This is more than $5 M greater than with the trigger set at the neutral value of zero.
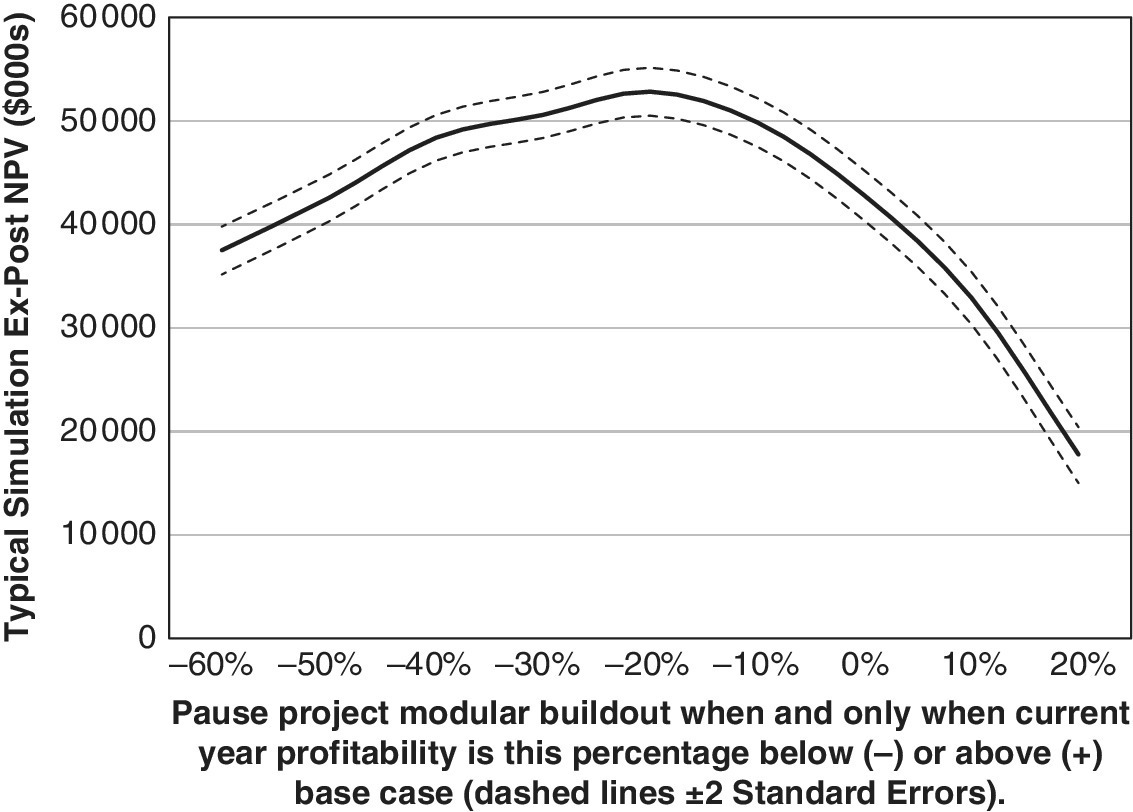
Figure 20.7 Effect of changing level of trigger value for modular production timing flexibility (Simple Myopic Delay Rule).
Interestingly, if one focuses only on the extreme downside of the investment performance outcomes, the 5% value at risk for NPV (see Chapter 8), Figure 20.8 suggests that we should be even more aggressive in the decision posture. It also reveals that, at the zero trigger, we delay completion of the project by 7 years on average, which seems excessive. Even at the –20% trigger, we are still delaying project completion by an average of 5 years. If we set the trigger value to –40%, we delay completion on average by 3 years, which seems more reasonable. The fact that the modular delay option can be repeatedly triggered means that it is best to be cautious about triggering the option. The developer should take a more aggressive posture to continue the project once it has begun. This contrasts with what works best with the option to delay the overall start of the project, which we examined in Chapter 19. In that case, the “neutral” trigger value of zero gave the best results. These differences make sense intuitively.

Figure 20.8 Effect of changing level of trigger value on downside results for modular production timing flexibility.
20.5 Effect of Combining Start‐Delay and Modular Production Delay Flexibility
As we noted previously, an important advantage of simulation modeling of flexibility over the formal option models popular among academic economists is that simulation can represent multiple options simultaneously. We have also seen that two different types of defensive timing options, to delay either the start of the project (Chapters 18 and 19) or the production of modules, each enhance project value significantly, but slightly differently. For example, in the Garden City project, the start‐delay option added some $45 M to the expected NPV of an otherwise identical project that does not have flexibility, while modular production timing flexibility added only about $25 M (in each case, based on setting the delay decision trigger at its optimal level for mean NPV enhancement). These two options for production timing are not necessarily mutually exclusive. A project might well have both types of flexibilities. How much additional value would we get with both options together?
Figures 20.9–20.12 show the joint value of both options together, compared to that of only the modular production flexibility that we focus on in this chapter. As you can see, adding start‐delay flexibility to modular production timing flexibility improves the overall investment performance of the project. For example, it increases the expected IRR from under 27% to over 28%, a gain of over 100 basis points. It also slightly reduces the IRR standard deviation from about 15% to barely over 14%. The dual option project beats the single‐option project in almost half of the scenarios, while only losing to the single‐option project a little over 5% of the time.


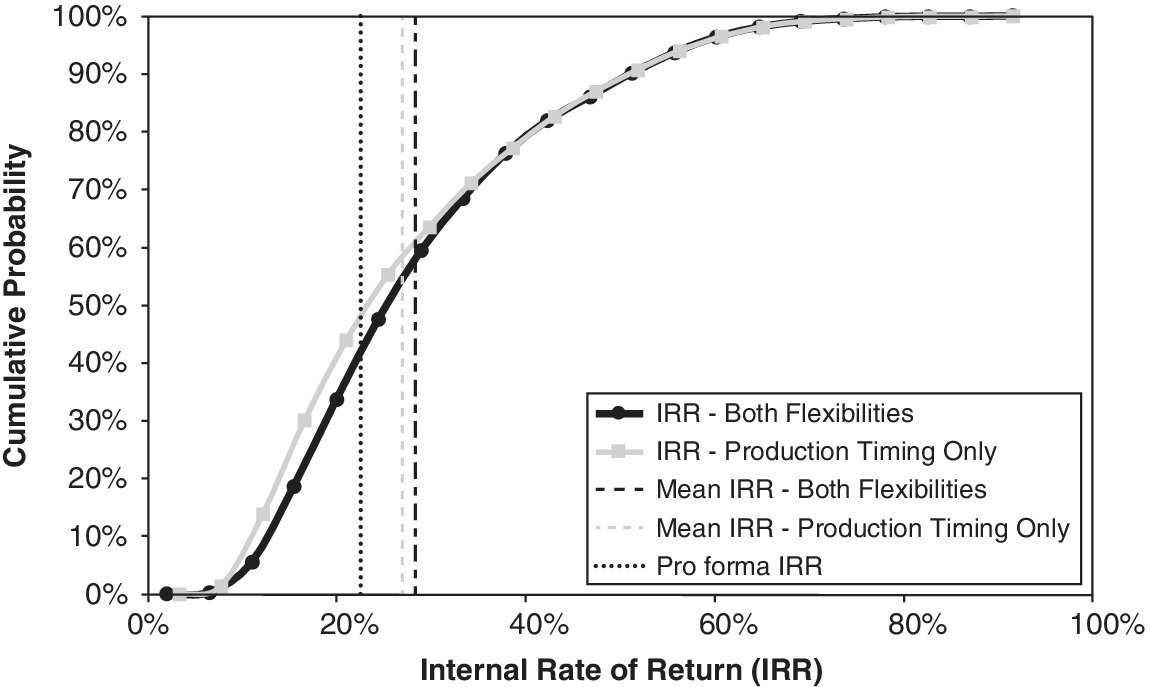
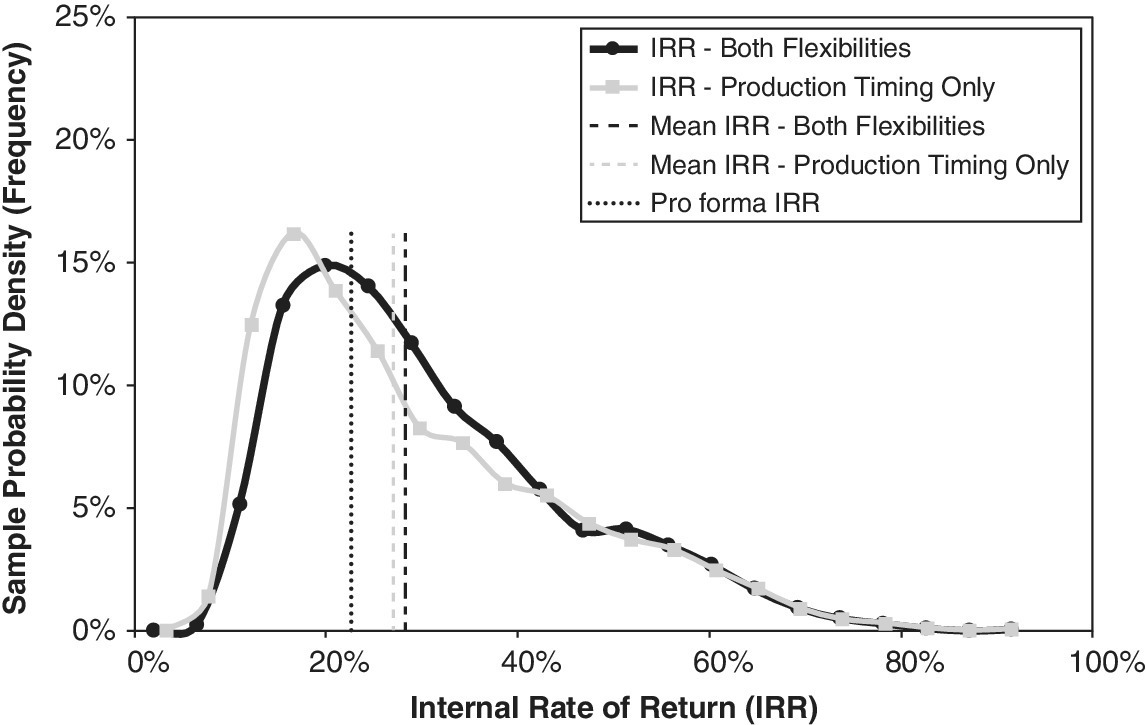
However, the dual option adds very little performance to the start‐delay option by itself. The mean NPV outcome is effectively no higher with both options than with just the start‐delay option. The two options together do reduce the downside of the IRR distribution in the extreme left‐hand tail, where the 5th percentile value at risk IRR is over 600 basis points higher than with just the start‐delay option (11% versus 5%), even though the mean IRR is just barely higher.
At least in terms of expectations (mean outcome values), it seems that, once full flexibility exists to delay the start of the project, subsequent modular production flexibility does not add much value to the project (although it may improve the extreme downside performance). In essence, once the developer has the opportunity to delay the start of the overall project, there is, apparently, rarely additional value to further delay in the subsequent production. This also helps explain why the optimal decision posture for the modular delay option is more aggressive (negative trigger level) to avoid pausing the project.
Yet, flexibility in production timing after the start of the project can be valuable. For example, the developer may face constraints on the ability to delay the start of the project. Financial, managerial, or political pressures may force the developer to be aggressive about starting the project. We saw in Chapter 18 how the Aggressive Developer Rule that we modeled resulted in a much smaller gain in value—only about $8 M increment in the expected NPV, and the expected IRR went up to only 21% (with almost 23% standard deviation). But the developer might well be less constrained once the project starts. There might be greater latitude to apply a more advantageous decision posture toward subsequent delays in the buildout of the project. In that case, our simulation model indicates that modular production timing flexibility clearly adds significant value to the project.
The general finding regarding multiple timing options seems to be that the individual options tend to duplicate each other to a considerable degree. Combining options certainly does no harm from an investment performance perspective (and may help the downside exposure), but the effects are far from additive. The value of multiple timing options is only slightly greater than the value of the best individual timing option by itself.
20.6 Conclusion
This chapter presented an in‐depth and quantitative study of the investment performance implications of modular production timing flexibility in real estate development projects, using our Garden City project as the illustrative example. We found that such flexibility adds importantly to the investment performance appeal of the project, although not as much as the basic option to delay the start of a project, which was the focus of Chapters 18 and 19.
We also explored the effect of combining the two types of timing options—start delay and production timing. We found that the combination of the two timing options is largely redundant in terms of investment performance. It produces an investment performance only slightly better than that of the better of the two options individually. In the following chapter, we will consider a different type of option, a product option instead of a timing option, as we explore product mix flexibility.
