
Chapter 11
Telling the Statistical Story
From Multivariate Data to the Modeling Process
What Is Data Mining?
A Framework for Predictive Analytics Techniques
The Goal, Tasks, and Phases of Predictive Analytics
References
From Multivariate Data to the Modeling Process
As you have read the early chapters, we hope you have come to realize we feel strongly that before discussing predictive analytics or performing a modeling project, one needs to understand how to deal with multivariate data. That is one of the book’s main objectives. In particular, one needs a foundation beyond the univariate/bivariate analysis taught and learned in a basic statistics course to understand some of the issues when dealing with real-world, that is, multivariate, data. Hopefully, we have achieved that goal in the previous chapters. Now, we feel you are better prepared to understand data mining/predictive analytics/predictive modeling and to conduct a modeling project. The objective of this chapter is to provide a basic overview to data mining/predictive analytics/predictive modeling and to the modeling process using JMP.
For the past 25 years, the big buzzword in the BA area has been data mining. The roots of data mining techniques run deep and can be traced back to three areas—statistics, artificial intelligence (AI), and machine learning. All data mining tools and techniques have a strong foundation based on classical statistical analysis. In the 1970s and 1980s, AI techniques based on heuristics that attempted to simulate human thought processes were developed. Subsequently the field of machine learning, which is the union of statistics and AI, evolved. An example of machine learning is a computer program that learns more about the game of chess as it plays more and more games.
Two areas of early successful application of data mining have been credit card fraud detection and customer relationship management (CRM).
Based on analyzing customers’ historical buying patterns, data mining models identify potential credit card fraud in transactions that are out of the “norm.” For example, let’s say you have never traveled to South America, but you happen to want to go to the World Cup in Brazil in 2014. So, you book a flight to Brazil and charge it on your credit card. While in Brazil you thought it would be nice to go on a few side trips—for example, to see Iguassu Falls. You then book a flight and accommodations and tour package with your credit card. Subsequently, you receive an e-mail from your credit card company saying that your card transactions are temporarily suspended and please contact them. The credit card company wants to make sure your card has not been stolen because you were making significant purchases outside your normal spending pattern. Data mining models are used to target such behavior.
The other area of early successful data mining applications is customer relationship management (CRM). CRM is a process/business strategy taken by companies to improve overall customer satisfaction, especially for their best customers. For example, large companies with multiple product offerings may have several customers that buy products across the company’s product line. However, each division of the company may have separate sales and support staff as well as their own independent database. A CRM solution to this situation would be one company-wide database that allows everyone in the company to access the data on a particular customer, which improves customer satisfaction and promotes cross-selling opportunities.
SAS provides numerous customer stories of successful data mining/statistical applications that use JMP in several industry areas (aerospace, conservation, education, energy, genomics, government, health care, manufacturing, pharmaceuticals, and semiconductor) and by statistical application areas (see JMP Customer Stories).
What Is Data Mining?
A broad definition of data mining is a process of finding patterns in data to help us make better decisions. Or more simply, as a good old friend of ours would say, it is mining data. In a nutshell, he is basically right. Furthermore, let’s put forward this quote
(Ewen, 1996) from the New York Times:
Probably at no time in the last decade has the actual knowledge of consumer buying habits been as vital to successful and profitable retailing as it is today.
However, this statement was written in 1931. So data mining is not new, and successful decision makers have always done this. Then, why has the area of data mining grown so much recently? What has changed? The change has been the confluence of the three areas of data mining: (1) statistics, AI, and machine learning; (2) the exponential increase in our computer power; and (3) our scale of data accumulation have amplified this new area called data mining.
Nonetheless, data mining is not the current buzzword anymore. It has been replaced by the terms predictive analytics and predictive modeling. What is the difference in these terms? As we discussed, with the many and evolving definitions of business intelligence in Chapter 1, these terms seem to have many different yet quite similar definitions. One SAS expert defines these terms as follows:
Data mining has been defined in a lot of ways, but at the heart of all of those definitions is a process for analyzing data that typically includes the following steps:
□ Formulate the problem
□ Accumulate data.
□ Transform and select data.
□ Train models
□ Evaluate models.
□ Deploy models.
□ Monitor results.
Predictive analytics is an umbrella term that encompasses both data mining and predictive modeling–as well as a number of other analytical techniques. I define predictive analytics as a collection of statistics and data mining techniques that analyze data to make predictions about future events. Predictive modeling is one such technique that answers questions such as:
□ Who's likely to respond to a campaign?
□ How much do first-time purchasers usually spend?
□ Which customers are likely to default?
Predictive analytics is a subset of analytics, which more broadly includes other areas of statistics like experimental design, time series forecasting, operations research and text analytics1.
A Framework for Predictive Analytics Techniques
Even with all these buzzword terminology variations, there appear to be two major characterizations of the terms data mining, predictive analytics, and predictive modeling. One point of view to view them as a collection of advanced statistical techniques. The other major point of view is to view them as a modeling process.
From the first point of view, several approaches have been used to classify data mining/predictive analytics/predictive modeling2. We categorize these predictive analytics techniques into supervised (directed) or unsupervised (undirected) learning techniques as shown in Figure 11.1.
With the unsupervised learning techniques, there is no target, or dependent variable(s). Beyond the discovery tools and multivariate techniques of Principal Component Analysis, Factor Analysis, and clustering that we discussed in this book, an example of an unsupervised learning predictive analytics technique is association rules (or market basket analysis or affinity grouping). With the association rules technique, we try to identify which things (in most cases, products) go together. For example, when you go grocery shopping, which products are sold together? An example would be milk and cereal or the unexpected classic data mining example of diapers and beer.
Figure 11.1 A Framework for Predictive Analytics Techniques
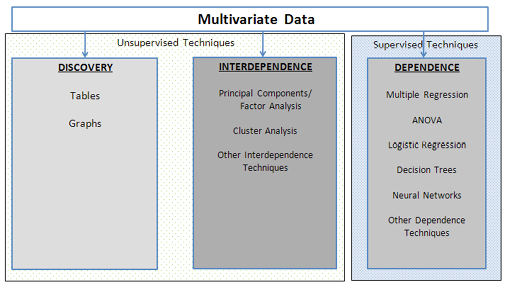
With supervised learning techniques, the goal is to develop a model that describes one (or possibly more than one but in most situations only one) variable of interest. The goal is to establish some relationship(s) among the variables. We have examined several such supervised techniques in this book: regression, logistic regression, ANOVA, decision trees, and neural networks. The decision tree and neural networks techniques are usually considered supervised learning predictive analytics techniques.
Finally, notice that in classifying and listing these predictive analytics techniques (Figure 11.1), we do include the basic statistical tools and techniques that you learned in the introduction to statistics as well as the multivariate techniques we discussed in this book. These tools and techniques are also part of predictive analytics and the modeling process.
The Goal, Tasks, and Phases of Predictive Analytics
The goal of data mining/predictive analytics/predictive modeling/advanced statistical techniques, supervised or unsupervised, is to extract information from the data. The six main tasks of predictive analytics are listed below with their associated activities:
■ discovery: describing, summarizing, and visualizing the data and developing a basic understanding of their relationships.
■ classification: classifying each object to a predefined set of classes or groups.
■ estimation: similar to classification but the dependent/target variable is continuous.
■ clustering: segmenting each object into a number of subgroups or clusters. The difference between classification and clustering is that with clustering the classes or groups are not predefined but are developed by the technique.
■ association: determining which items go together (e.g., which items are brought together/concurrently).
■ prediction: identifying variables that are related to (a) variable(s) so as to predict or estimate their future values.
The tasks of discovery, clustering, and association are all examples of unsupervised (undirected) learning. The other three tasks—classification, estimation, and prediction—are examples of supervised (directed) learning.
In this text, we have examined several of the fundamental data mining/multivariate techniques/advanced statistical techniques: discovery tools, clustering, Principal Component Analysis and Factor Analysis, ANOVA, regression, logistic regression, decision trees, neural networks, and model comparison. JMP is a comprehensive statistical and predictive analytics package. So, in addition to the JMP techniques/tools we discussed in the text, JMP also provides other predictive analytics/multivariate techniques such as conjoint analysis (in particular, discrete choice analysis) as well as several other statistical techniques.
So, what are the differences between statistics and data mining/predictive analytics/predictive modeling? This question is difficult to answer. First, both disciplines share numerous similar tools and techniques. However, both disciplines are much more than several tools and techniques. The major differences seem to lie in their objectives and processes. The broadening of the definition for predictive analytics from a collection of statistical techniques to a process is the second point of view3 of predictive analytics.
Berry and Linoff (2004) define data mining as “a business process for exploring a large amount of data to discover meaningful patterns and rules”. The phases of the data mining process are listed in Table 11.1. This process is not necessarily linear; that is, you do not always proceed from one phase to the next listed phase. Many times, if not most of the time, depending on the phase’s results, the data mining project may require you to go back one or more phases. The process is usually iterative.
Table 11.1 The Phases of the Data Mining Process and the Percentage of Time Spent on Each Phase
|
Data Mining Process |
|
|
Project definition |
(5%) |
|
Data collection |
(20%) |
|
Data preparation |
(30%) |
|
Data understanding |
(20%) |
|
Model development and evaluation |
(20%) |
|
Implementation |
(5%) |
As you can see from Table 11.1, what we have discussed in this book concerns only 20% of the time spent on a data mining project: model development and evaluation. While “data understanding” does require some use of statistics (scatterplots, univariate summary statistics, etc.), easily 50% of the analyst’s time will be spent on the mundane and tedious tasks of data preparation and data understanding. These critical tasks are beyond the scope of this book. But we wish to note that very little is written about them, which makes learning about these topics difficult. There is a notable exception, though—the excellent book by Pyle (1999). We recommend it to anyone who wishes to understand the basics of data collection and understanding.
Often in statistical studies, the study’s objectives are well defined, so the project is well focused and directed. The data is collected to answer the study’s specific questions. A major focus of most statistical studies/processes is to draw inferences about the population based on the sample.
While on the other hand in many predictive analytics projects, besides having a significantly large data set, in many cases, the data is the entire population, thus, making statistical inference a moot point. The data in a predictive analytics project is rarely collected with a well-defined objective of analysis, and it is usually retrieved from several data sources. As a result, unlike most statistical studies, the data must be integrated from these different sources and appropriately aggregated. Just like statistical studies, the data in a data mining project must be cleaned and prepared for analysis. However, due to the numerous sources of data and the usually larger number of variables, this phase of the process is much more labor intensive. Both processes share the same concern: to develop an understanding, description, and summary of the data.
The primary phase of the data mining/predictive analytics modeling process, which many people would define as data mining/predictive analytics (the first point of view), is the model development and evaluation phase. This phase may account for only about 20% of the project’s overall efforts (mainly because of the large amount of effort to integrate and prepare the data).
SAS Institute Inc. developed a systematic approach to this phase of the data mining process called SEMMA (Azevedo and Santos, 2008):
S—Sample: If possible (that is, if you have a large enough data set), extract a sample that contains the significant information yet is small enough to process quickly. The part of the data set that remains may be used to validate and test the model developed.
E—Explore: Use discovery tools and various data reduction tools to further understand data and search for hidden trends and relationships.
M—Modify: Create, transform, and group variables to enhance the analysis.
M—Model: Choose and apply one or more appropriate data mining techniques.
A—Assess: Build several models using multiple techniques; evaluate, assess the usefulness, and compare the models results. If a small portion of the large data set was set aside during the sample stage, validate and test the model.
Once the “best” model is identified, the model is deployed, and the ROI from the data mining process is realized.
The objective of the model development and evaluation phase is to uncover unsuspected but valuable relationships. So you search until you find a model that fits the data set arbitrarily well, so that it is not overly complex and the model does not overfit the data. Statisticians become concerned with such a data-driven analysis approach to obtain a good fit because they are aware that such a search could lead to relationships that happen purely by chance. Unlike most statistical studies, predictive analytics projects are less focused on statistical significance and more on the practical importance—i.e., on obtaining answers that will improve decision making. Nevertheless, even though objectives and processes may differ, the bottom line of statistical studies and data mining projects is to learn from the data.
We hope this book has provided you with a foundation to conduct a statistical study (or a predictive analytics project) and planted the seeds on how to write a statistical story. Happy story-telling!
References
Azevedo, A., and M. F. Santos. (2008). “KDD, SEMMA and CRISP-DM: a parallel overview,” Proceedings of the IADIS European Conference on Data Mining.
182–185.
Berry, M. J. A., and G. S. Linoff. (2004). “Data Mining Techniques: For Marketing, Sales, and Customer Relationship Management.” 2nd Ed. Indianapolis: Wiley Publishing, Inc. 2.
Ewen, Stuart. (1996). PR!: A Social History of Spin. New York, NY: Basic Books. 184.
JMP Customer Stories. http://www.jmp.com/software/success/alphabetical.shtml.
Pyle, Dorian. (1999). Data Preparation for Data Mining. San Francisco: Morgan Kaufmann.
(Endnotes)
1 http://www.sas.com/news/sascom/2010q1/column_tech.html
2 Remember that we use these terms interchangeably, to mean the same thing.
3 This broadening definition of predictive analytics is reflective of the maturity of the discipline.