
Chapter 1
Introduction
Two Questions Organizations Need to Ask
Return on Investment (ROI)
Culture Change
Business Intelligence
Clarification
Book Focus
Introductory Statistics Courses
Practical Statistical Study
Plan Perform, Analyze, Reflect (PPAR) Cycle
References
In 1981, Bill Gates made his infamous statement that “640KB ought to be enough for anybody.”
Looking back even further, about 10 to 15 years prior to the Bill Gates statement, we were in the middle of the Vietnam era. State-of-the-art computer technology for both commercial and scientific areas at that time was the mainframe computer. A typical mainframe computer weighed tons, took an entire floor of a building, had to be air-conditioned, and cost about $3 million. Mainframe memory was approximately 512KB with disk space of about 352 MB and speed up to 1MIPS.
In 2011, only forty years later, an iPhone 4 with 32GB memory has about 9300% more memory than the mainframe and fits in our hands. A laptop with the Intel Core i7 processor has speeds up to 147,600 MIPS, about 150,000 times faster than the old mainframe, and weighs about 4 pounds. Further, an iPhone or a laptop costs significantly less than $3 million. As Ray Kurzweil, an author, inventor, and futurist has stated (Lomas, 2008):
“The computer in your cell phone today is a million times cheaper and a thousand times more powerful and about a hundred thousand times smaller (than the one computer at MIT in 1965) and so that’s a billion-fold increase in capability per dollar or per euro that we’ve actually seen in the last 40 years.”.
Technology has certainly changed!
Two Questions Organizations Need to Ask
Return on Investment (ROI)
With this new and ever improving technology, most organizations (and even small organizations) are collecting an enormous amount of data. Each department has one or more computer systems. A number of organizations are now integrating these department-level systems with organization systems, such as an ERP (enterprise resource planning) system. Newer systems are being deployed that store all these historical enterprise data in what is called a data warehouse. The IT budget for most organizations is a significant percentage of the organization’s overall budget and is growing. The question is:
With the huge investment in collecting this data, do organizations get a decent ROI (return on investment)?
The answer: mixed. No matter if the size of the organization is large or small, only a limited number of organizations (yet growing in number) are using their data extensively. Meanwhile, most organizations are drowning in their data and struggling to gain some knowledge from it.
Culture Change
How would managers respond to this question?:
What are your organization’s two most important assets?
Most managers would answer with their employees and the product or service that the organization provides (they may alternate which is first or second).
The follow-up question is more challenging:
Given the first two most important assets of most organizations, what is the third most important asset of most organizations?
The answer is: the organization’s data! To most managers, regardless of the size of their organizations, this would be a surprise. However, consider the vast amount of knowledge that’s contained in customer or internal data. For many organizations, realizing and accepting that their data is the third most important asset would require a significant culture change.
Rushing to the rescue in many organizations is the development of business intelligence (BI) programs and groups. What is business intelligence (BI)? It seems to vary greatly depending on your background.
Business Intelligence
Business Intelligence is considered by most people as providing IT systems, such as dashboards and online analytical processing (OLAP) reports, to improve business decision-making. Howard Dresner, considered to be the “father” of business intelligence, expanded this definition of BI in 2006 (WhatIs.com, 2006) to be a “broad category of applications and technologies for gathering, storing, analyzing, and providing access to data to help enterprise users make better business decisions. BI applications include the activities of decision support systems, query and reporting, online analytical processing (OLAP), statistical analysis, forecasting, and data mining.”
Figure 1.1 presents a framework that shows the relationships of the three discipline (Information Technology, Statistics and Operations Research) components in this expanded definition of BI (Klimberg and Miori, 2010). “With this new vision, we may now characterize BI from each of three viewpoints as: business information intelligence (BII), business statistical intelligence (BSI), and business modeling intelligence (BMI). Each of the viewpoints has particular business aspects, and academically speaking, courses that are independent of the other viewpoints.”
Figure 1.1 A Framework of Business Intelligence [3]
![Figure 1.1 A Framework of Business Intelligence [3]](http://imgdetail.ebookreading.net/other/5/9781612906232/9781612906232__fundamentals-of-predictive__9781612906232__images__Image500_fmt.png)
This expanded scope of BI and its growing applications have revitalized an old term: business analytics (BA). BA, in our framework, is a combination of business statistics intelligence (BSI) and business modeling intelligence (BMI): BA = BSI + BMI. Davenport (Davenport and Harris, 2007) views BA as “the extensive use of data, statistical and quantitative analysis, explanatory and predictive models, and fact-based management to drive decisions and actions.”
Davenport further elaborates that organizations should develop an analytics competency as a “distinctive business capability” that would provide the organization with a competitive advantage.
The buzzword in this area of BA for about the last 25 years has been the term data mining. Until recently. The current buzzwords are predictive analytics and predictive modeling. What is the difference in these terms? As we discussed, with the many and evolving definitions of business intelligence, these terms seem to have many different yet quite similar definitions. In this text, we will not distinguish between data mining, predictive analytics, and predictive modeling and will use them interchangeably to mean or imply the same thing. In Chapter 11, we will briefly discuss their different definitions.
Clarification
The labels business intelligence, business information intelligence, business statistics intelligence, and business modeling intelligence are not limited to the business sector. Even though these labels have “business” in front of them, the application of the techniques and tools within each of these disciplines can be and are used in the public and social sectors. In general, wherever data is collected, these tools and techniques can be applied.
Book Focus
This book focuses on the business statistics intelligence (BSI) component of BA. In particular, given that you have likely taken a basic introduction to statistics course, this book will discuss visualization tools and multivariate statistical tools (such as, clustering analysis, principal components, and logistic regression) and processes to perform a statistical study that may include data mining/predictive analytics techniques. Some real-world examples of using these techniques are target marketing, customer relation management, market basket analysis, cross-selling, market segmentation, customer retention, improved underwriting, quality control, competitive analysis, fraud detection, and management and churn analysis. Specific applications can be found at http://www.jmp.com/software/success/. The bottom line, as reported by the KDNuggets poll (2008): the median ROI for data mining projects is in the 125–150% range.
The primary objective of this book is to provide a bridge from your introduction to statistics course to practical statistical analysis. For the most part, your introductory statistics course has not completely prepared you to move on to real-world statistical analysis.
Introductory Statistics Courses
Most introductory statistics courses (outside the mathematics department) cover the topics of descriptive statistics, probability, probability distributions (discrete and continuous), sampling distribution of the mean, confidence intervals, one-sample hypothesis testing, and perhaps two-sample hypothesis testing, simple linear regression, multiple linear regression, and ANOVA. (Yes, multiple linear regression and ANOVA are multivariate techniques, but the complexity of the multivariate nature is for the most part not addressed in the introduction to statistics course. One main reason—not enough time!) Nearly all the topics, problems, and examples in the course are directed toward univariate (one variable) or bivariate (two variables) analysis. Univariate analysis includes techniques to summarize the variable and make statistical inferences from the data to a population parameter. Bivariate analysis examines the relationship between two variables (e.g., the relationship between age and weight).
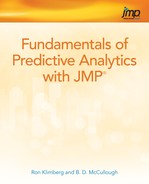
A typical student’s understanding of the components of a statistical study is shown in Figure 1.2. If the data is not available, a survey is performed or the data is purchased. Once the data is obtained, the statistical analyses are done all at once—start Excel and/or a statistical package, draw the appropriate graphs and tables, perform all the necessary statistical tests, and write up/present the results. And then you are done. With such a perspective, many students simply look at this statistics course as another math course and may not realize the importance and consequences of the material.
Figure 1.2 A Student’s View of a Statistical Study from a Basic Statistics Course
These first statistics courses provide a good foundation to introducing statistics. However, these courses provide a rather weak foundation for performing practical statistical studies. First, most real-world data are “dirty.” Dirty data are erroneous data. A simple example of dirty data is if a data field/variable to represent gender is supposed to be coded as either M or F, and we find in the field the letter N or even perhaps it is blank. Learning to identify dirty data and determining corrective action is a fundamental skill to have in analyzing real-world data.
Second, most practical statistical studies have data sets that include more than two variables, called multivariate data. Multivariate analysis uses some of the same techniques and tools used in univariate and bivariate analysis as covered in the introductory statistics courses, but in an expanded and much more complex manner. Additionally, when performing multivariate analysis, you would be exploring the relationships among several variables. There are several multivariate statistical techniques and tools to consider that are not covered in a basic applied statistics course.
Before jumping into multivariate techniques and tools, students need to learn the univariate and bivariate techniques and tools that are taught in the basic first statistics course. However, in some programs this basic introductory statistics class may be the last data analysis course required or offered. Many other programs that do offer/require a second statistics course offer just a continuation of the first course and may or may not cover ANOVA and/or multiple linear regression. (Although these techniques are multivariate. we are looking for a statistics course beyond multiple linear regression.) In either case, the students are ill-prepared to apply statistics tools to real-world multivariate data. Perhaps, with some minor adjustments, real-world statistical analysis can be introduced into these programs.
On the other hand, with the growing interest in BI, BA, and data mining/predictive analytics, more programs are offering and sometimes even requiring a subsequent statistics course, in data mining/predictive analytics. So, most students jump from univariate/bivariate statistical analysis to statistical data mining/predictive analytics techniques, which include numerous variables and records. These statistical data mining/predictive analytics techniques require the student to understand the fundamental principles of multivariate statistical analysis and more so, to understand the process of a statistical study. In this situation, many students are lost, and this simply reinforces the students’ view that the course is just another math course.
Even with these multivariate shortcomings, there is still a more significant multivariate concern to address. That is the idea that most students view statistical analysis as a straightforward exercise in which you sit down in front of your computer and just perform the necessary statistical techniques and tools, as in Figure 1.2. How boring! With such a viewpoint, this would be like telling someone that reading a book can simply be done by reading the book cover. The practical statistical study process of uncovering the story behind the data is exciting.
Practical Statistical Study
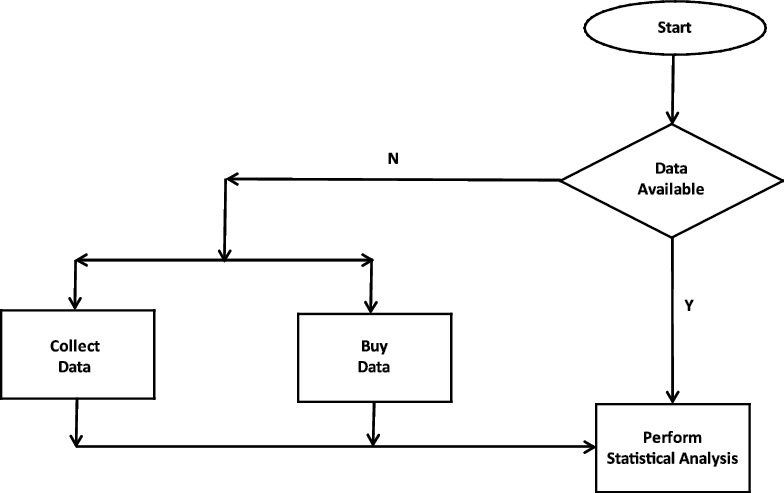
The prologue to a practical statistical study is determining the proper data needed, obtaining the data, and if necessary cleaning the data (the dotted area in Figure 1.3). Answering the questions “Who is it for?” and “How will it be used?” will identify the suitable variables required and the appropriate level of detail. Depending upon who will use the results and how they will use them dictates which variables are necessary and the level of granularity. If there is enough time and the essential data is not available, then the data may be obtained either by a survey or purchased. Lastly, once the data is available, if necessary, the data should be cleaned; i.e., eliminate erroneous data as much as possible.
Figure 1.3 The Flow of a Real-World Statistical Study
The statistical study (the enclosed dashed-line area in Figure 1.3) should be like reading a book—the data should tell a story! Part of the story is data discovery—discovery of significant and insignificant relationships among the variables and the observations in the data set. The story develops further as many different statistical techniques and tools are tried. Some will be helpful, some will not. With each iteration of applying the statistical techniques and tools, the story develops and is substantially further advanced when you relate the statistical results to the actual problem situation. As a result, your understanding of the problem and how it relates to the organization is improved. By doing the statistical analysis, you will make better decisions (most of the time). Furthermore, these decisions will be more informed so that you will be more confident in your decision. Finally, uncovering and telling this statistical story is fun!
Plan, Perform, Analyze, Reflect (PPAR) Cycle
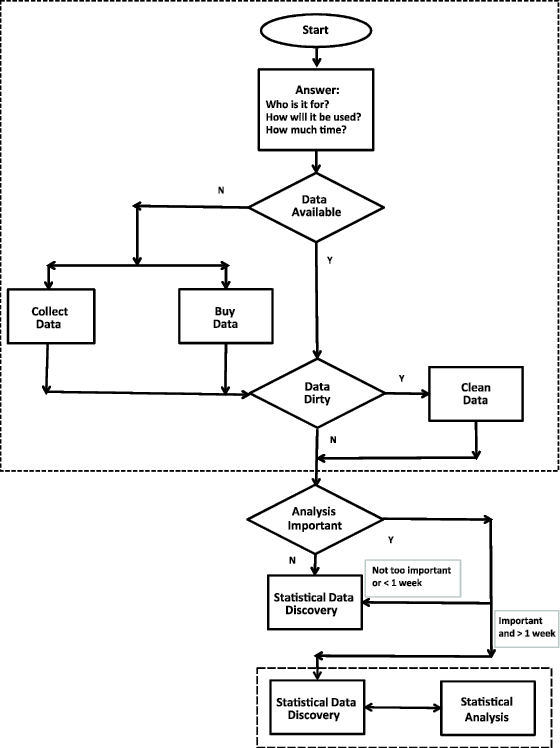
The development of the statistical story follows a process that we call the PPAR (PLAN, PERFORM, ANALYZE, REFLECT) cycle, as shown in Figure 1.4. The PPAR cycle is an iterative progression. The first step is to plan which statistical techniques or tools are to be applied. You are combining your statistical knowledge and your understanding of the business problem being addressed. You are asking pointed, directed questions to answer the business question by identifying a particular statistical tool or technique to use.
The second step is to perform the statistical analysis, using statistical software such as JMP. The third step is to analyze the results using appropriate statistical tests and other relevant criteria to evaluate the results. The fourth step is to reflect on the statistical results. Ask questions, like what do the statistical results mean in terms of the problem situation? What insights have I gained? Can we draw any conclusions? Sometimes, the results are extremely useful, sometimes meaningless, and sometimes in the middle—a potential significant relationship.
Then, it is back to the first step to plan what to do next. Each progressive iteration provides a little more to the story/understanding of the problem situation. This cycle continues until you feel you have exhausted all possible statistical techniques or tools (visualization, univariate, bivariate, and multivariate statistical techniques) to apply or you have enough results such that the story is completed.
Figure 1.4 The PPAR Cycle
The software used in many initial statistics courses is Microsoft Excel, which is easily accessible and provides some basic statistical capabilities. However, as you advanced through the course, because of Excel’s statistical limitations, you may have also used some non-professional, textbook-specific statistical software or perhaps some professional statistical software. Excel is not a professional statistics software application; it is a spreadsheet.
The statistical software application used in this book is the SAS JMP statistical software application. JMP has the advanced statistical techniques and the associated, professionally proven, high-quality algorithms of the topics/techniques covered in this book. Nonetheless, some of the early examples in the textbook use Excel. The main reasons for using Excel are twofold: (1) To give you a good foundation before we move on to more advanced statistical topics, and (2) JMP can be easily accessed through Excel as an Excel Add-In, which is an approach many will take.
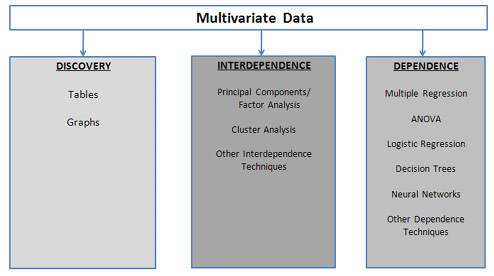
In this book, we first review basic statistics and expand on some of these concepts to include multivariate techniques. Subsequently, we examine several multivariate techniques (principal components, cluster analysis, ANOVA, multiple regression, and logistic regression). The framework we will use in this book of statistical and visual methods is shown in Figure 1.5. In introducing each technique, we will provide a basic statistical foundation to help you understand when to use the technique and how to evaluate and interpret the results. Additionally, step-by-step directions are provided to guide you through an analysis using the technique. The last section of the book introduces the data mining/predictive analytics process and one of its more popular techniques (decision trees). In discussing these data mining/predictive analytics techniques, the same approach used with the multivariate techniques is taken—understand when to use it, evaluate and interpret the results, and follow step-by-step instructions. The overall objectives of the book are not only to introduce you to multivariate techniques and data mining/predictive analytics, but, to provide a bridge from univariate statistics to practical statistical analysis by instilling the PPAR cycle.
Figure 1.5 A Framework for Multivariate Analysis
References
Davenport, Thomas H., and Jeanne G. Harris. (2007). Competing on Analytics: The New Science of Winning. Cambridge, MA: Harvard Business School Press.
Klimberg, Ronald. K., and Virginia Miori. (October 2010). “Back in Business.” ORMS Today, Vol. 37, No. 5, 22–27.
Lomas, Natasha. (November 19, 2008). “Q&A: Kurzweil on tech as a double-edged sword.” CNET News. CBS Interactive. http://news.cnet.com/8301-11386_3-10102273-76.html.
Poll: Data Mining ROI. http://www.kdnuggets.com/polls/2008/roi-data-mining.htm.
WhatIs.com. http://whatis.techtarget.com/.