
In software, the chain isn’t as strong as its weakest link; it’s as weak as all the weak links multiplied together. | ||
| --Steve C McConnell | ||
A common concern about using managed code and the .NET platform is the idea that control over the allocation and deallocation of memory is handled by an automated process, otherwise known as the garbage collector (GC) intrinsic to the Common Language Runtime. Automated memory management has been around for quite some time, most notably in the Java world, but there have been some innovative deviations from the norm to produce a more efficient and better performing garbage collector. One reason that C++ developers generally feel uneasy making the transition from unmanaged to managed code is because they love the control and power offered by such a low-level language and do not wish to give it up. On the other hand, those same developers are torn because even experienced C++ developers have to utilize patterns like smart pointers to produce reliable software.
The inner workings of the GC are by no means simplistic, resulting in developers making mistakes that considerably degrade performance. Although the .NET runtime handles a lot of the nitty gritty aspects of automated memory management, there are some best practices that should be followed to maximize performance in this area. This topic covers some of the proper ways to work with managed data and the .NET garbage collector.
The CLR garbage collector is a generational mark-and-compact collector (also known as an ephemeral garbage collector), offering excellent performance and efficiency by taking some fundamental notions into consideration. The primary notion is that short-lived objects tend to be smaller and are accessed more often. The GC divides the memory allocation graph into sub-allocation graphs titled generations, each with a specific purpose. The three generations are shown in Table 34.1.
Table 34.1. CLR Garbage Collector Generations
Generation | Description |
|---|---|
Generation 0 ( | This generation contains newly allocated objects that are frequently used. This generation is typically the smallest in size, taking roughly 10 milliseconds to collect. |
Generation 1 ( | This generation is for larger and older objects that are used infrequently. When |
Generation 2 ( | This generation is for larger and older objects that are used infrequently, except it is also a full collection that can be optimized for intelligent CPU caching by the underlying system if supported. |
The managed heap originally starts in an empty state. Objects that are allocated initially go into the generation 0 portion. When a collection occurs, the GC determines which objects are garbage (no more references pointing to them) and which objects are surviving and need to be compacted. When an object is compacted, it moves into an older generation.
Currently there are three generations, but you can query the maximum number of generations if needed. You do so by getting the value from the GC.MaxGeneration property, which will always return 2. This may change in future versions of the GC. Any objects in generation 2 that get compacted will remain in generation 2. More information on interacting with the garbage collector is covered later in this chapter.
The main advantage of a generational garbage collector is that collections of a portion of the heap take less time than collecting the entire heap. The garbage collector can choose to examine only objects in generation 0, and because it mostly contains objects with a short life span, there is a good chance that a lot of memory will be reclaimed without the need to examine other generations.
Another performance benefit of the managed garbage collector comes from locality of reference. With the traditional unmanaged heap, memory was allocated wherever free space was found. Sometimes related data could be separated by megabytes. However, the managed heap allocates consecutive objects in a contiguous manner. There is an assumption that short-lived objects tend to have strong relationships with each other and are typically accessed around the same time. Many situations will allow all the related objects to reside in the CPU cache, which provides extremely fast access without having cache misses that require RAM access.
Garbage collection is automatically called by the CLR runtime, alleviating the burden of you having to explicitly do it yourself. It is important to know when and how collections occur in order to optimize effectively. Understanding how the GC works internally can offer some great insight into ways that your applications should be built to maximize memory management performance.
Developers transitioning from an unmanaged to a managed environment are often concerned with the performance of automatic memory management, more specifically, how the GC compares to the explicit management of memory like in C++.
When a memory allocation occurs, the CLR garbage collector determines whether or not a collection should occur. The GC looks at different factors, such as the current size of each generation, the size of each collection, and the size of the data that must be allocated. The GC then uses a heuristic evaluation to decide if a collection should occur. CLR garbage collection is as fast as or faster than C++ until a collection occurs. Essentially, a collection occurs when generation 0 does not have enough free space to accommodate a new object.
Collection usually occurs because:
The application explicitly calls the collection routine of the GC.
Generation 0 reaches max storage size.
An AppDomain is unloaded by the CLR.
The CLR itself is unloaded.
Each application has a set of roots, which identify storage locations for objects on the managed heap and objects that are set to null. These roots are made accessible by the garbage collector to determine whether a particular object is strongly referenced or if it should be collected (garbage).
The algorithm used by the CLR garbage collector is fairly straightforward, but has been optimized extensively. When a collection occurs, the GC starts with the assumption that all objects in the heap are garbage. It begins building a hierarchical graph of the roots and walks the tree to determine which objects cannot be accessed by the application. Objects that are unreachable from the application are considered garbage and can be removed during the next collection. The GC then walks the roots in a linear fashion, looking for contiguous blocks of memory that can be freed. The garbage is removed and all the remaining objects are shifted down in memory to remove gaps in the heap.
The level of exertion required by the garbage collector to handle the memory of a managed application is known as an allocation profile, which is a function of the object allocation count, the lifetime of each object, and the size of the allocations. As the level of exertion increases, so does the number of processor cycles the garbage collector takes, resulting in less time for the processor to run the application code. There are a couple techniques to optimize the allocation profile for your application, alleviating a good percentage of overhead as a result of garbage collection.
The most apparent way to relieve pressure is by allocating fewer objects. While the object-oriented paradigm introduced many great design and development concepts, it also resulted in a vast increase in the number of objects used to solve a problem.
An allocation profile is known to be either friendly or unfriendly with the garbage collector. An unfriendly profile will have many short life span objects allocated in the Large Object Heap, or many objects surviving in generation 2 for a long time before being collected. Objects in older generations that reference objects in younger generations increase the level of exertion by the garbage collector to manage collection. A friendly profile will allocate most of the objects when the application loads for the first time, and other objects will have a short life span and exist mainly in generation 0. Additionally, any objects with a long life span will contain few or no references to objects with a short life span.
It is important that you determine and constantly tune your allocation profile so that you can eliminate many performance issues as a result of automatic garbage collection.
Proper measurement metrics are a necessity when performance tuning an application, so you will need quantifiable methods to determine your allocation profile. Two such methods are described in this section: performance counters and the CLR Profiler.
The Microsoft runtime team created a variety of performance counters to evaluate a few core .NET components, including the garbage collector, which can be used to study the garbage collector in a multitude of ways.
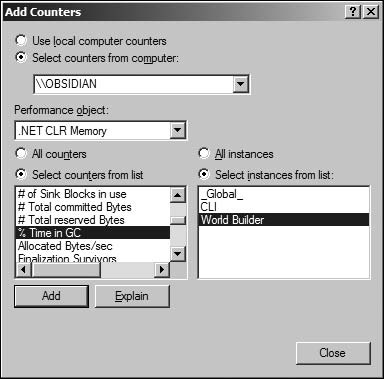
The first thing to do is launch the Performance Counter utility, which you can do by typing perfmon.exe into the Run dialog from the Start Menu or directly at the command prompt. Once the utility launches, you need to add the appropriate performance counter(s) by pressing Ctrl+I, or by clicking on the plus sign button like the one shown in Figure 34.1.
The performance counters applicable to the garbage collector reside in the .NET CLR Memory performance object. Perhaps the most important counter metric in this performance object is the total processor time that is spent on garbage collection, known as the % Time in GC performance counter. Launch the managed application that you wish to profile and select it from the instance list for the % Time in GC counter. You should be presented with a dialog similar to the one shown in Figure 34.2.
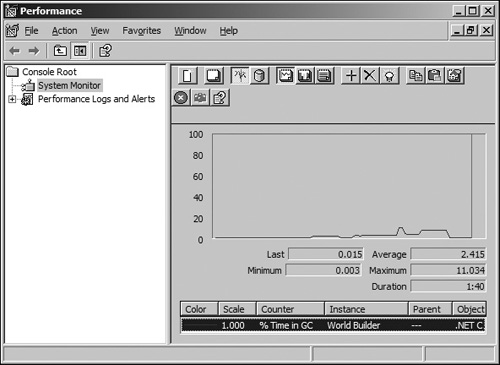
After selecting the performance counters that you wish to analyze, you will immediately begin seeing the graph display data for the metrics you have selected. You can now test functionality in your application and witness the level of exertion by the GC in managing your memory. Figure 34.3 shows the performance monitor utility displaying the % Time in GC performance counter for the World Builder application.
If the total processor time spent on garbage collection falls on average above 30%, you should consider tuning your allocation profile. Some applications can warrant high activity, whereas others cannot; having an average above 30% does not necessarily mean that your application is inefficient with memory. The course of action to take is a judgment call, depending on the type of application and whether or not there are performance issues.
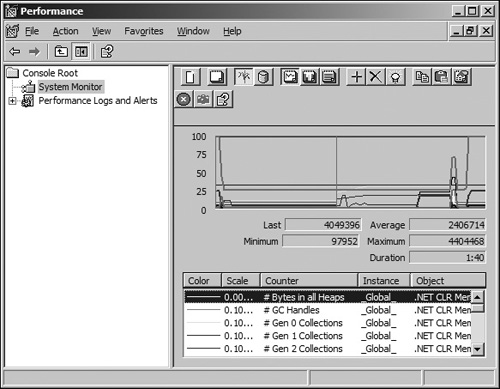
An application with a good allocation profile will have most of its objects in generation 0. You can tune this aspect of your profile by comparing the # Gen 0 Collections and # Gen 2 Collections. Figure 34.4 shows the performance monitor utility with a variety of additional counters installed.
The performance counters available in the .NET CLR Memory performance object are described in Table 34.2.
Table 34.2. Performance Counters in .NET CLR Memory
Performance Counter | Description |
|---|---|
# Bytes in all Heaps | Total bytes in all three generations, including the large object heap. This value indicates the total amount of memory used by the garbage collector to store allocated objects. |
# GC Handles | Total number of active handles used by the garbage collector. |
# Gen 0 Collections | Number of collections of objects in generation 0. |
# Gen 1 Collections | Number of collections of objects in generation 1. |
# Gen 2 Collections | Number of collections of objects in generation 2. |
# Induced GC | Number of times garbage collection was run from an explicit call, rather than during an allocation. |
# Pinned Objects | This performance counter has not yet been implemented. |
# of Sink Blocks in use | Sink blocks are used by synchronization primitives, and their data is allocated on demand belonging to an object. This metric determines the number of sink blocks currently in use. |
# Total Committed Bytes | Total committed byte count from all managed heaps. |
# Total Reserved Bytes | Total reserved byte count of the virtual memory reserved by the garbage collector for the application. |
% Time in GC | Total time a sample spent performing garbage collection, divided by the total time since the last sample. |
Allocated Bytes/Sec | Rate of bytes allocated per second by the garbage collector. This value is updated during a collection, and the time between garbage collections will be 0 because this metric evaluates to a rate. |
Finalization Survivors | Number of garbage-collected classes that have survived because of a strong reference to them created by their finalizer. |
Gen 0 Heap Size | Total size (in bytes) of the generation 0 managed heap. |
Gen 0 Promoted Bytes/Sec | Total size (in bytes per second) of memory that has been promoted from generation 0 to generation 1 after surviving a garbage collection. |
Gen 1 Heap Size | Total size (in bytes) of the generation 1 managed heap. |
Gen 1 Promoted Bytes/Sec | Total size (in bytes per second) of memory that has been promoted from generation 1 to generation 2 after surviving a garbage collection. |
Gen 2 Heap Size | Total size (in bytes) of the generation 1 managed heap. |
Large Object Heap Size | Total size (in bytes) of the large object heap. |
|
Promoted Memory from Gen 0 | Total bytes of memory that are promoted from generation 0 to generation 1 after a garbage collection. |
Promoted Memory from Gen 1 | Total bytes of memory that are promoted from generation 1 to generation 2 after a garbage collection. |
Promoted Finalization Memory from Gen 0 | Total bytes of memory that are promoted from generation 0 to generation 1 because they are waiting to be finalized. This counter is non-cumulative, so the value observed at the end of the last garbage collection is displayed. |
Promoted Finalization Memory from Gen 1 | Total bytes of memory that are promoted from generation 1 to generation 2 because they are waiting to be finalized. This counter is non-cumulative, so the value observed at the end of the last garbage collection is displayed. If the last collection was generation 0 only, then the counter is reset to 0. |
There are many performance counters available to track the .NET garbage collection, reducing the amount of work required to analyze your allocation profile in a quantitative manner.
The CLR contains an extremely powerful API that allows third parties to create custom applications that can profile managed applications. In addition to the API, the Microsoft CLR runtime team developed an unsupported tool that can analyze managed memory using the Profiling API. This tool is called the CLR Profiler, and has a variety of uses.
Note
Download the tool by navigating to the following URL or accessing the Companion Web site: http://msdn.microsoft.com/netframework/downloads/tools/default.aspx
Launching the application will present a dialog like the one shown in Figure 34.5. From here you can target an application to test, and specify what you want to profile.
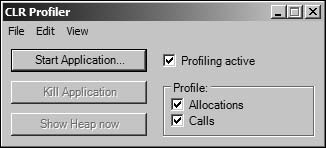
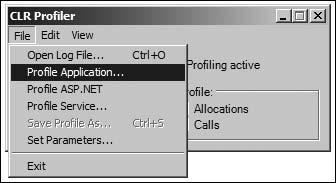
Start by targeting an application to profile by using the main menu and selecting File>Profile Application... as shown in Figure 34.6. After targeting and application, you can click the Start Application... button to begin profiling.
You now begin using the functionality that you want to profile in your application. The profile reports are accessible when the application is running or after it has been closed down, so you can either profile as you use the application or view the reports after the application has closed.
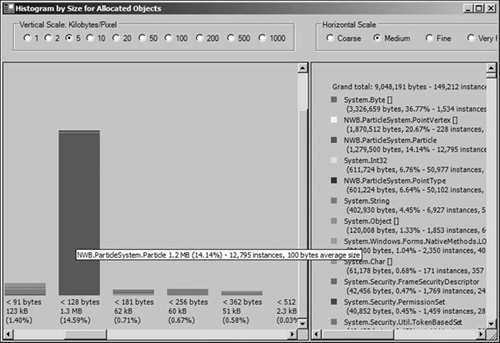
There is a wide variety of reports that you can view, such as the Histogram by Size for Allocated Objects shown in Figure 34.7. This report is useful in determining how much data was allocated, and separated by object type.
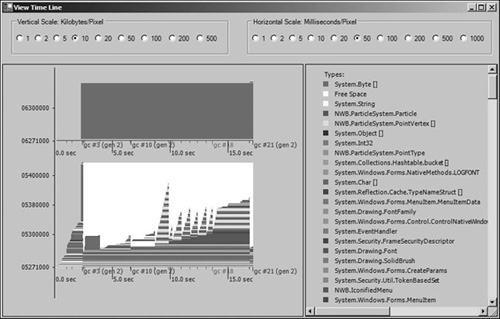
Another way to analyze your allocation profile is by viewing the memory management time line that depicts usage patterns for object types in your application as well as generation statistics for the garbage collector. This report is shown in Figure 34.8.
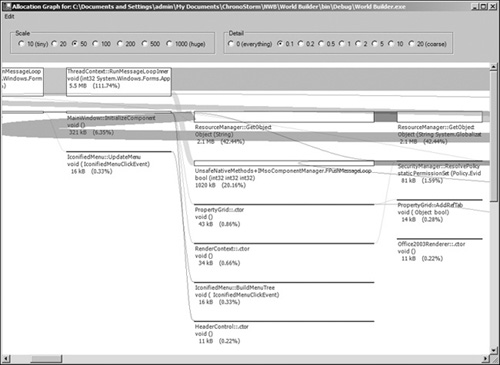
Another useful report is the allocation graph, which allows you to walk through the allocation tree for any objects in the application. This report is shown in Figure 34.9.
The CLR Profiler is accompanied by a high-performance overhead, making certain analysis tests difficult to do, but it is very useful in other areas, such as memory efficiency and usage.
Even though automatic memory management handles releasing the memory of an allocation when the resource is no longer needed, some resources have some special steps that must be performed before releasing the memory.
The Common Language Runtime provides a mechanism that automatically handles resource cleanup before memory is freed by the garbage collector. This mechanism is called finalization, and it is used to release native resources such as operating system handles or database connections.
The CLR does not use reference counting, so finalization was created to accommodate the issue behind releasing resources when references reach zero. Finalization is used in situations where an object’s lifetime is unknown and the object requires cleanup.
The finalization mechanism increases the level of exertion required by the garbage collector, so it should be used appropriately. Objects requiring finalization are entered in a finalizable queue (f-reachable) that is searched by the garbage collector during a collection. The garbage collector manages a separate finalizer thread that processes objects that require finalization. Objects being finalized are moved into the next generation because the garbage collector may require their state. The memory for finalized objects will be released during the following collection.
There are two ways to implement finalization, each accomplishing the same thing but using different syntax. The first approach is overriding the Finalize method available to any object. This approach is illustrated by the following code:
public class YourClass
{
    public YourClass ()
    {
    }
    protected override void Finalize()
    {
        // Perform cleanup here
    }
}
The other method to implement finalization is using the same syntax that C++ uses for class destructors. It is important to know that even though the syntax is identical, the C# version does not fire when the object goes out of scope. Instead, it fires when the finalization thread gets around to releasing the object. This approach is illustrated by the following code:
public class YourClass
{
    public YourClass ()
    {
    }
    ~YourClass()
    {
         // Perform cleanup here
    }
}
Objects requiring finalization should be wrapped into the smallest object possible. If your class accesses both managed and unmanaged memory, you should make a child finalizer class that releases the unmanaged resources and encapsulates them in the parent object. Keep in mind that in order for this to work, there cannot be any strong references to the parent object.
Caution
Never implement a finalizer that blocks the finalization thread. Remember that there is only one thread for it, and blocking this thread will prevent resources from being freed.
Finalization is a great feature to have, but it is also very important that you are aware of the expensive performance implications. Another negative attribute of finalization is that you do not really have control over when the finalizer will execute or when the garbage collector will perform cleanup. A solution to these problems is to implement the dispose pattern which supports both the implicit and explicit freeing of resources.
For situations where the lifetime of an object is explicitly known, the dispose pattern is used to release unmanaged resources. Functionality for disposable objects is implemented through the IDisposable interface by providing an implementation for the Dispose method. In fact, you never know how your object will be used, so implementing a finalizer and IDisposable is the proper way of handling the release of unmanaged resources.
Both the finalizer and the Dispose method will call the same code, and it is advisable to route them both to the same function so that the code is maintainable and in one place only. When the Dispose method is called, it is important to inform the garbage collector that finalization is not needed. This is done by calling the GC.SuppressFinalization method.
The following code shows the proper way to implement IDisposable with support for finalization and multi-threading:
public class YourClass : IDisposable
{
    public void Dispose()
    {
        Dispose(true);
        GC.SuppressFinalize(this);
    }
    protected virtual void Dispose(bool disposing)
    {
        // Prevent issues with multi-threading
        lock (this)
        {
            if (disposing)
            {
                // Perform cleanup on managed objects
            }
            // Perform cleanup on unmanaged objects
        }
    }
    ~YourClass()
    {
         Dispose(false);
    }
}
Note
The disposing boolean parameter passed into the Dispose method will be true if explicitly called by the user, and false if called by the garbage collector during finalization.
The following code shows the proper way to implement IDisposable with support for finalization in a derived class. It is important to note that this code does not have a Finalize method or a non-parameterized Dispose method because these methods are inherited from the base class.
public class YourDerivedClass : YourClass
{
    protected override void Dispose(bool disposing)
    {
        // Prevent issues with multi-threading
        lock (this)
        {
           if  (disposing)
           {
               // Perform cleanup on managed objects
           }
           // Perform cleanup on unmanaged objects
           base.Dispose(disposing);
        }
    }
}
Certain cases, like a database connection or network socket, are better suited to a Close method instead of Dispose. The best way to handle this situation is to have a Dispose, finalizer, and a Close method that all point to the same function. In most cases, the Dispose method will be privately declared.
The general rule of thumb is to implement IDisposable and provide a Dispose method if the class has a finalizer. Also, in situations where you know you are done with an object, you should call the Dispose method explicitly instead of waiting for the finalizer to fire.
The C# language provides a great mechanism that automatically disposes objects that implement the IDisposable interface. The using keyword allows you to specify a block of code that will call the Dispose method when program execution leaves the construct.
The following code shows how to use the construct:
using (DisposableType disposableObject)
{
    // Use disposableObject for something
}
// At this point the disposableObject.Dispose() method has been called.
Another great feature about the using keyword is that you can be guaranteed the Dispose method will fire, even if an exception is thrown from within the construct.
Note
Implement the dispose design pattern on resources that need to be explicitly freed, and always implement IDisposable if the class provides a finalizer.
Lastly, throw an ObjectDisposedException from methods where the unmanaged resources are needed but have already been disposed. The only place you should not do this is in the dispose method itself because it should be callable any number of times without throwing an exception.
As discussed earlier, an object cannot be collected if there is a root pointing to it (strong reference). However, this is not the only way of referencing an instantiated object. The GC also supports the notion of weak references. A weak reference to an object allows the garbage collector to perform collection if needed, but also allows the application to use the object. The first thing that probably popped into your head was having a NullReferenceException thrown when the application attempts to access an object after being collected; using weak references is an issue of timing.
Note
It is important to note that an application must obtain a strong reference to access a weakly referenced object. If this strong reference has been obtained before the garbage collector runs, the object cannot be collected.
The WeakReference object offers two constructors:
WeakReference(object target);
WeakReference(object target, bool trackResurrection);
The target parameter specifies which object a weak reference should be obtained for, and the trackResurrection parameter specifies whether or not the WeakReference should track the target after its Finalize method has been called; the trackResurrection parameter defaults to false with the first constructor.
A WeakReference that does not track resurrection is known as a short weak reference, while one that tracks resurrection is known as a long weak reference. It is advisable to refrain from using long weak references unless necessary; the state of resurrected objects can be very unpredictable.
Note
A long weak reference and a short weak reference will behave identically if the object does not offer a Finalize method.
Weak references are useful in situations where a certain data structure requires a lot of memory, and performance begins to degrade or you run out of memory because the garbage collector has no objects to collect. The most common data structure that benefits from the use of weak references is a tree structure that has a lot of references and depth.
The user might not be requiring the use of a particular area of the tree, so weak referencing the tree nodes will allow for the garbage collector to collect unused portions of the data structure if necessary. If a tree node gets collected, you simply reload that node and its children when you need them again.
As the user navigates away from a particular region of the tree, you can create some weak references and release the strong references for the objects in that region. If memory becomes low enough that the garbage collector requires collection, it will start to reclaim the weakly referenced tree objects. When the user navigates back to that same region, the application will try to recreate a strong reference for that tree. If successful, no memory operations are needed, and if the tree has already been collected, the application will simply reload that region again.
A prime example of using weak references is a directory browser that loads files and directories into a hierarchical tree. Keeping a weakly referenced tree in memory is much more efficient than loading all the data from the hard drive. If a file or directory node is collected, you can simply reload its contents from that location on the hard drive.
Once the WeakReference has been instantiated to point at the target object, you should set the strong reference from the root to null. The garbage collector will not be able to collect the object if any strong references to it remain.
The proper way to release the weak reference and reobtain a strong reference to the object is by assigning a root to the Target property of the WeakReference object. If the property returns null, the object was collected by the GC. Another way to determine whether the object has been collected is to check the IsAlive property of the WeakReference object.
The following code shows how to create a weak reference in C#:
MyClass instance = new MyClass ();
WeakReference weakReference = new WeakReference(instance);
instance = null; // Object is no longer rooted
if (weakReference.IsAlive)
{
    instance = weakReference.Target;
    // Object is rooted and can be used again (strong reference)
}
else
{
    // Recreate the object
    instance = new MyClass();
}The automated memory management of the .NET platform is very efficient and optimized, but certain situations may require direct control over the garbage collector to improve performance. Every application has a fairly unique allocation profile in terms of memory requirements and the intervals or patterns in which memory is managed, presenting some opportunities for performance tuning using explicit control over the garbage collector.
The System.GC type provides functionality for your application to interface with the garbage collector directly. There are a variety of things that can be done with this class, such as the ability to induce a collection, wait for the finalization thread to complete a pass, and query the garbage collector for some useful statistics, like the maximum number of generations.
Garbage collection is a fairly multi-threaded process, so performance optimizations typically come in the form of timing. For example, if you run a process that allocates a substantial number of objects, it is fair to say that you should explicitly invoke the garbage collector before returning control back to the user. If the user is already waiting for a long-running process to complete, where is the harm in running a collection when the process completes, so that the application does not hit a random pause when the GC finally fires up to release memory that was used? Your application knows more about how it works than the garbage collector does, so some strategically placed calls can offer some performance boosts. It is important to keep in mind that collections also degrade performance, so use them sparingly and wisely.
One of the most important operations you can do is invoke a collection. There are two flavors of the GC.Collect method: one version that takes in an integer specifying which generation to collect, and another version that invokes a collection across all generations and is the equivalent of calling GC.Collect(GC.MaxGeneration).
GC.Collect(Int32 Generation)
GC.Collect()
Note
Normally, you should avoid calling the collection methods explicitly, but as discussed earlier, there is a definite need for direct control in certain situations.
Another useful operation is the GC.WaitForPendingFinalizers method that suspends the calling thread until the finalization thread has emptied the f-reachable queue and all finalizers have been executed. It is uncommon that you should need to call this method directly unless you know what you are doing.
Aside from statistics like GC.MaxGeneration that returns the maximum number of generations, you can query any object or WeakReference to determine the generation that it is currently stored in.
Int32 GetGeneration(Object obj)
Int32 GetGeneration(WeakReference weakRef)
The value returned will be inclusively within the range of 0 and GC.MaxGeneration.
This chapter covered many aspects of the garbage collector intrinsic to the .NET platform, along with ways to optimize your allocation profile and program flow to increase performance and responsiveness. First, you were introduced to a high-level overview of the garbage collector and the purposes that it serves. Then the discussion became low-level and centered on everything that goes on behind the scenes. A number of rules and best practices were mentioned, along with some warnings about possible trouble spots.
Techniques for profiling the allocation profile of your application were also covered, as well as techniques to properly release unmanaged resources that require explicit disposal.
While fairly comprehensive, this chapter did not cover absolutely everything about the .NET garbage collector. The purpose of this chapter was not for you to walk away with an intimate knowledge of how the GC works, but rather with the knowledge to develop your applications to take advantage of automated memory management without suffering much of a performance hit. Some things that were not covered include the AddMemoryPressure and HandleCollector mechanisms that were introduced in .NET 2.0.
Automated memory management is a wonderful benefit to using the .NET platform for tools development due to the increased stability and reliability. The garbage collector will never go away, so learning the specifics of what goes on behind the scenes will make development and optimization much more straightforward.