CHAPTER 13
Reignite Your Core Brands
“Your competition might actually . . . believe that in fact, treating this customer as if she’s the only person in the world is worth it. We don’t become mediocre all at once, and we rarely do it on purpose. Getting bigger is supposed to make us more effective and efficient. Alas, the way to get there isn’t by doing what you used to do, but less well.”1
—SETH GODIN
Knowing where you make money today is a very good first step. It’s a scorecard of sorts, indicating the areas of activity for which customers are willing to pay. It can help refocus the organization on the things that it, alone, can do better than others. Frequently, it highlights the residual value of the central brands, products, and services that helped establish the company in the first place—your “core brands” as we’ll refer to them henceforth—and exposes how prior product proliferation programs may have flooded the business with complexity. This complexity is a drag on the business, and a drag on growth, and thoughtful portfolio optimization can provide significant lift. But to really reignite growth in your core brands—a critical skill set in the Age of Complexity—requires additional actions around portfolio segmentation, marketing, innovation, and your operating model.
In this chapter we will focus on how you can free up your core brands from this drag of complexity and mine them for growth and value creation.
The consumer packaged goods (CPG) industry—the focus of this chapter for illustrative purposes—is one that succumbed to the Expanding Portfolio Siren en masse, only to refocus in recent years on the value of core brands. That was essentially the thinking that led P&G to shed more than half of its brands, amidst sluggish sales increases, as part of an effort to refocus the business for growth and profitability. A. G. Lafley came out of retirement in 2013 for a stint to take up the CEO spot once again and spearhead the refocusing of the portfolio. At the time of his return, the portfolio ranged from batteries to pet food, detergent, electric razors, deodorants, toothbrushes, and toilet paper.
Framing up his criteria for divestiture, Lafley was quoted as saying: “I’m not interested in size at all. I’m interested in whether we are the preferred choice of shoppers.”2
His actions, however, yielded significant scale benefits for the consumer goods giant. Despite unloading some significant businesses—its animal foods brands to Mars, its Duracell batteries unit to Berkshire Hathaway, and a collection of 43 beauty businesses to Coty—the remaining brands generated 90 percent of P&G’s $83 billion in annual sales (predivestment) and over 95 percent of its profit. Put another way: the 50 percent of its brands P&G unloaded—each with its own dedicated team, financial overhead, share of corporate resources, and drain on management time—generated only 10 percent of its revenues and 5 percent of its profit. The products P&G kept had things in common: they were defined by product technology that made a consumer difference, and they were daily use items.
CFO Jon Moeller explained P&G’s new approach as focusing on “core brands and businesses that create the strongest customer preference and the best balance of growth and value creation.”
As a growth enabler, the value of returning to the core is twofold: the focus it engenders and the investments it enables by “reclaiming” margin that was otherwise lost to peripheral activities and products and repurposing toward higher-return areas.
For P&G, this has also required a reorganization of its R&D function, shifting power to product category leaders who are closer to the market, and focusing on breakthrough technologies that can have real impact on people’s lives. In the past, the business had been absorbed with cosmetic upgrades, as opposed to game-changing innovations.
“We were doing a lot that wasn’t adding value for the consumer,” said CTO Kathy Fish, “and even worse, that was making it hard for the consumer to shop our shelves.”3 The business is now making investments in support of its core brands and launching new products.
Overall, management expects that with the new portfolio organic growth rate will increase by one percent, and with two percentage points of higher profitability.4 The strategy is showing early results. To date, the actions have yielded significant cost benefits: P&G recently announced plans to reduce costs by $10 billion between 2017 and 2021, which comes on top of $7 billion it eliminated between 2012 and 2016.5
And in its second quarter 2017 results, the first quarter to see the impacts from the brand divestments, its organic sales (a closely watched metric that excludes the impact of foreign exchange, acquisitions and divestitures) rose by 2 percent, higher than expectations, with an upwardly revised sales outlook for the year.6
P&G’s story is far from unique. We see a common story across the industry. In the pursuit of growth, CPG companies have launched waves of SKU extensions and incremental innovations. Hershey, for example, enjoyed consistently strong growth for many years on the back of product proliferation—up to a point.
“After years of growth and success, we had hit a difficult period,” said J. P. Bilbrey, then-president of Hershey North America.7 “Senior management was not aligned in how we were going to compete—and our results weren’t as good as we would have liked them to be.”
Hershey’s team investigated and found three root issues:
![]() The company’s key retailers and competitors had entered a phase of significant consolidation that was changing influence within the category.
The company’s key retailers and competitors had entered a phase of significant consolidation that was changing influence within the category.
![]() Consumers were not responding to all the new flavor varieties.
Consumers were not responding to all the new flavor varieties.
![]() Hershey’s focus on growth through pack type variation was driving complexity, not growth, while its competitors were focusing on brands.
Hershey’s focus on growth through pack type variation was driving complexity, not growth, while its competitors were focusing on brands.
The business, in other words, was operating in push-mode. It had not responded to retailers’ growing need for lower inventories, better use of shelf space, and less product and packaging complexity. Instead, the marketing push was to add more and more pack types and flavor proliferations for its classic brands. To turn the situation around, the business shifted from a supply-driven approach to a demand-driven approach, getting to the heart of customer tastes and expectations.
The key takeaway is that the default strategy of simply launching more SKUs and line extensions is insufficient for growth in the Age of Complexity, and is ultimately damaging to what made the company great in the first place. Acknowledging this reality, and the value of reigniting the core, is a critical first step.
Assess Your Growth Drivers and Align for “Core” Growth
Of course, this is easier said than done. According to ConAgra Foods CEO Sean Connolly, it requires “unlearning” some old ways of doing things (Figure 13.1).
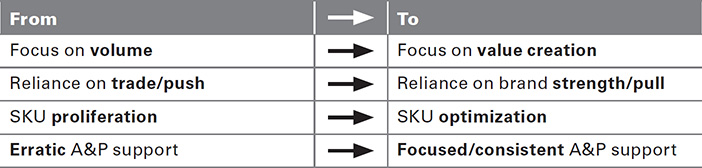
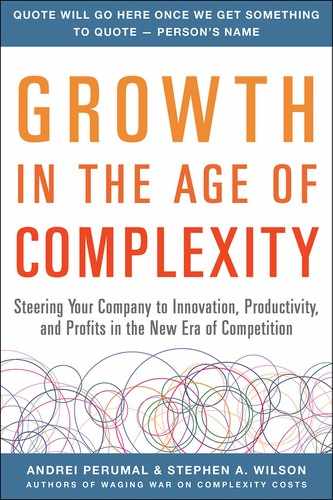
FIGURE 13.1: ConAgra Is Changing Key Approaches to Drive Profitable Growth
“We are clear-eyed that our success will require us to break a number of bad habits, and we are making meaningful progress,” said Connolly on the second quarter 2017 earnings call. “We are moving from a focus on volume at any cost to a focus on value creation. From a reliance on trade driven push tools to a reliance on stronger brands, stronger innovation, and consumer pull. We’re shifting away from SKU proliferation to optimizing our SKUs with a focus on sustainable returns. And we’re continuing to make strides in our approach to A&P [advertising & promotion], which is now more focused, consistent, and tied to ROIs.”
As is typically the case, stopping old habits is harder than starting new practices. They are engrained in a company’s operating model, incentive, and culture. ConAgra was unusually forthright in its enunciation of the issues. Without a clear rebuke to what is not working, it’s very hard to architect a future. Connelly achieved this through a three-month period of analysis to get to an up-to-date fact base, and declaring an openness to major change.
Many times the impetus for such an effort is a significant decline in the core, as was the case with Chiquita (as described in Chapter 4). But it can also come from the recognition of profit concentration. Earlier in the book we shared the Whale Curve, and the notion that for most companies 20 to 30 percent of products or services drive 300 percent of profitability. This is both a profit and growth issue—consider all the resources tied up in the 70 to 80 percent of products that are unprofitable, and how they could be better deployed to higher-growth areas. This dynamic illustrates just how widespread the opportunity is for reigniting the core. It also suggests how hard it is to liberate these “islands of profit in a sea of cost.” To do so requires changing not only the portfolio, but also the supporting processes and quite frequently a company’s operating model. This is why it is critical up front to get alignment across the executive team and assess, through a period of analysis, the state of your growth drivers and the value opportunity of focusing and reinvigorating the core.
For P&G, the trigger for their efforts was the recognition that complexity had grown unchecked, resulting in tremendous profit concentration and lower than desired growth. It came from the insight that “simplifying and improving productivity frees up resources for innovation and expansion that ultimately drive profitable growth,”8 as new P&G CEO David Taylor explained. For Nestlé, with approximately 2,000 brands globally, it was the recognition that its 34 “billionaire brands” constituted 83 percent of its profits with growth of 5.2 percent versus 1.9 percent for the rest of the business.9
For another CPG company, a client of ours, we found that despite all the investment, energy, and attention spent on new growth areas, the bulk of the profits still came from its legacy core brand (this was masked by the massive cross-subsidizations that had to be removed to see this picture clearly). Figure 13.2 shows that this company’s core brand (Brand A) accounted for 12 percent of SKUs, 27 percent of revenue, but 50 percent of operating profits.
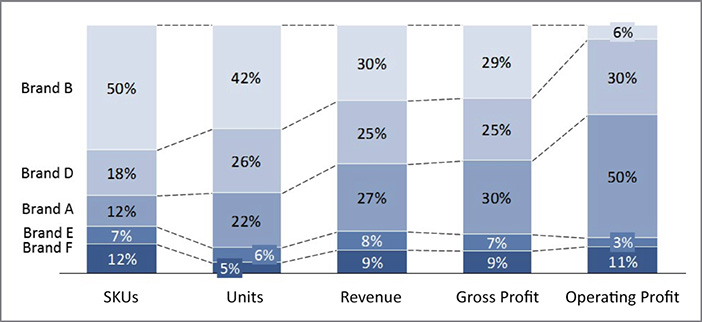
FIGURE 13.2: Legacy Core Brand (Brand A) Subsidizing Other Brands
These numbers give a glimpse of the opportunity. Up front, you should also be asking:
![]() What is the current state, and perception, of our core brands? What competitive threats exist for each?
What is the current state, and perception, of our core brands? What competitive threats exist for each?
![]() Do we have clear category/brand roles within our portfolio to guide decision making?
Do we have clear category/brand roles within our portfolio to guide decision making?
![]() What are the customer, operational, and financial impacts of the complexity in our portfolio?
What are the customer, operational, and financial impacts of the complexity in our portfolio?
![]() To what degree are we diluting our marketing spend—and effectiveness—across too many brands and products?
To what degree are we diluting our marketing spend—and effectiveness—across too many brands and products?
![]() How do our innovation efforts support or decay the core? Do we understand how our consumers use our products?
How do our innovation efforts support or decay the core? Do we understand how our consumers use our products?
![]() How do we upgrade our operating model fit-for-purpose to reach today’s consumers?
How do we upgrade our operating model fit-for-purpose to reach today’s consumers?
As a whole, the answers to these questions will inform the rationale of a “reignite the core” strategy. How to do this is the focus of the rest of the chapter, but recognize that this is a significant effort and a transformation journey. The elements of that journey will vary but will likely resemble Figure 13.3.
FIGURE 13.3: The Building Blocks for Reigniting Growth in Your Core
Define Your Portfolio Strategy
One of the big gaps we see in many organizations is a lack of effective portfolio strategy and segmentation: a failure to identify what roles particular products or segments play in the portfolio. Many times correcting this starts with identifying the jobs that products do for customers, and what value they provide for the business—cash generation, or a beachhead into a new market. This lack of clear portfolio roles is a major contributor to the complexity that has accumulated in an organization in the first place. But getting it right early on provides a strategic framework for reigniting the core.
To provide an example, one of our clients, a manufacturer and distributor of packaged foods (“FoodCo”), found itself with a large portfolio of wines as part of an acquisition. Customers included independent wine and spirits stores, large grocery stores, and an ad hoc selection of restaurants. The shape of the range, however, was driven less by deliberate strategic choices and instead by the influence of a few large suppliers that made up most of the volume. Absent a clear portfolio strategy, the range had become bloated with high numbers of low-margin wines. The decision for FoodCo was whether to divest this business or reinvent it, leveraging its understanding of customers and the market. It went with the latter, and as part of that challenge, assessed what it would take to split the portfolio across two distinct opportunities: a food service offering, serving high-end hotels and restaurants, where the onus would be on higher-end wines at lower volumes and with increased rotation, and grocery, which they were serving currently but with a portfolio that was not fit-for-purpose. In fact, the portfolio as it stood was not fit for either channel; ironically it had a vast array of products, but not the right ones. But having defined the categories, and the roles required of the products within those categories, the business was able to create two distinct, suitable portfolios to serve the two segments (Figure 13.4).
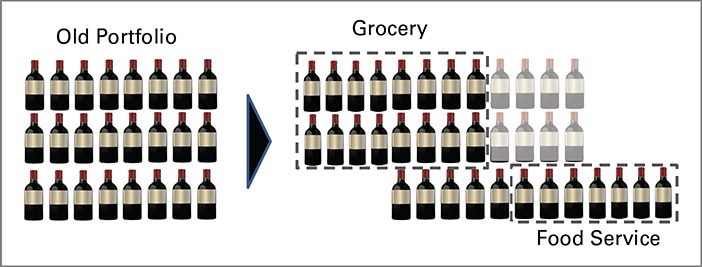
FIGURE 13.4: Reshaping the Portfolio to Serve Two Distinct Opportunities
Typically portfolio strategy falls down in a couple of key ways:
![]() Segments are managed bottom-up vs. top-down. A good product or category manager will look to optimize the mix within his or her respective area, and fight for resources to do so. But at some point these need to be squared off with (1) competing resource needs in other segments across the business and (2) the top-down corporate strategy that is laying out where to play and how to win. This has, or should have, obvious influence on segment strategy.
Segments are managed bottom-up vs. top-down. A good product or category manager will look to optimize the mix within his or her respective area, and fight for resources to do so. But at some point these need to be squared off with (1) competing resource needs in other segments across the business and (2) the top-down corporate strategy that is laying out where to play and how to win. This has, or should have, obvious influence on segment strategy.
![]() Segments are anchored around industry or subsector definitions vs. portfolio roles. Companies serving multiple industries will naturally start to segment that way. It can be helpful to understand industry penetration and the specific industry dynamics. But it can lead to dissipating resources across too many areas, and frequently does not translate to clear actionable objectives.
Segments are anchored around industry or subsector definitions vs. portfolio roles. Companies serving multiple industries will naturally start to segment that way. It can be helpful to understand industry penetration and the specific industry dynamics. But it can lead to dissipating resources across too many areas, and frequently does not translate to clear actionable objectives.
By contrast, what does a good portfolio strategy help you do? Well, as in the case of FoodCo, it can greatly inform your portfolio optimization (which we discuss next). It will also inform innovation decisions—which high growth submarkets will get the lion’s share of innovation dollars over the next few years, vs. simply allocating by current revenue. Above all else, it communicates to the organization (and externally to the market, as shown in Figure 13.5) the priorities of the business and what, at a core offering level, is required to win.
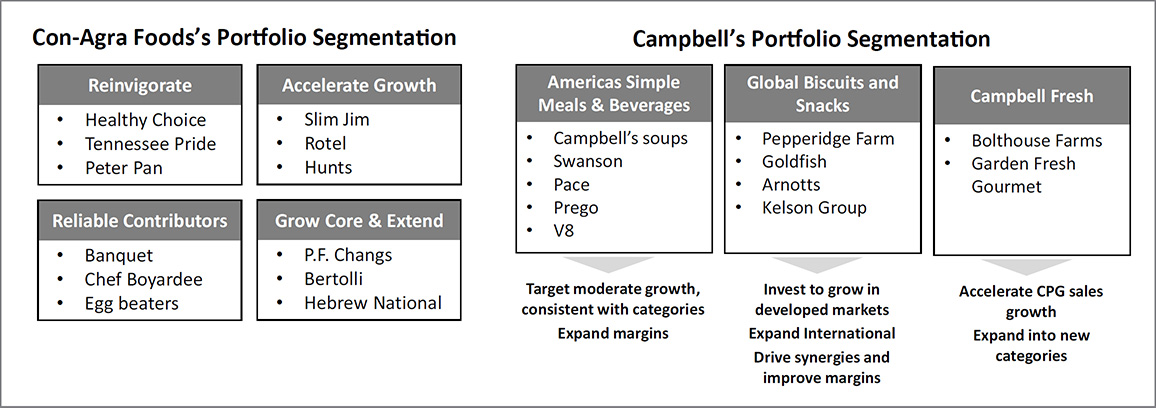
FIGURE 13.5: How ConAgra and Campbell’s Segment Their Portfolios
In the case of Reckitt Benckiser, a well-defined portfolio strategy has propelled it to above-industry levels of performance (see Figure 13.6). Its focus: 19 “Powerbrands” that constitute 80 percent of its revenue. These include well-known names such as Vanish, Calgon, and Strepsils. The company has shown it is quick to make acquisition decisions on strong brands with incremental revenue that have high market share—speed enabled by a clear portfolio strategy. Acquiring multiple niche brands that are distinctive, and then driving global growth around them, has helped it grow both top and bottom line over the last decade.
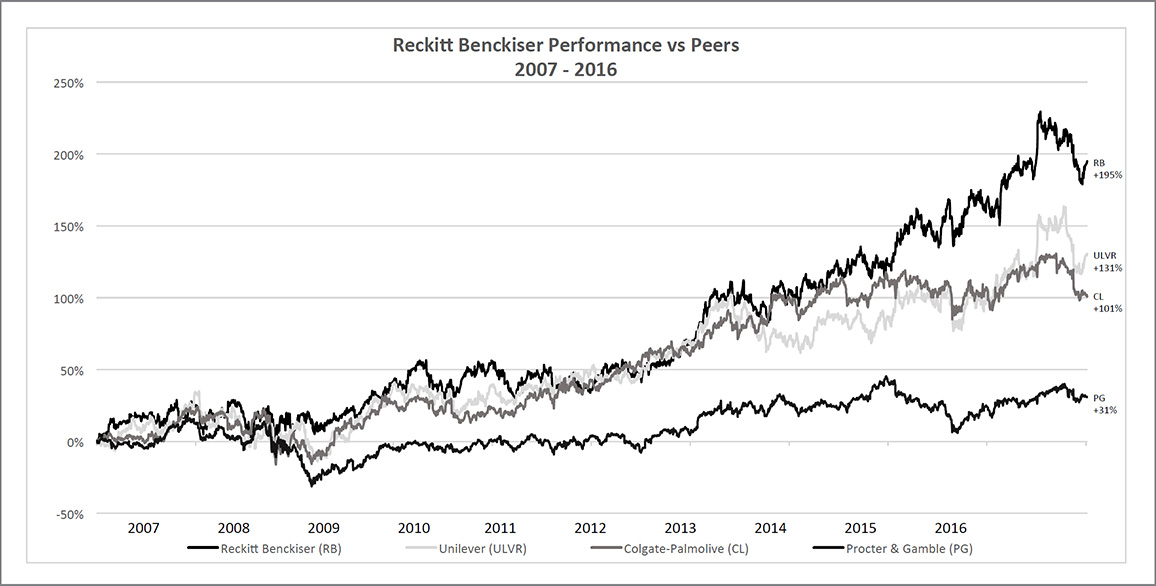
FIGURE 13.6: Reckitt Benckiser’s Performance Compared to Industry Peers
Reshape the Portfolio
While many companies approach portfolio optimization as simply a “chop off the tail” exercise, to truly reshape the portfolio requires a more thoughtful and holistic approach. We use a multifaceted approach that assesses the portfolio through a number of lenses. The idea: a singular view will yield a portfolio that optimizes for current profitability (for example), or customer desired breadth (alternatively), but the ideal portfolio is one that satisfies requirements across a broad range of factors.
As an example, consider Consumer Durables Co. (CDC), a large home appliance manufacturer, which had grown its revenue over several years through line introductions and extensions, but which more recently had seen its EBITDA stagnate. SKUs had grown by more than 25 percent, and engineering was barely able to sustain the pace of testing necessary for product refreshes. Prior portfolio rationalization succeeded in trimming the tail, but the benefits to engineering and profit never materialized. Management began to wonder if a further cut in products would do more harm than good and feared that a smaller portfolio would impact their ability to compete.
At the same time, they knew that the current levels of complexity were unsustainable. So the team used our approach to shed new light on the portfolio by assessing the portfolio through a number of key lenses, ultimately leading the company to a more productive and profitable portfolio:
![]() Benefits. There are many good reasons to launch a portfolio optimization, and it can bring a host of benefits. But it is vital up front to align on what you are looking to achieve from this exercise. For example, is it about improving working capital, or boosting EBITDA, or is it more to enable growth by targeting key indirect drivers such as availability and on-time delivery?
Benefits. There are many good reasons to launch a portfolio optimization, and it can bring a host of benefits. But it is vital up front to align on what you are looking to achieve from this exercise. For example, is it about improving working capital, or boosting EBITDA, or is it more to enable growth by targeting key indirect drivers such as availability and on-time delivery?
![]() Portfolio strategy and segmentation. There will always be reasons to retain or add a product; it is much harder to get people to agree to delist a product. That is why the strategic facet is so important, as it cuts through those objections. Many companies have allowed their strategy to evolve over time, not as a set of deliberate decisions around resource allocation, but in response to individual customer requests and incremental market opportunities. This can lead to a de facto “all things to all people” strategy that dilutes true competitive advantage. But having clarified your portfolio segmentation (see previous section), reshaping your portfolio becomes much easier.
Portfolio strategy and segmentation. There will always be reasons to retain or add a product; it is much harder to get people to agree to delist a product. That is why the strategic facet is so important, as it cuts through those objections. Many companies have allowed their strategy to evolve over time, not as a set of deliberate decisions around resource allocation, but in response to individual customer requests and incremental market opportunities. This can lead to a de facto “all things to all people” strategy that dilutes true competitive advantage. But having clarified your portfolio segmentation (see previous section), reshaping your portfolio becomes much easier.
In our case example, CDC was focused on being first-to-market in new product development and to do this used a “good, better, best” strategy. However, over time additional air conditioner models were added while older models were never removed. The result was an increase from three tiers to six, a large number of overlapping products, and a drastic reduction in new product development speed—in stark contrast to the company’s strategy.
![]() Competitive requirements. When considering the market, traditional approaches commonly accept the competitive landscape as a mandate that requires matching a competitor’s portfolio one-for-one. However, competition is only part of the market context. Macroeconomic headwinds may impact the true role a product plays within the portfolio, and regulatory requirements can add costs and burdens that often go unaccounted.
Competitive requirements. When considering the market, traditional approaches commonly accept the competitive landscape as a mandate that requires matching a competitor’s portfolio one-for-one. However, competition is only part of the market context. Macroeconomic headwinds may impact the true role a product plays within the portfolio, and regulatory requirements can add costs and burdens that often go unaccounted.
At CDC, prior portfolio optimization efforts largely ignored the market, as the team felt they understood competitive position. However, after initial analysis, the team discovered that the next largest competitor had similar revenue, but with 20 percent fewer SKUs. Management now recognized that, in effect, they were realizing 20 percent less scale than competitors. Additionally, the team discovered that due to changing industry standards and customer demands the average refresh rate for each air conditioner SKU was likely to increase significantly in the near future, further stressing product development and engineering.
![]() Customer coverage and substitutability. To retain an unprofitable product, companies should have compelling evidence of substantial linked revenue (sales of one product are linked to another) or a lack of substitutability (customers are not willing to trade one product for another). What we find is that the starting assumption (corrected in our approach) is that there is 100 percent linked revenue (an overestimate) and 0 percent product substitutability (an underestimate).
Customer coverage and substitutability. To retain an unprofitable product, companies should have compelling evidence of substantial linked revenue (sales of one product are linked to another) or a lack of substitutability (customers are not willing to trade one product for another). What we find is that the starting assumption (corrected in our approach) is that there is 100 percent linked revenue (an overestimate) and 0 percent product substitutability (an underestimate).
In this case example, further research at CDC concluded customers neither understood nor valued the subtle differences between most air conditioners and indicated high levels of customer confusion. Products that were once considered to have zero substitutability between one another were reevaluated using customer interviews and historical sales analysis. The result was an opportunity to transition up to two-thirds of customers to other air conditioner products, removing complexity and maintaining revenue.
![]() Operational and supply chain impact. Perhaps no function feels the impact of complexity as acutely as operations and supply chain.
Operational and supply chain impact. Perhaps no function feels the impact of complexity as acutely as operations and supply chain.
At CDC, previous portfolio reviews overlooked operations, but this is where a reduction in complexity can provide the greatest benefit. For the first time, the business questioned which products drove the greatest operational complexity. Analyses showed the bottom 25 percent of SKUs by volume in the air conditioner product line drove less than 5 percent of volume, while consuming 50 percent of engineering resources. Armed with this information, the team was able to focus on reshaping the portfolio to free up engineering resources, improving time to market with minimal EBITDA impact.
![]() Complexity-adjusted costs and true profitability. The financial facet provides a critical understanding of product profitability, and leverages the square root costing approach described in the previous chapter.
Complexity-adjusted costs and true profitability. The financial facet provides a critical understanding of product profitability, and leverages the square root costing approach described in the previous chapter.
While financial analysis during the original portfolio optimization exercise indicated all products were gross profit positive, further investigation at CDC revealed a very different picture. An assessment of operating profit and complexity-adjusted profitability revealed that nearly 80 percent of air conditioner SKUs were destroying at least 25 percent of operating profit.
![]() Cost- and service-level breakpoints. Benefits from portfolio optimization tend to follow a staircase pattern. On the cost side, you need to understand the chunks of cost (the fixed assets) that can be eliminated and what is required from a product consolidation perspective to get there. On the service side, you need to assess what combination of portfolio and process changes would constitute a breakthrough moment for customers—for example, same-day delivery.
Cost- and service-level breakpoints. Benefits from portfolio optimization tend to follow a staircase pattern. On the cost side, you need to understand the chunks of cost (the fixed assets) that can be eliminated and what is required from a product consolidation perspective to get there. On the service side, you need to assess what combination of portfolio and process changes would constitute a breakthrough moment for customers—for example, same-day delivery.
All told, the results for CDC were significant. Going through this multifaceted approach highlighted customer confusion, overlapping tiers, and unprofitable products. Armed with a more comprehensive view of the portfolio, management was now able to make critical trade-off decisions. The resulting actions yielded a 7 percent increase in operating profit with 30 percent fewer SKUs, and the ability to free up 15 percent of engineering resources to focus on new product development.
Reset Priorities in Marketing, Advertising, and Promotion
With focus comes the opportunity to target investments where it counts. ConAgra moved to a much more disciplined and focused approach to leveraging its advertising and promotion spend. Nestlé now focuses 80 percent of its promotional support on its 34 billionaire brands. Said its CFO François-Xavier Roger, “It is not such a large number relative to our size and these products are growing much faster than the rest of the range and they drive a high level of profitability, so we are very focused in terms of marketing support.”12
It’s not just a matter of better use of financial resources. Focus also enables you to do more with your core brands. Said Clorox CMO Eric Reynolds, “Nothing ever gets better until you’re really clear with yourself about what your brand stands for, why it even exists. At some point, someone has to say, ‘Stop. We’re doing all of this stuff—why? Why does it matter?’ ” Reynolds has focused on using data and storytelling to revive and boost sales for core products, including automated, weather-based media buying for the Burt’s Bees lip balm.13
Innovate Around the Core
For all the companies cited in this chapter, the rationale of a reignite-the-core strategy was twofold: improve profitability and free up resources to accelerate growth. This means rethinking how to innovate around the core brands. Gone are the days where incremental line extensions will carry the day. No longer can CPG companies “push” products into the marketplace; instead it’s a matter of generating “pull” from consumers. As a result they are shifting resources to more fundamentally understand customer insights, to discover how consumers are using products and what latent needs remain unaddressed.
Clorox offers an example of this, where it has focused on “New faces, new spaces, new places”—looking to attract new demographic groups, looking at new consumption patterns for its products, and looking for new channels. An application of this would be how it boosted growth in its disinfecting wipes product line.
According to Clorox’s research, 70 percent of consumers believe that disinfecting surfaces can keep their families healthier, but less than half act on this.14 This gap between beliefs and behaviors represented $400 million in potential sales. Further insights showed that most shoppers prefer to buy preventative health products together and expect to find them in or near the pharmacy. So Clorox developed the “Prevent, Protect & Soothe” in-store display program and worked with retailers to colocate relevant products. In the mix were Clorox Disinfecting Wipes, Campbell’s soup, Brita water filters, and Dial soap—the items you would need to Prevent, Protect and Soothe. The results were very strong. Participating Clorox brands were up 16 percent during the program, led by Clorox Disinfecting Wipes, which were up 154 percent.
To achieve these types of results requires a different focus from what has worked in the past. This includes:
![]() Embracing digital and a multichannel world. Understanding how consumers shop, work, and engage with the brands to increase loyalty and glean insights. This may include the development of convenience apps, subscription-based products, an increased social media presence, and greater integration with retailers.
Embracing digital and a multichannel world. Understanding how consumers shop, work, and engage with the brands to increase loyalty and glean insights. This may include the development of convenience apps, subscription-based products, an increased social media presence, and greater integration with retailers.
![]() Greater focus on experimentation combined with analytics. Leveraging the new digital platforms to test and learn (for more on experimentation, see Chapter 10, “Improve the Odds”).
Greater focus on experimentation combined with analytics. Leveraging the new digital platforms to test and learn (for more on experimentation, see Chapter 10, “Improve the Odds”).
![]() A greater focus on ethnographic research.
A greater focus on ethnographic research.
On this last point, A. G. Lafley, in his book Playing to Win, recalls how P&G leveraged such techniques for product development in India. Chip Bergh, then P&G’s president of men’s grooming, oversaw the integration of Gillette, and then its expansion into India. Bergh’s first direction to his team was simple:
The first thing I want you to do is to spend two weeks in India. I want you to live with these consumers. I want you to go into their homes. You need to understand how they shave and how shaving fits into their lives.
His team pushed back, why go to India? There are plenty of Indian men here in the United States, one of his colleagues challenged. But Bergh persisted.
Later, after the India trip, the same colleague sought him out at an innovation review:
Now I completely get it. You can look at the pictures in the books, you can hear the stories, but it’s not until you’re there [that you understand]. I spent three days with this one guy, shopping with him, going to the barber shop with him, watching him shave. . . . I was so motivated and so inspired, I designed the first razor on a napkin flying back to London.
The new razor was built on insights that they had uncovered during the trip: that most men in India shaved with only a small cup of cold water, and without hot running water to clean the razor, hairs would clog the blade. The new razor took these conditions into account, with a safety comb designed to prevent nicks and an easy-rinse cartridge.
We have focused on consumer goods companies in this chapter to illustrate a broader point and bring the topic to life. After all, it is an industry we can all relate to, as we interact with its products—and its many, many line extensions!—on a daily basis. But of course the point is applicable to any other industry. We have seen this dynamic across the board: from the manufacturing company launching myriad products and undermining its legacy expertise in pump innovation; to the retailer who excelled at operating large-format grocery but went off-track as it tackled the convenience store market overseas; to the financial services company who mistakenly thought that complexity was free and proliferated its services. All strayed from what they did best, saw performance decline, and then had to do the work to recover the core.
For many, the Siren Song was the Expanding Portfolio. For a long time, product expansions were the default means to drive revenue, but they are just one of many adjacencies that companies can pursue. The point is not that adjacencies are intrinsically damaging, but rather that in the Age of Complexity, opportunities seem plentiful, therefore the bar should be higher than ever.
Knowing where and how to expand is the focus of the next chapter.