13
Smartphone Performance
Pablo Tapia, Michael Thelander, Timo Halonen, Jeff Smith, and Mika Aalto
13.1 Introduction
In recent years the wireless industry has witnessed an impressive surge in smartphone and data services adoption: in 2013, smartphones accounted for nearly 50% of worldwide handset sales; however, in the USA alone this figure was even more dramatic, surpassing the 90% mark [1].
While the wide adoption of data services is quite positive to the operator from a revenue standpoint, there are big challenges associated with the amount of traffic being generated by modern smartphones. Smartphones are powerful computing devices with fast Internet access speeds that enable a similar connection experience to that of typical home computers. Such performance levels permit wireless customers to enjoy a wide range of wireless services, from typical web browsing to live streaming of high definition video, which entails a higher consumption of data content overall. Furthermore, as will be analyzed later on this chapter, the better the device, the more data it is bound to consume, which puts operators in the difficult situation of juggling the desire to satisfy their customers and the need to limit their impact on network resources.
The resource consumption associated with increased smartphone penetration is not only tied to the amount of data transferred, but also involves an even higher increase of network signaling: unlike typical computers, smartphones are always connected to the network, contributing to the overall traffic with a myriad of small, intermittent packet flows that have put in check many of the design fundamentals of the original HSPA equipment, creating bottlenecks in the control plane rather than in the user plane, as everyone expected. This chapter will analyze in detail how this signaling is generated, establishing comparison across different operating systems and applications, which are ultimately responsible for these harmful effects.
The second part of the chapter is focused around smartphone customer experience. Most consumers' experience with mobile broadband stems from their use of a smartphone. As such, from a mobile operator's perspective they should place concerted effort on ensuring that the experience is a good one. One common belief in the industry and among consumers is that a “faster network” provides a better user experience, meaning that a consumer's experience with a smartphone will be inherently superior in an LTE network than an HSPA+/DC-HSDPA network. The reality can be somewhat different.
The operator with the fastest network, as determined by measurements that focus solely on throughput, will have an inherent advantage when it comes to marketing the service offering. However, the higher data speeds may not translate into a better user experience. In this case, the user experience is defined by the parameters that the mobile data subscriber actually observes while using the smartphone. Examples include:
- Video playback start time and the amount of buffering that occurs during the video playback.
- The battery drain on the device along the day.
- The time required to begin interacting with a social networking service.
- The time to load a certain web page, to name a few.
To varying degrees, the actual throughput capability of the underlying cellular network impacts these parameters. However, there is a diminishing return and beyond a certain threshold higher throughput is inconsequential. There are also other factors that influence the user experience, and in many cases these factors have a greater influence on the outcome, meaning that they undermine the potential benefits of having a faster network.
In this chapter we analyze in detail some of the key aspects that influence the end user experience, and provide some guidelines about how smartphone performance can be tuned to take full advantage of the HSPA+ technology.
13.2 Smartphone Traffic Analysis
HSPA networks were not originally designed to carry traffic types such as those observed from smartphones today. Both downlink and uplink channels were conceived to transfer large volumes of data very efficiently at high speed, however the traffic patterns observed in today's networks are somewhat different. Understanding the nature of smartphone traffic is important to try and improve the efficiency of data transmission across the network.
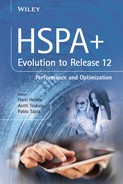
Figure 13.1, from a network with a large penetration of smartphones, illustrates the share of data consumption compared to the number of session requests, for uplink and downlink sessions. This chart shows the large asymmetry in data consumption between the uplink and downlink directions, with most of the sessions initiated at the mobile device side.
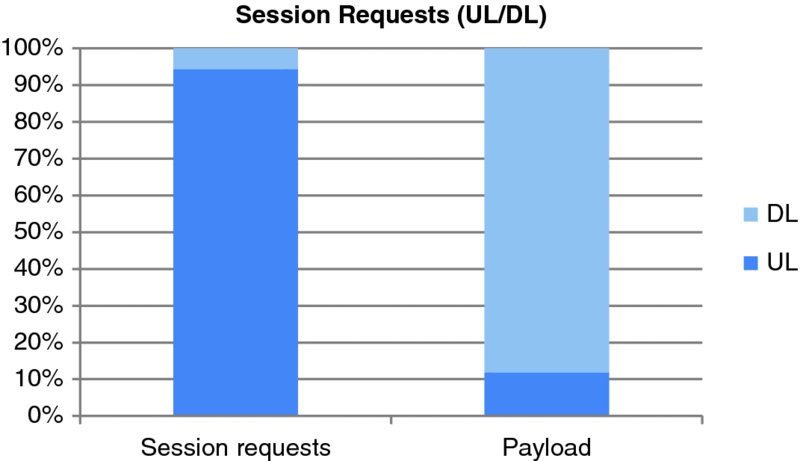
Figure 13.1 Downlink vs. uplink radio traffic characteristics
In terms of actual content, it is worth differentiating between data volume and frequency of access, which is tied to the popularity of one particular application. Figure 13.2 illustrates this.
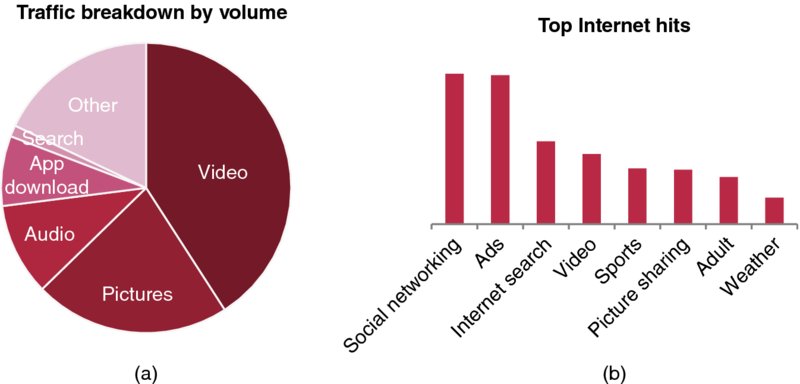
Figure 13.2 Typical traffic breakdown in an example network, in terms of volume (a) and service usage (b)
As Figure 13.2a illustrates, a large part of the data volume is consumed by video content; however, although this service is quite popular, it is not as dominant in terms of frequency of access. This is due to the nature of the video service, in which one single session will generate a significant amount of traffic, typically in the order of 200 MB per hour. On the other extreme, Internet searches are quite frequent but generate only a very small amount of traffic. One interesting aspect to note is the popularity of social networking services, such as Facebook and Instagram, and how they are increasingly generating larger amounts of volumes due to embedded multimedia sharing capabilities.
Smartphones tend to transmit a significant number of small packets in quite short sessions, which is referred to as “chattiness.” This device chattiness is principally caused by smartphone “apps” that operate in the background and periodically retrieve small amounts of data with status updates; examples of these apps are weather widgets, social network updates, tweets, and so on. This is not reflected in Figure 13.2 because those URLs are hard to classify within a single content group.
Figure 13.3 compares the amount of data that is sent within every HS-DSCH session for three types of HSPA+ networks: a smartphone-centric (left), a USB-dongle centric (right), and one with a mix of devices. As can be observed, smartphone-centric networks tend to transmit smaller amounts of data each session, which is related to the device “chattiness” previously discussed.
Figure 13.3 Data transfer per HS-DSCH allocation for various network types
Considering that smartphone networks transmit an average of 100 kB per HS-DSCH session, with default inactivity timers set to 8 s this results in about 2% efficiency during data transfer, assuming a downlink data transfer of 5 Mbps. Figure 13.4 illustrates this idea.
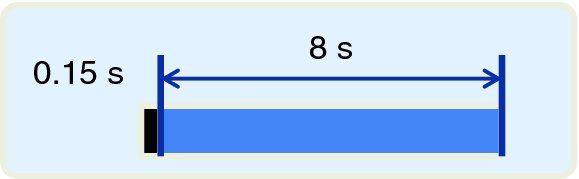
Figure 13.4 Illustration of inefficient use of the DCH channel for smartphone traffic
This explains in part why networks with high smartphone penetration suffer from uplink interference effects: smartphone devices keep transmitting unnecessarily in the uplink direction while the channel is up. Uplink noise problems are discussed in further detail in Chapters 4, 10, and 12.
Figure 13.5 shows the distribution of packet sizes transmitted in uplink and downlink, in the same network discussed earlier. As can be seen, the use of small packets is quite dramatic in the uplink direction, mostly due to TCP acknowledgements sent for downlink data; due to the asymmetrical nature of the data, the number of acknowledgements sent in the uplink direction is much larger than in the downlink direction.
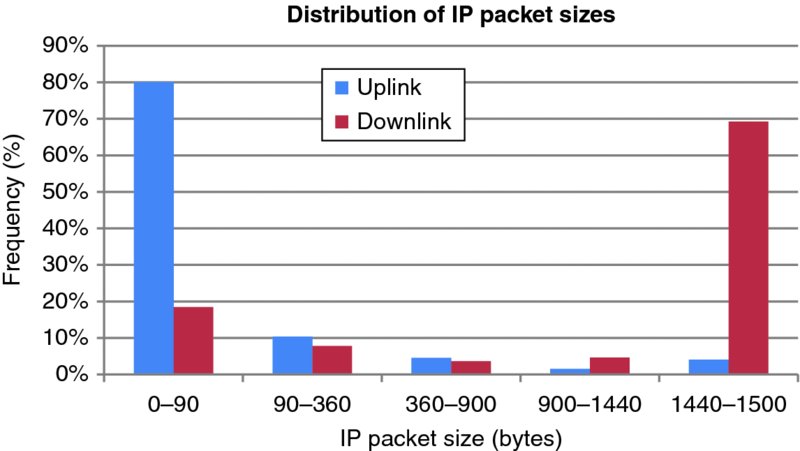
Figure 13.5 Distribution of IP packet size in both directions (uplink and downlink)
Note that even in the downlink direction, about 25% of the packets transmitted are quite small, often fewer than 90 bytes. The transmission of such small packets results in a poor utilization of the radio interface: even when the radio layer is capable of transmitting large amounts of data, the application layer is only sending small chunks at a time, resulting in a waste of radio resources.
Consider the size of the packets and sessions being transmitted compared with the block sizes transmitted at the MAC layer: a MAC block of a HSPA+ single carrier device will transfer between 6000 bits (750 bytes) in poor radio conditions, up to 30,000 bits (3750 bytes), every 2 ms. In the case of dual-carrier devices, the amount of downlink data transferred doubles. This means that for 35% of the packets, even at poor radio conditions the MAC block is either not fully utilized, or sent with a less efficient modulation and coding scheme. Therefore, the spectral efficiencies attained in real networks with a large amount of smartphone traffic will be far from the theoretical figures, which can only be reached when operating in full buffer mode. Code multiplexing can help improve efficiency in networks with small packets by allowing multiple users in parallel per TTI.
Due to the characteristics of smartphone IP traffic, including asymmetry and chattiness, there's a great potential to tackle this problem at the upper layers, including optimizing the individual applications and services; and creating smart methods at the operating system level to control transmission at the packet level. Some of these potential optimizations will be discussed in this chapter.
13.3 Smartphone Data Consumption
The exponential increase in network data consumption can be distilled into three main causes that will be analyzed along this section:
- Increased penetration of smartphones in the device base.
- Increasing consumption with newly released smartphones.
- Excessive resource consumption from a small percentage of customers.
Smartphones typically consume over ten times the amount of data of regular feature phones. The reason for the increased data consumption is the improved usability and connection speed that smartphones present, as compared to typical feature phones that are cumbersome to use and have limited data capabilities. Consider the example of a web browsing experience in a smartphone, featuring a browser capable of rendering full web pages in a high resolution display, as compared to a clumsy browser in a feature phone which can possibly only show WAP content and which is hard to navigate and scroll: naturally, the customer with the smartphone will tend to watch web content more often than the one with the feature phone, even if the feature phone was able to offer equal data access speeds.
Another example of higher content consumption comes from the increased popularity of online video services. One hour of online video can consume between 200 and 350 MB, depending on the service. Consequently, as smartphone penetration increases in the base, massive uptake in overall network data volumes is expected, thanks both to the increased amount of active data plans – which are typically required by operators from smartphone users – as well as the difference in monthly consumption between smartphones and feature phones.
The increased data consumption is also noticeable across different smartphone devices: newer smartphones present better characteristics than previous versions, which in turn result in higher data consumption. Two key factors play a role in this: the size of the screen and the Internet user experience of the device. Figure 13.6 illustrates the impact of these two factors in monthly data consumption, from statistics collected in a Tier 1 US operator.
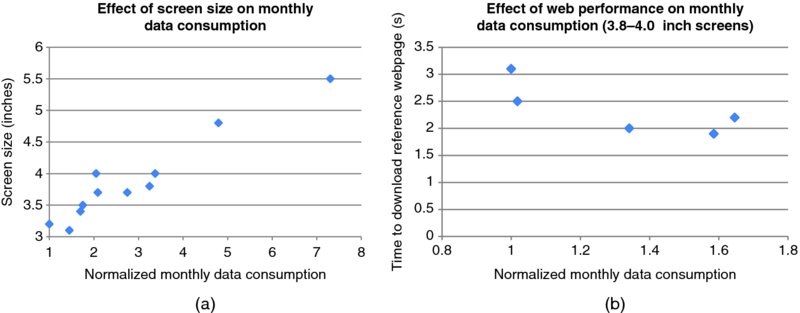
Figure 13.6 Effect of screen size (a) and user experience (b) on monthly device consumption
Figure 13.6a illustrates the relation between screen size (in inches) and monthly data consumption. The results show that a device with a 5.5-inch screen consumes more than seven times the amount of data of a device with a 3.2-inch screen, and about twice as much data as a device with a 4-inch screen. There are two main reasons for the increased consumption with larger displays: first, customers with large displays are more prone to using their devices to access multimedia content; and second, larger screens demand larger images and videos, which account for the majority of the data payload in the device.
Improved Internet data experience also plays a role in driving data consumption: phones that offer a better data user experience tend to consume more data, as illustrated in Figure 13.6b. The chart compares phones with a similar screen size and different web browsing speeds, and shows how the devices with a faster web browsing speed (lower time to download a reference webpage) can consume over 50% more data than similar smartphones. It is important to note that the correlation is related to the web performance rather than the device category: the download and upload speeds are irrelevant if these are not translated to an improved user experience.
Another interesting aspect to note with regards to smartphone data consumption is the role of the operating system. There are notable differences in the methods used to control the way the devices access the network: some OS permit the transmission of background data, while others don't; some OS permit the customer to configure the quality of the video services, while others don't, and so on. Furthermore, there have been observed significant differences between different versions of the same operating system, as illustrated in Figure 13.7 which compares the average consumption of different Windows mobile devices with versions 6.5, 7, and 8 – all of them with the same screen size (4.3 inch). In this case it can be observed that Windows Phone 8 devices tend to consume much more data than their predecessors – in this particular case, mostly due to the default configuration of the video service quality.
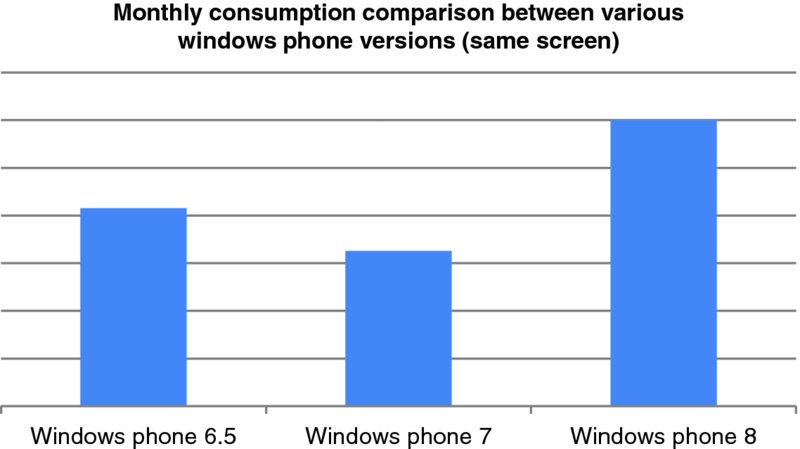
Figure 13.7 Data consumption differences based on OS version
Increased data consumption isn't always good news for the customer nor the operator. In the case of customers, if they are not careful they can quickly consume their monthly data quota if they access multimedia content frequently. For example, a typical Netflix movie can consume about 500 MB in a regular smartphone, which means that customers with data plans of 2GB per month will run over their monthly quota after having watched just four movies.
For operators, increased data consumption will force additional network investments to cope with the capacity demands, or else face customer complaints due to performance degradation in the network. One interesting thing to note when analyzing customer consumption patterns is the fact that not all customers access the network in the same manner; therefore it is good idea to classify customers based on typical monthly usage. Figure 13.8 illustrates the consumption patterns in an example network in which there are no data consumption limits.
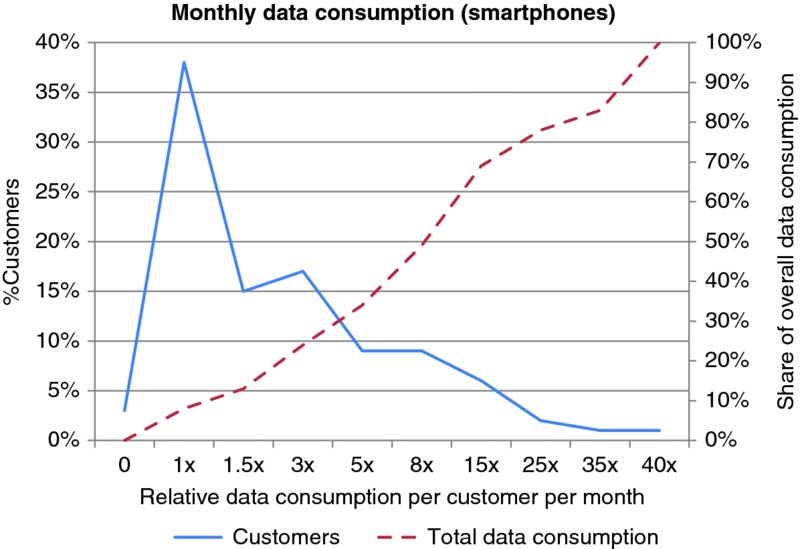
Figure 13.8 Distribution of monthly data consumption (smartphone users)
As the figure shows, there is a minority of customers that consume an excessive amount of data: in this example, 2% of the users account for over 20% of the overall data transferred in the network. In order to minimize capacity investments, and at the same time preserve the service satisfaction for the majority of the customers, the operator can implement different data control mechanisms to prevent harm from these excessive users, including data bitrate capping, blocking of certain operations such as peer-to-peer transfers, tethering, and so on.
In addition to volume consumption, the operator needs to analyze other forms of resource consumption by the smartphone devices, such as signaling. Sometimes it's less harmful for the network to transmit a large volume of data than a myriad small packets, as will be discussed in detail in the following sections.
13.4 Smartphone Signaling Analysis
The increased penetration of smartphone devices has caused a rapid increase in the signaling load at the network level. As Figure 13.9 illustrates, the growth in signaling traffic in many cases has been faster than the data volume growth, leading to congestion, dropped calls, and increased access failures.
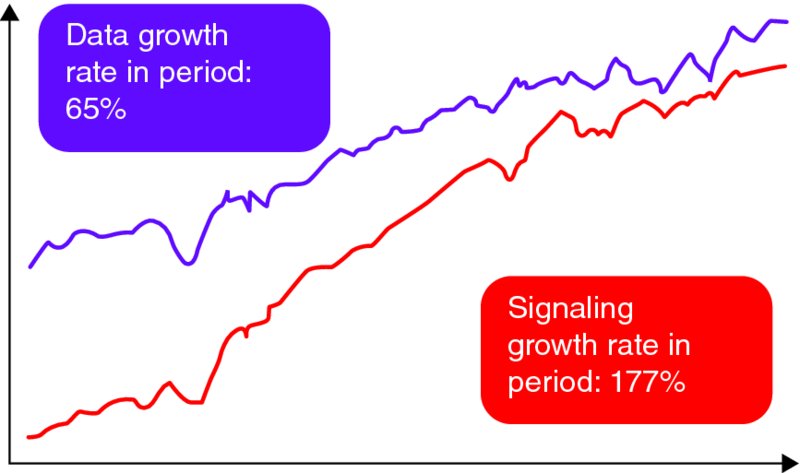
Figure 13.9 Volume vs. signaling growth example from a live network
On the device side, their excessive connectivity has also led to poor battery life, unresponsive user interface, slow network access, and non-functional applications for many smart device users.
End users do not notice the impact of increased signaling directly; however, overall this results in a decreased quality of experience (QoE). To overcome these problems, network operators have increased their investments beyond their original capacity expectations.
The operators can, however, try and minimize the impact of poor performing devices by analyzing the behavior of their smartphones. This section describes a methodology to analyze network impact from smartphones, mobile applications, and mobile operating systems.
13.4.1 Smartphone Profiling
Smartphone profiling consists of the analysis of multiple protocol layers and their inter-related behavior in complex end-to-end systems. Promoting network friendly smart devices and applications can help operators avoid unnecessary capacity expansions, as well as improve user experience – which will in turn result in better customer loyalty. As will be discussed in more detail in the next section, the user experience depends on various factors, including network performance and the specific application being used. Even the battery life time of a mobile device can be impacted by network features, as well as by well designed and implemented applications. Figure 13.10 illustrates the various components that need to be considered when analyzing smartphone performance.
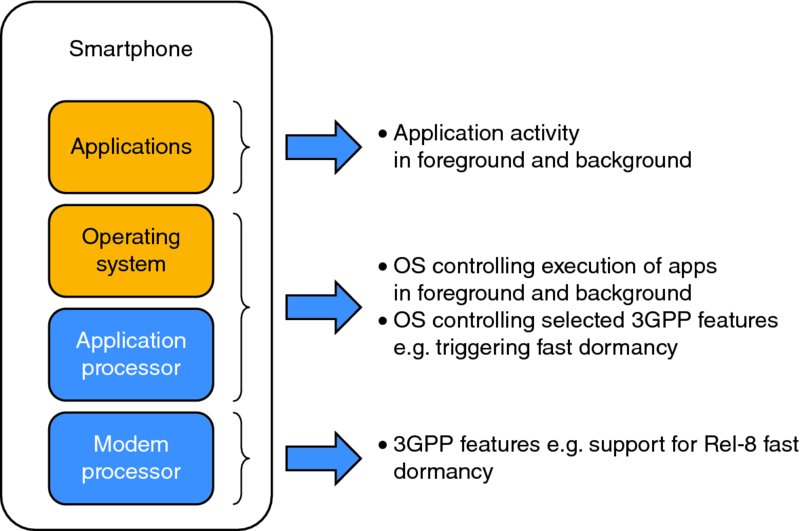
Figure 13.10 Components impacting smartphone performance
Some of the features that need to be taken into account when analyzing smartphone performance are standardized by 3GPP. Those features are implemented at the modem chip set level and are either fully controlled by its firmware or partially by the mobile OS. On the network side, the 3GPP features are split between access stratum (i.e., radio access network) and non-access stratum (i.e., core network). A good example of one such feature is the so called “network controlled fast dormancy” or 3GPP Release 8 fast dormancy: when properly utilized, this feature can help optimize the amount of signaling caused by RRC state changes, at the same time that the device battery life is extended by making a better use of the CELL_PCH state.
There are also important features that are implemented outside of the 3GPP domain, such as the operating system of the device. One example of this is the implementation of OS keep-alive messages required for push notification services. Always-on applications use push notification services, which send messages from the network servers to clients in mobile devices. These notifications require persistent TCP connections, which again require periodical keep-alive messages to keep the TCP connection established. The lower the keep-alive frequency is, the fewer transactions that generate additional RRC state changes and signaling.
The implementation of specific applications also plays an important role in user experience and network resource consumption. For example:
- An application that displays advertisements can decide how frequently it fetches new ads from the network. A badly designed ad-funded application generates frequent network transactions, and in the worst case synchronized transactions over the whole user base.
- The coding and packetization used to transmit Voice over IP (VoIP) data can impact the load in various packet forwarding network elements.
- Audio and video streaming apps can select different protocols to deliver the content over the mobile network, and depending on the selected method user experience and battery life time varies. This specific example will be discussed in more detail in Section 13.5.6.5.
13.4.2 Ranking Based on Key Performance Indicators
To analyze smartphone performance, the devices will be profiled based on a set of key performance indicators that rank the network-friendliness of applications and smart devices with regards to key network domains like mobile device, radio, packet core, transport, and IP edge (firewalls, NATs, etc.).
The advised ranking-based methodology presented in this section enables mobile operators to find the ideal balance between the best user experience and the lowest impact on network performance.
Smart devices are tested with real applications or services such as Voice over IP (VoIP), mobile video, and social media in order to emulate as close as possible the behavior of a typical smartphone user. The smartphone profiling provides essential insight into the interaction between factors such as smartphone battery life and applications or operating systems. For example, Figure 13.11 illustrates a comparison between two different smartphones running a social networking application.
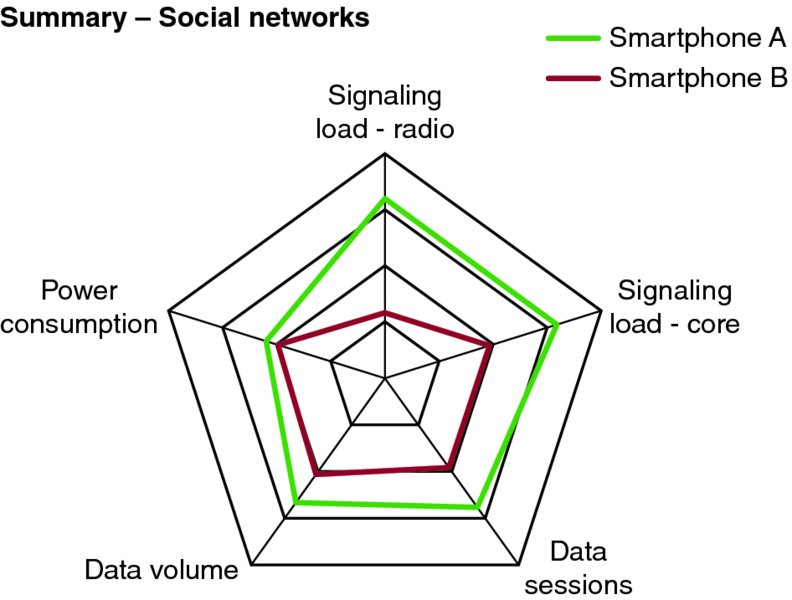
Figure 13.11 Example profiling of a social networking app in two different smartphones
The profiling of smartphones provides a relative ranking for applications or devices, based on their behavior in a real environment. This enables mobile operators to make performance comparisons systematically and quantitatively.
13.4.3 Test Methodology
The profiling of a smartphone device is performed both for single applications and with multi-application profiles – in which the device is loaded with multiple commercial smartphone applications such as Facebook, Skype, email, and so on. Both test methodologies will utilize busy – typical use of the applications – and standby test profiles. The standby mode is used to characterize background activity, that is, when the device is powered on, but not actively used. Both profiles are equally important to understand the performance of the devices and applications, as illustrated in Figure 13.12.
- Standby testing reveals specific issues related to OS or applications, like too frequent keep-alive messages or lack of synchronization with keep-alive messages. It also helps to better understand why certain smartphones drain their battery faster than others.
- Tests with busy profiles provide information about busy hour signaling and power consumption of the device as well as protocol behavior of the applications.
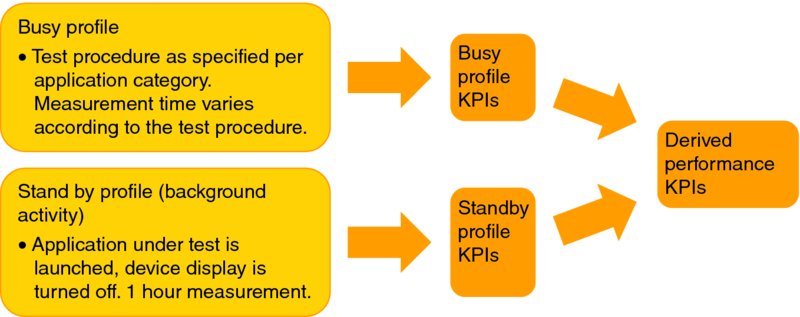
Figure 13.12 Both busy and standby profiles are used to determine overall device performance
The busy profile test cases are application specific and emulate the typical usage of the application. The example in Figure 13.13 is taken from a VoIP application testing with alternating Mobile Originated (MO) and Mobile Terminated (MT) calls, with periods of inactivity between calls to capture all necessary signaling. Call length can be operator specific, but the breaks need to be long enough to capture inter-call signaling.
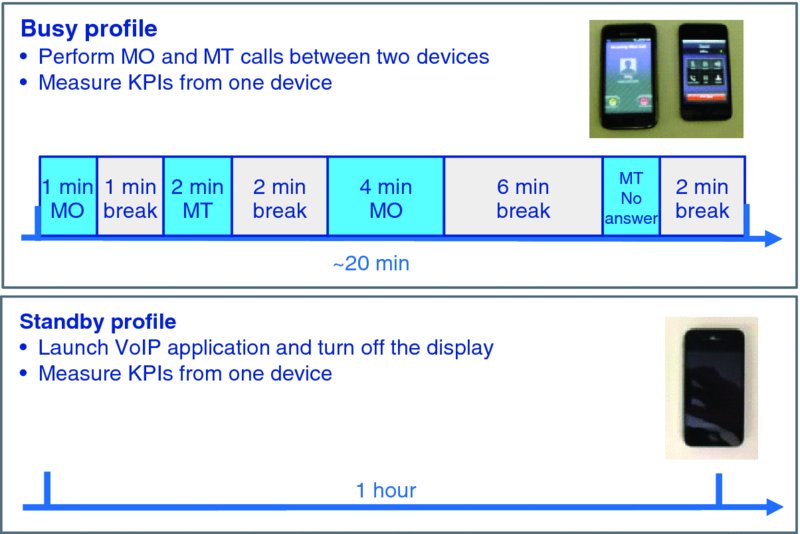
Figure 13.13 Example VoIP application activity for busy and standby profiles
The standby profile test is simply a one hour test in which the application is activated, although not actively used. This same test case can be used for any application category, and provides understanding of the keep-alive process of the application, as well as useful insight about specific app behavior; for example, in the case of a VoIP call, it explains how presence signaling works in the background.
Figure 13.14 shows an example of a multi-application test.
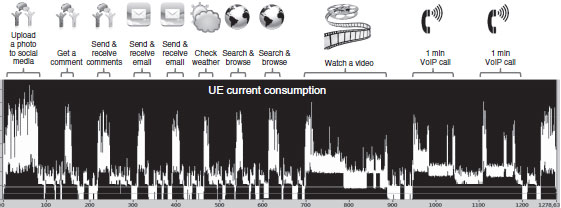
Figure 13.14 Device testing with a multi-app profile
The multi-application test case in this example includes six different applications, and its main goal is to emulate the typical smartphone user's busy hour behavior. Applications can be operator specific (e.g., top 10 applications), but this profile should not change too often to be able to compare several smartphones over time.
13.4.4 KPIs Analyzed during Profiling
Figure 13.15 illustrates the most typical measurement points and KPIs used for smartphone profiling. It is important to define a set of standard KPIs together with standard test procedures, to facilitate the comparison of applications within the same application category.
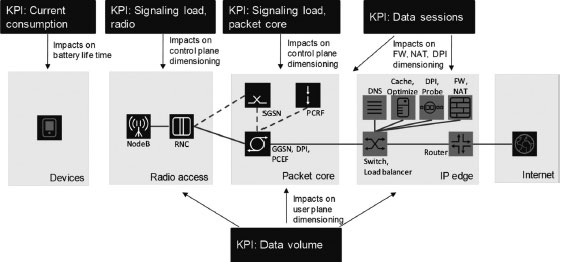
Figure 13.15 Measurement points and KPIs collected during smartphone profiling
The following KPIs are typically used to measure network impact and end user experience. All network KPIs are collected for both busy and standby profiles to understand the impact to different network domains.
-
Total radio state change signaling frequency in RNC
This KPI is used to evaluate the impact on the RNC control plane load. The total number of external (Uu/Iub, Iur, Iu) signaling messages due to radio state changes is measured over time and reported as frequency (msg/min).
-
RAB establishment frequency
This KPI is used for evaluating the impact on RNC and SGSN control plane load, as well as the impact of direct tunnel. The total number of successful RAB establishments per minute (RABs/min) is measured.
Note that this KPI is not that significant with modern Release 8 fast dormancy smartphones that tend to stay always RRC connected. However, if there are still old devices in the network, then legacy fast dormancy impacts on this KPI.
-
Total IP volume
Total IP volume (bytes) is measured separately for uplink and downlink. When the measurement period is taken into account, the average IP throughput (bits/s) can be calculated. The data volume includes the UE endpoint-specific IP headers.
-
TCP/UDP data sessions
This KPI is relevant for network elements and functions that handle IP flows such as firewalls (FW), network address translation (NAT) and deep packet inspection (DPI) functions. Total number of TCP and UDP sessions is measured.
-
Current consumption
Average current (mA) is measured over the test period. In the case of a smartphone (or a tablet), the total UE current is measured. In the case of a USB dongle, only the dongle current is measured. The current consumption (mAh) is calculated by multiplying the measured average current and elapsed time.
13.4.5 Use Case Example: Analysis of Signaling by Various Mobile OSs
This section presents the results of a smartphone profiling exercise that involved multiple devices using Android, iOS, and Windows Phone. The objective of this test was to analyze the relative performance of each Operating System (OS) in terms of radio network signaling, in particular.
Figure 13.16 illustrates the standby traffic pattern of three different smart devices from three different mobile OSs and highlights the impact of synchronized keep-alive messages. All devices were tested against a multi-application profile, that is, there were several applications installed and activated in each of the tested smartphones.
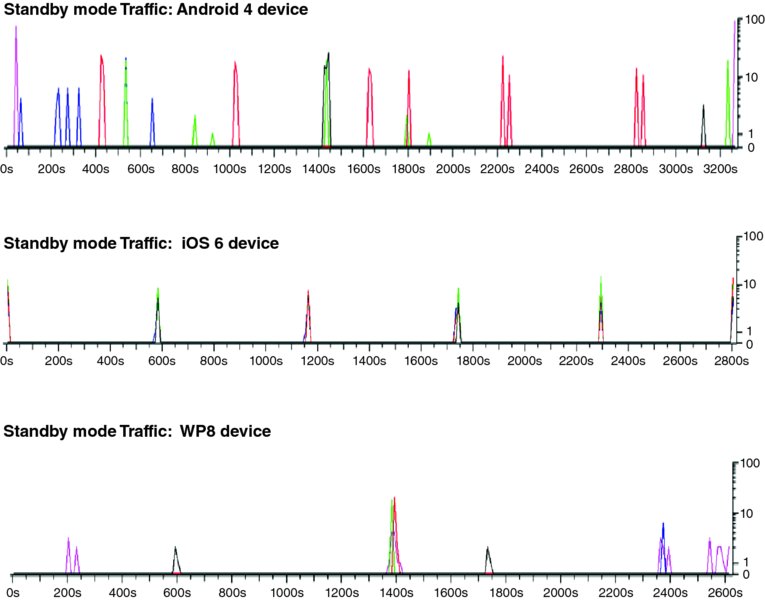
Figure 13.16 IP packet transfer during standby tests for different operating systems
During the standby tests, most times a new packet needs to be sent, it will trigger a transition in the channel state involving a number of RRC message exchanges. Frequent signaling will impact device current consumption negatively, because every transaction will require several seconds of RRC connection in the Cell_DCH or Cell_FACH channel.
As Figure 13.16 illustrates, there is a significant difference in the standby transfer profile of the operating systems analyzed: iOS and Windows Phone devices tend to transmit less data, and the data transfer is performed in a synchronized manner. By aligning the messages, more data can be transmitted within the same state, for example, Cell_DCH, and fewer RRC state transitions are required.
Figure 13.17 illustrates the number of state transitions for the same multi-application test case. Test results are grouped by non-Android (cases 2 and 3 from the previous example) and Android devices to highlight the difference between operating systems. Both “stand by” and “busy” profiles are analyzed.
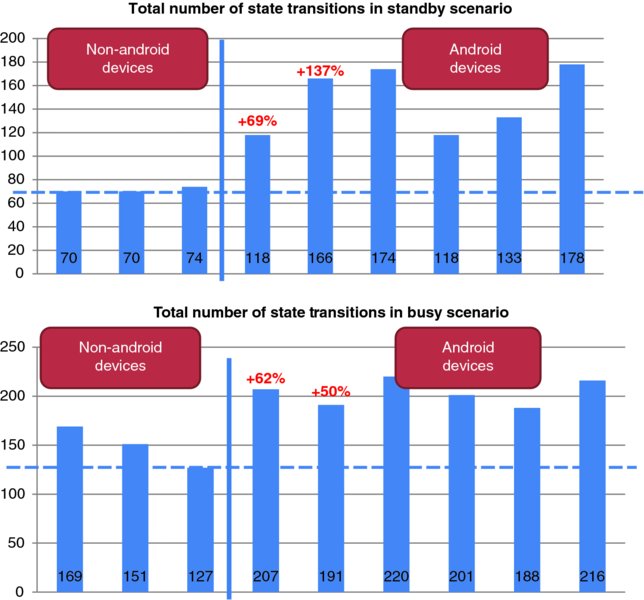
Figure 13.17 Radio signaling comparison of Android vs. non-Android devices
As explained earlier, the main difference can be explained by the lack of coordinated keep-alive messages in the Android operating system. The difference is obviously bigger in the “standby” case where keep-alive messages are contributing most of the traffic, but it can be also seen in the “busy” case. The performance variation within Android devices can also be explained by the lack of use of Release 8 fast dormancy in some of the devices.
13.4.5.1 Discussion of the Results
All major smartphone operating systems include support for multitasking: when an application is switched from the foreground activity control, all operating systems suspend the app unless the app is specifically designed to run in the background. In the background, apps can perform selected functions allowed by the operating system. For example, VoIP calls and music playback can be executed in background; location tracking is another important function supported in background execution. Background apps can make use of network connections and trigger data transactions.
To better support network connectivity of background applications, all of the operating systems analyzed include a push notification service, which is based on a network service provided by the OS vendor. Windows Phone, iOS, and Android devices can communicate with Microsoft Push Notification Service (MPNS), Apple Push Notification service (APNs), and Google Cloud Messaging (GCM) respectively.
The multitasking capability of always-on apps and push notification services enables frequent data transactions even if the smartphone owner is not actively using the device. The application developer is responsible for the app behavior and can significantly impact on the signaling load as well as UE current consumption both in foreground and background periods.
The specific OS impacts the behavior of the persistent connection to the push notification service. OS vendors also define the policies for accepting apps to the application markets, as well as whether the apps must use the push notification service provided by the OS vendor. Microsoft and Apple have tighter controls for app certification and usually all apps must use the centralized push notification service provided by the OS vendor. The Google and Android ecosystem leaves much more freedom for app developers to design networking features and publish apps, therefore GCM is not mandatory and many apps use their own persistent connections to application-specific servers. In practice, this means that Windows Phone and iOS devices have better capability to control background activity and, for example, synchronize keep-alive and push notification transactions. Android devices tend to generate more signaling traffic, because different always-on apps may generate independent, non-synchronized keep-alive and push notification transactions in background. At the time of writing this chapter, Google was actively working on improving these aspects with various GCM and Android initiatives.
13.5 Smartphone Performance
All network operators strive to offer the best possible service experience to their customers; however, this goal is becoming increasingly challenging as data services become more prominent. Unlike in the case of voice, which was a relatively simple service to analyze, data services are more complex and often typical network KPIs do not provide the required observability to understand their performance. As will be discussed later in this section, there is not a single “data service” experience, rather a service experience linked to each individual data service: web browsing, video streaming, social networking, and so on.
Understanding the end user experience requires the analysis of multiple factors, from devices to networks and services. Table 13.1 provides a list of some of the factors that play a role in the customer experience with smartphone devices, broken down into two major categories: battery life and Service Quality of Experience (QoE).
Table 13.1 Summary of key factors affecting smartphone performance
| E2E domains User experience |
Smartphone HW/SW design by OEM |
Network capabilities and conditions |
Applications and services Client and server design and conditions |
| Battery life | Battery capacity HW component selection (e.g., display) Chipset energy saving features Standby activity by OS and OEM SW package |
Energy saving features in radio RF conditions impacting on Tx power RF condition, load and QoS policies impacting on upload/download times |
Application background activity Content delivery solutions (e.g., frequency of ads) |
| Application/service QoE | Display quality, touch screen performance CPU performance, memory size Modem performance (category) OS multitasking IP stack |
RRC state transition performance RF condition, load and QoS policies impacting on packet loss and upload/download times TCP and content optimization |
Server location, load and capacity App UI design App background behavior Application layer protocol design Content optimization IP stack |
At a very high level, the main areas to be considered are:
- Battery Performance. One of the main sources of grief for smartphone customers is the poor battery life of these devices, compared to the previous generation of feature phones. Smartphones are more heavily utilized than their precursors; however, there is still room for improvement at the cellular, OS, and app level.
- RF Coverage. A fast performing network is meaningless if it is being accessed from an area where there is poor or no coverage. The quality of the RF signal is intimately tied to the maximum speed that can be delivered by the network. When accessing the service outdoors and/or under lightly loaded conditions the networks are typically capable of delivering the promised data rates; however, under more challenging conditions, such as indoors, the measured RF signal levels (RSCP, RSRP) can be quite low and this situation results in a poor user experience.
-
Network Connection Times. Before the first byte of application data is sent, the smartphone must connect to the network and perform a DNS query to determine the location of the host web site. Although in many cases the total connection time is relatively inconsequential, in some cases it can easily be on the order of several seconds, which can be equivalent to the actual transfer time of a modest amount of data.
- Effects from TCP Protocol. Most of today's applications are based on the TCP/IP protocol stack. Although TCP is the most widely used protocol in the Internet, it presents significant challenges in wireless networks, as the multiple versions of the protocol that are “optimized” for wireless give testimony1. The variable nature of the air interface interferes with the control mechanisms in TCP, which often results in reduced bitrates or data stalling situations.
- Operating System Influences. The various operating systems have different ways to control data transfer, which can affect network and device resource consumption. Also, in many cases the same application behaves entirely differently based on the underlying operating system. For example, a Facebook photo upload, operating on iOS, is faster than Facebook in Android due to the fact that the iPhone app resizes or compresses the picture before uploading it to the network.
-
Application Characteristics. The characteristics of the application can be of paramount importance when it comes to defining the user experience. “Chatty” applications, for example, can require lots of back and forth interactions between the smartphone and the network with only small amounts of data being transferred during each interaction. This situation can negate the benefits of an otherwise fast network. In this case, network latency could have more influence on the user experience. The size and layout of a web site can also influence the time required to download a web page. On the other hand, an application can also mask the true performance of a poor performing network and give the user a far better experience than would otherwise be the case. For example, an application could upload content, such as a picture, in the background so the user isn't aware how long it takes. Alternatively, the application could use compression to reformat the content of the transferred data and ultimately reduce the size of the uploaded picture or the downloaded video.
Applications can also be optimized in other ways to provide a better user experience or to shorten the total user transaction time. For example, a robust predictive text algorithm or the use of voice recognition software could reduce the time required to perform a search function or to enter a destination in a maps application. This capability would be entirely independent of the network's capabilities but from the user's perspective it would still lead to a better experience.
Understanding the behavior of each of these applications and their performance over the wireless network is an important step towards the optimization of the smartphone experience. In this section we analyze two of the most common applications in use today, web browsing – which is the basis for most common “apps” – and the video streaming service. As discussed earlier, these services represent the most popular traffic in terms of number of transactions and volume, respectively.
13.5.1 User Experience KPIs
In a world dominated by data services, defining the right measurements is a key step towards understanding and maintaining proper customer experience. Previously used KPIs, such as access failures and drops, are not so meaningful when referring to data services, as in many cases a data drop will not even be noticed by the consumer. It is therefore important to define a new set of metrics that “make sense” from a data utilization point of view; these metrics will have to be defined at the application level, such as the “time to access video content,” “time to download a web page,” or the “number of rebuffering events” during a video playback.
These complex KPIs cannot be captured using typical counters, and require the deployment of new elements, such as network probes, that can capture per-session data to extract the necessary information. To complicate things further, the KPIs should be able to tell, in the case of a performance issue, whether the problem lies in a specific radio network element or in other part of the communication path. There are various alternatives to implementing these new KPIs, including the use of network probes, leveraging special UE reports provided by applications (Real User Measurements – RUM), and the use of custom UE clients, such as carrier IQ.
Network probes require significant infrastructure and expense to instrument. To manage scalability and cost, they are often deployed near the GGSN/PGW, or only at a few locations. Due to this placement well before the radio interface, they are often limited to connected user experience and cannot measure the impact of connection setup latency or failures. This lack of visibility is significant as the setup latency and failures may have a much large impact on user experience than round-trip delay. Core network probes are therefore good at detecting service failures, or massive numbers of errors, but do not provide an accurate picture of user experience. Alternatively, probes can be deployed at the last mile transport connection, which can capture the effects from the radio access network. This information can be combined with control plane traces from the RAN elements to provide an end-to-end picture of the data connection.
UE reports, also known as Real User Measurements (RUM), are often collected by web sites, applications, and video services. These reports are often very specific to the service and can include time spent on a web page, application launch time, web page launch time, video start time, and various client parameters, to list a few. Since these are done directly on the device, they sometimes include both connecting and connected latency; however, it really depends on the service's goals. This information is not normally available to the carrier so they must instrument their own RUM measurements.
Special UE clients, such as carrier IQ, can also be used to capture the customer experience at the device side. This type of client can provide unique information, such as battery performance, that is otherwise not visible to the operator; these clients can also be developed to capture certain data level KPIs; however, they are typically limited in the amount of information they can capture.
13.5.2 Battery Performance
The battery consumption in smartphones is one of the key aspects affecting customer perception of the device. No matter how fast the device performs, if it can't survive at least one day with a full charge, it will be a nuisance to the consumer, who will need to be continuously looking for ways to charge the phone. Such was the case with early HSPA+ smartphones, and has happened as well to current LTE devices. Apart from the fact that customers tend to use their smartphones much more extensively than previous feature phones, there are clear outliers that have a significant impact on battery performance, some of which can be mitigated by proper device and operating system design.
Figure 13.18 illustrates the result of lab test performed by the T-Mobile validation team, considering a 24-h drain on an active user profile. The key elements involved in battery drain in this particular example are ordered from higher to lower.
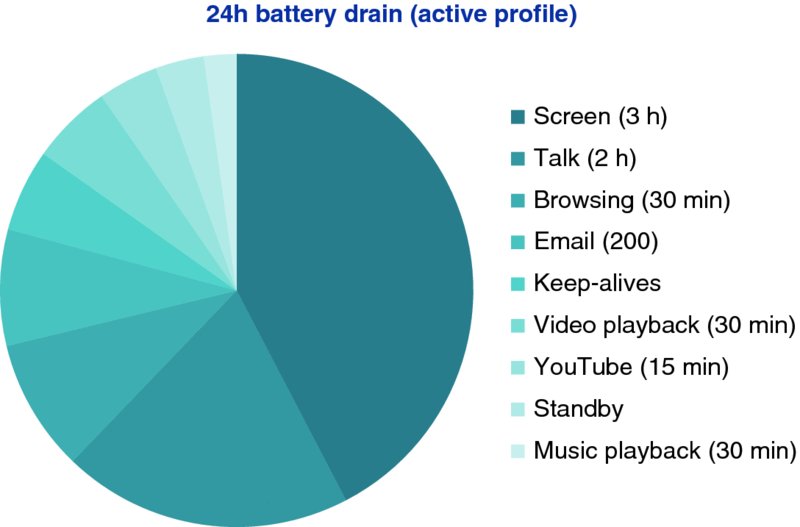
Figure 13.18 24-h smartphone battery drain for an active profile (lab)
As the figure illustrates, the primary source of battery drain is the phone screen. Unfortunately, the screen technology plays a major role here and there are no quick wins to improve this item, apart from playing with dimming and other areas that are really not related to the cellular technology. Next, in this case, is the talk time, which has been extensively optimized as compared to early 3G phones and it is expected to see little improvement in the future.
On the other hand, the chart shows some opportunity to improve the cellular performance when using certain applications, such as web browsing, email, and YouTube. Section 13.5.6 will discuss the impact that app design can have on battery life, through the analysis of various streaming services.
As discussed in Section 13.4.5, it should be noted that keep-alive packets can have much more relevance than is reflected in this chart, due to the fact that lab profiles tend to be less “chatty” than real life situations. There are several possible techniques to mitigate the impact from chatty apps, including special mobile clients that can be used to reshape the signaling behavior of the device. Table 13.2 illustrates the test results of one of these clients, from SEVEN Networks, that shows the potential to optimize the standby mode battery drain. In this particular case, a mixed profile of apps was used and left in background (standby) mode for two consecutive hours in a live network. The device using the optimization client experienced a battery drain of less than half as compared to a regular device.
Table 13.2 Impact of handset optimization client (2 h test)
| KPI | Normal | Optimization client |
| Number of RRC messages | 2091 | 414 |
| Max time between state transitions | 1 min | 15 min |
| Av current drain | 30 mA | 12 mA |
Another method to improve battery drain is to optimize the use of RRC states: Cell_PCH, Cell_FACH and Cell_DCH, for which the use of Release 8 fast dormancy can play an important role. In particular, devices that spend more time in PCH state tend to fare better in terms of battery life. The charts in Figure 13.19 illustrate the difference in RRC state utilization in two comparable high-end smartphone devices; as the figure on the right shows, the device that makes better use of the RRC states consumes around 25% less battery than the non-optimized device.
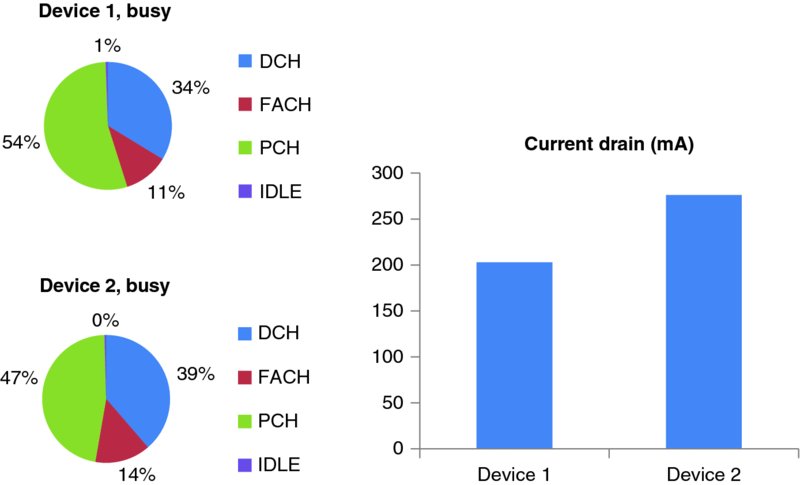
Figure 13.19 Usage of RRC states and battery consumption for two comparable smartphone devices
The Continuous Packet Connectivity (CPC) feature can also be utilized to reduce the battery drain on smartphones, thanks to the Discontinuous Transmission (DTX) and reception (DRX) features. The gain of CPC depends to a large extent on the type of traffic that is being transferred: for example, it can be quite effective for bursty, interactive applications, such as web browsing or video streaming, but it will not help much in the case of FTP downloads. Figure 13.20 shows the test results from a lab experiment using YouTube video streaming for two different devices.
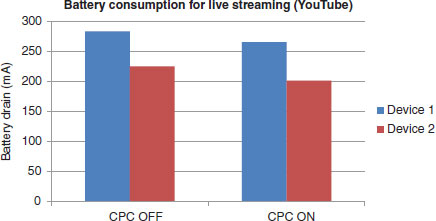
Figure 13.20 Battery savings with CPC during YouTube playback
As the results illustrate, CPC in this case is providing overall battery savings in the order of 6–10%. The apparent low gains from the feature are due to the higher drain caused by the screen, as previously discussed in Figure 13.18.
Finally, it should be noted that the most optimized devices aren't always the best in terms of battery life as perceived by the customer. During our analysis it was surprising to see less optimized devices that were equipped with high capacity batteries, which in the end resulted in a better battery life in the eyes of the consumer.
13.5.3 Coverage Limits for Different Services
The availability of proper signal coverage is a key factor to offer a good service experience: if the signal is too weak, or there's too much interference, the radio layer will drop packets frequently and the connection may be intermittently dropped, which results in delays in the upper layers. In extreme cases, the application data transfer will not be possible and the device will show an error or the application will simply not respond to user actions.
As discussed earlier, not all data services are equal, and some are more resilient than others with regards to radio coverage. In Figure 13.21 we illustrate the results of a lab test in which we executed various smartphone applications at different combinations of signal strength (RSCP) and interference (Ec/No). The objective of the tests was to find the minimum RSCP and Ec/No at which each service could operate. The app behavior at this point depends on the type of service: for example, for web browsing it would mean that the browser provides an error or doesn't show the page at all; for YouTube, the point where extreme rebuffering occurs, and for Skype, the point at which the call is dropped.
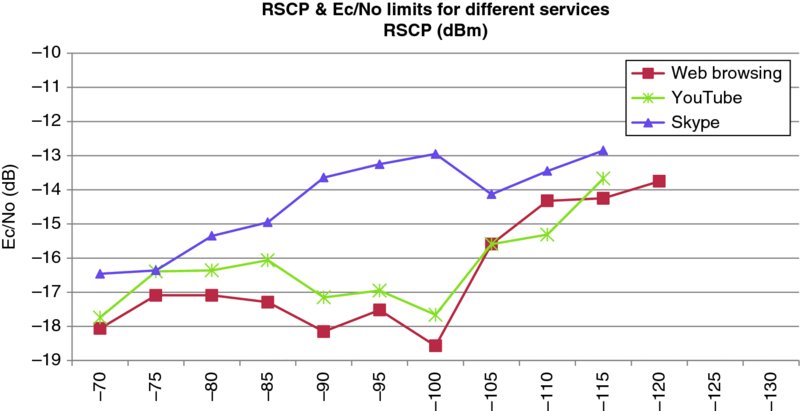
Figure 13.21 Limit RF conditions for different types of services
As the test results show, data services can generally operate at very weak levels of signal strength, as long as the interference levels are low; on RSCP levels under −100 dBm, the services require a more stringent Ec/No. It should be noted that these were lab tests, and the absolute values can only be taken as indicative.
In general, web browsing is the most resilient data service. It can operate at the lowest signal levels, and can also endure higher levels of interference: it can operate at about 1 dB lower than YouTube, and several dBs below the Skype levels in certain conditions. The behavior of Skype is quite interesting, since it requires a cleaner signal than the other services; this difference is clearer in areas with mid signal strength, in which other services can operate with 3–4 dB higher interference levels than Skype can endure.
This information is particularly interesting to operators when planning the network, or during troubleshooting efforts. Typically, operators can get a relatively good estimate of the RF conditions of specific locations; however, it is much harder to understand what those mean in terms of customer experience. By using simple methods like the one described here the operator can get a feeling for what services are available at which locations.
13.5.4 Effect of TCP Performance
The TCP protocol is the most popular transport protocol used in the IP stack. This protocol ensures lossless, in-order delivery of data between two endpoints, and incorporates error recovery mechanisms, as well as congestion avoidance, to limit the packet loss in periods of heavy load conditions in the link. The TCP protocol was not originally designed for wireless environments, characterized by long and variable packet delays, and if not properly optimized can limit the potential offered by the HSPA+ technology.
To ensure correct packet delivery, TCP requires sending packet acknowledgements from the receiver, which also indicates to the sender the available buffer size in the receiver, called the “receive window.” Similarly, the sender keeps a “transmission window” also known as “congestion window” on its side until the packets have been properly acknowledged, in case they need to be retransmitted. In networks with high latency, a small transmission window can result in a slower speed than the actual link could provide, since packets can take a long time to be acknowledged by the receiver, thus resulting in the queuing of packets in the transmitter. To help avoid this situation, the TCP parameters (in particular, the TCP window size of the receiver) should be adjusted according to the “bandwidth-delay product,” which indicates the effective amount of bytes that the network is able to transmit at any given time. Some OS/TCP implementations, such as Windows Vista and Windows 8, have a built-in TCP windows autotuning function which adjusts the TCP window size based on the end-to-end TCP flow and RTT. This approach has positive aspects, but it can also have side effects: such algorithms do not take the physical medium into account and could conflict with some radio resource scheduling algorithms which try to optimize the data throughput.
Another important effect introduced by TCP is the adaptation of the transmission window to help mitigate congestion situations. To achieve this, the protocol includes two different mechanisms: a probing mechanism called “TCP slow start” by which the transmission window is increased as the initial set of packets get proper acknowledgment, and a congestion avoidance mechanism that adjusts the transmission window when packet losses are detected. The TCP slow start is used at the beginning of the transmission and after a packet has timed out. Figure 13.22 shows how the mechanism works during the FTP download of a file in a HSPA+ network.
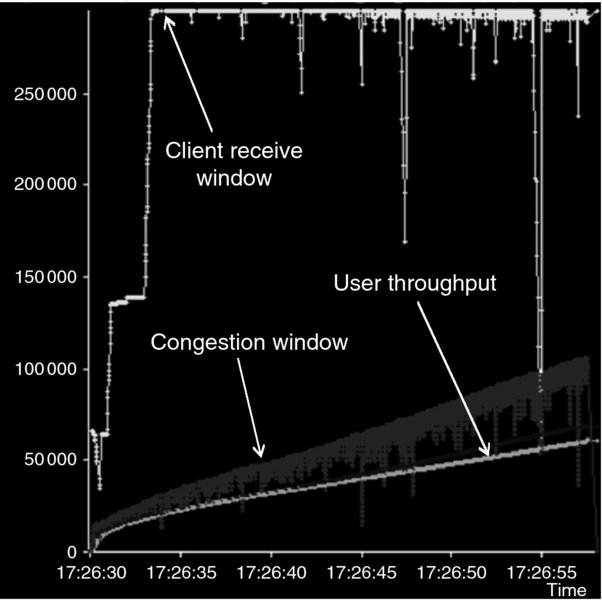
Figure 13.22 Illustration of TCP slow start during FTP downlink transfer
Considering the latency in typical HSPA+ networks, TCP slow start will limit the actual bitrates, especially in the case of transmission of small objects in which there is not sufficient time to increase the window size before the file is transferred.
The TCP congestion avoidance mechanism, which is triggered when packet losses or timeouts are detected, can also introduce unwanted effects in wireless. Packet losses, and especially packet timeouts, are frequent in wireless environments, in which small fluctuations of signal or load can cause significant delay variations on the link. When these occur, the TCP protocol responds by reducing the bitrate, however the transient effect may already be gone and the connection speed will suffer unnecessarily.
In the last few years there has been a significant effort to optimize the performance of TCP over wireless, and multiple TCP versions have been developed: TCP Vegas, New Reno, Hybla, BIC, Cubic, and Westwood, among others. In addition to these protocol implementations, many operators have installed wireless proxies that implement proprietary TCP versions specially designed for wireless. Given that operators do not have control over the TCP stack in the Internet servers, the use of wireless proxy is a practical approach to mitigate the challenges from TCP. Furthermore, these proxies have shown better performance in practice than the aforementioned protocols, as the next analysis illustrates.
Figure 13.23 summarizes a study performed in a live HSPA+ network with dual carrier. The test consisted in a single download of a HTTP file under good and poor radio conditions, using various versions of the TCP protocol: BIC, Cubic, Hybla, and FIT. A wireless proxy, implementing a proprietary version of TCP, was also tested as one additional test scenario.
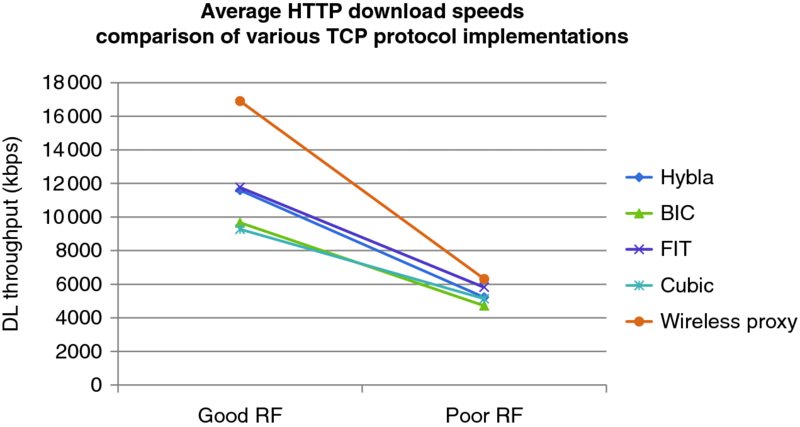
Figure 13.23 Performance comparison of different TCP protocols in a live HSPA+ network
As the results show, the wireless proxy provides the best results in both test scenarios, with a wide difference in good RF conditions and only marginal improvement in poor RF. Additional tests were conducted in a congested area, in which the proxy also offered the best performance, only with a marginal gain. Another interesting TCP protocol is TCP Westwood, which showed good potential in other tests conducted, beating the proxy performance in poor radio conditions.
In addition to the TCP version, an important parameter to adjust is the maximum TCP window size in the terminal device. As discussed before, this window can effectively limit the amount of data that is transmitted to the device, wasting the potential of networks with higher speeds. Figure 13.24 shows the result of a test campaign in a city equipped with dual-carrier HSPA+, in which three different window sizes were tested. The tests were performed in 35 different locations to ensure that they covered many possible combinations of load and signal strength.
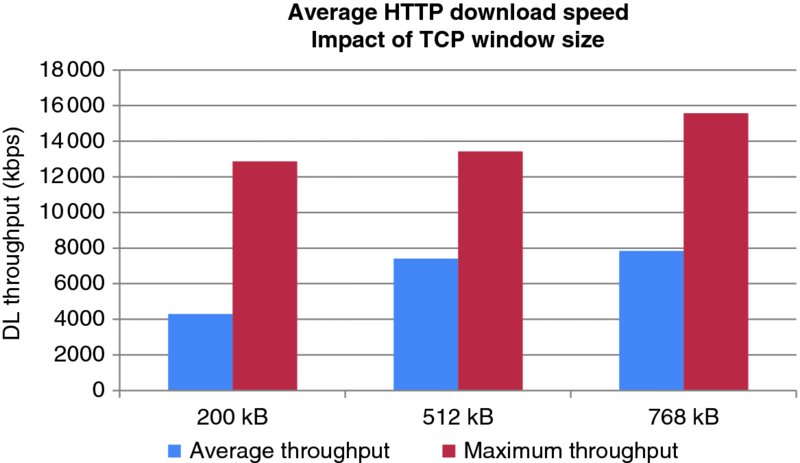
Figure 13.24 Impact of TCP window size on HTTP downloads
In this particular example, the results suggest that the higher window sizes work better for dual-carrier devices. Beyond a certain point (512 kB) the performance differences were not significant, especially in terms of average throughput.
13.5.5 Web Browsing Performance
Figure 13.2b in Section 13.2 illustrated how HTTP traffic accounts for the majority of the data transactions in the network, either directly through the browser or through a specialized app. It is therefore very important to understand the behavior of these services and their performance in a wireless network.
Web services are offered through the Hypertext Transfer Protocol (HTTP) that is typically built on top of the TCP/IP stack. The HTTP protocol facilitates the download of web content, which may include text, images, audio, and video. The web content is uniquely identified and placed in the network using a Uniform Resource Locator (URL).
The HTTP transaction typically involves the download of a main object that contains links to other resources, and the subsequent download of each of those resources. The transfer of each resource is initiated with a “HTTP GET” and finalized with a “HTTP 200 OK” message. Each of the objects on the main page download following the same procedure. Figure 13.25 shows a simplified diagram with the relevant transactions in a smartphone, assuming that in these devices the PDP context is always on:
- First, the UE needs to transition out of the idle or PCH state and initiate a DNS query to resolve the IP address corresponding to the required web page address (URL).
- Once the destination IP address is known, the UE will establish a TCP connection, which is performed using a three-way handshake: the UE sends a “connection request” packet (SYN), the server responds with a “connection response” (SYN-ACK) and the UE confirms that the server's response has been received (ACK).
- After the TCP connection is established, the UE requests a web page object (HTTP GET) and the network sends multiple TCP packets with the relevant information. When the full web page is sent, the server sends a “web page complete” message (HTTP 200 OK).
- The multiple objects indexed in the original web page will also be downloaded following the same HTTP GET/200 OK scheme. The download of these objects can be sequential (in older versions of HTTP), or in parallel if the browser and server supports pipelining (HTTP 1.1).
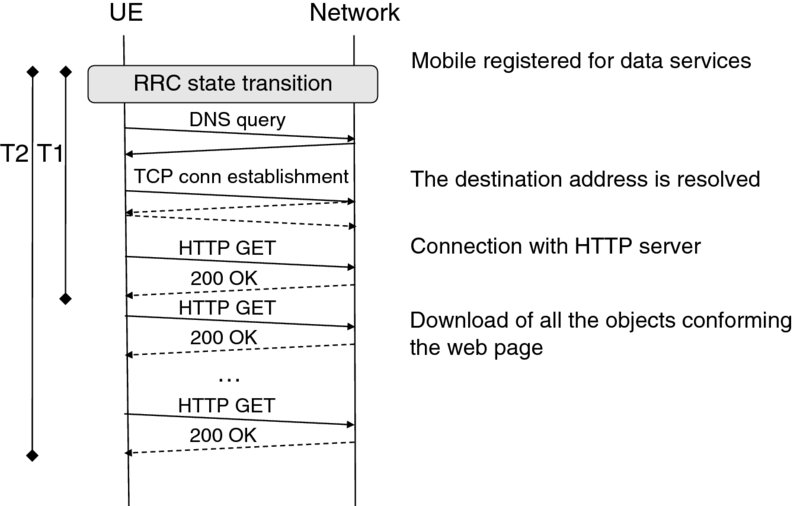
Figure 13.25 Diagram of a typical web content download in a smartphone
Figure 13.25 highlights two instances that are relevant to the consumer, a first time (T1), when the first object is downloaded – typically corresponding to the browser indicating some action in the screen – and T2, when the web page is completely loaded, typically corresponding to the time the browser has finished rendering the full page on the screen.
In order to provide a satisfying user experience, the different actions that take place should happen relatively quickly. The study in [2] provides some high-level guidelines that could be applied to web browsing response times:
- Provide some feedback to the user within 2 s. By this time, the browser should have indicated that an action is occurring
- The customer will perceive a good service experience if the task takes less than 5 s. If it takes longer than that, the browser should provide some feedback to let the user know that the system is still at work
- Beyond 10 s, even when there's feedback, users' patience wears thin and the system is perceived as slow.
Considering these guidelines, it is very important to ensure that the network and device are well tuned to provide a responsive web browsing experience. The main challenges to achieve this in HSPA+ are both the connection latency, which is the time to transition from IDLE/PCH to DCH, and the connected latency, or the packet round-trip delay once in DCH state.
The connected latency affects the speed at which packets are acknowledged in the network: the lower the latency, the faster the TCP ACK process, which results in an overall faster download time. Interestingly, in many high speed wireless networks the packet latency can become the bottleneck for interactive services such as web browsing, rather than the actual link speed.
The connection latency plays a major role in the perceived web experience. When the phone is in idle or PCH state, the system needs to spend some time to transition into the high speed mode, which is only possible in the DCH state unless the E-FACH/RACH feature is active. As web browsing transactions are initiated by UE, the very first packet is sent in the uplink direction. When the UE requests radio resources for uplink transmission, it can set a “traffic volume indication,” which is a trigger used for direct transition from PCH to DCH. Since the web browsing session starts with either a DNS query or TCP SYN packet, both of which are small packets, the traffic volume indication is not set. Therefore, transition normally happens in two steps via FACH, which takes a longer time. Chapter 12 provides some measurements of the various transition times, and Figure 13.26 shows the impact on web browsing times on a few example sites.
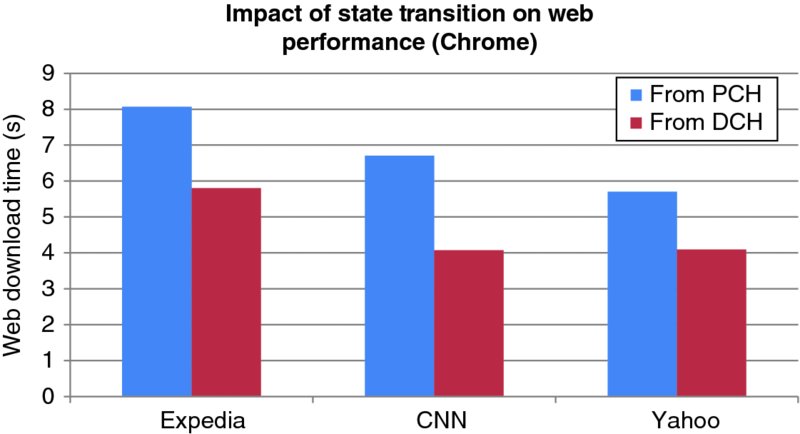
Figure 13.26 Impact of RRC state transition of web performance. Light gray: session starting in PCH; Dark gray: session starting in DCH
As Figure 13.26 shows, the additional delay caused by RRC state transitions can be up to 2 s, often representing a significant amount of the overall web download time. This impact can be minimized using different techniques:
- Extending DCH hold timers, however this has negative impacts on battery life and potentially degradation of network KPIs, such as baseband resource consumption and access failures. The use of CPC should help counter these negative impacts.
- Extending FACH hold timers and activating the E-FACH/E-RACH feature if available.
RNC can furthermore use traffic profiling techniques and predict browsing transactions based on recent user activity, and use direct transition from PCH to DCH even if the UE does not set the traffic volume indicator.
Other important factors affecting the web experience are the performance of the device, the operating system (including the default browser), and, to a lesser extent, the terminal category. Figure 13.27 shows a web download comparison for various popular web sites across multiple mobile operating systems: Android 4, iOS 5, and Windows Phone 8. Note that, at the time of the tests, the iPhone could not be tested with dual carrier in the trial network.
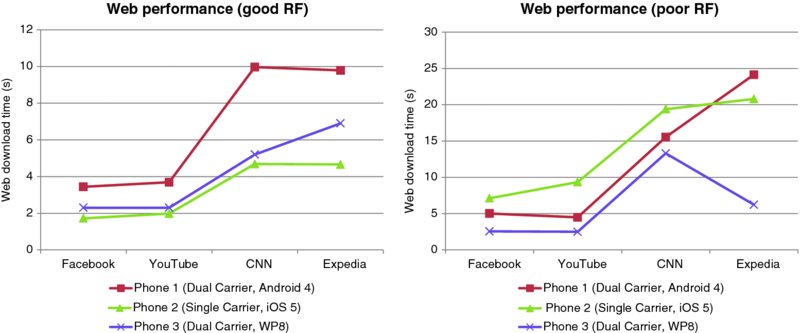
Figure 13.27 Web performance comparison across devices in good and poor RF conditions
The web download results show how the operating system has a significant influence on performance, often beyond the impact of the device category. In this example, the iOS device tested didn't support dual carrier, however it offered a better experience than the dual-carrier devices while in good radio conditions. The effect of dual carrier can be noticed in the poorer RF conditions, where throughput becomes a limiting factor. The Windows Phone 8 device is the one offering a better performance when considering both scenarios.
There are various reasons why Android presented a slower response in these tests, probably the most relevant is the fact that the amount of data downloaded with Android was larger than with other OS since different contents were served for different browsers. Also, the default browser included in Android phones (WebKit) is not well optimized for JavaScript, as Figure 13.28 (left) shows. On the other hand, Android OS offers an alternative browser, Chrome, which presents a significantly improved performance, as the same figure on the right illustrates.
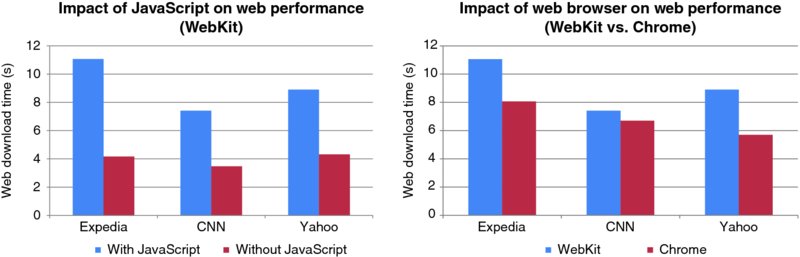
Figure 13.28 Analysis of web performance for Android devices
In summary, analyzing and optimizing the web experience is foundational to provide an optimum service experience on smartphones, since many of the apps are based on web content. Achieving the best web browsing experience is not just a matter of optimizing the network, or selecting the best modem for the device; there are other factors like the OS and the browser that play a very important role and also need to be carefully analyzed and optimized.
13.5.6 Video Streaming
Streaming services – in particular video streaming – are perhaps the services that were truly enabled with high-speed radio technologies such as HSPA+. These services require a significant bandwidth that older technologies could not offer, at least not consistently across the network coverage area. Furthermore, as discussed in Section 13.2, video streaming services today represent the main source in terms of data volume in networks dominated by smartphone traffic, with increasing relevance in the coming years – as forecasted by Cisco in their Visual Networking Index analysis [3]. As such, this service represents one of the most relevant and, at the same time, challenging traffic type to be served by the HSPA+ network.
In addition to the high bandwidth demands, streaming services also present significant challenges to the battery life of the device. While playing streaming video, the device will make use of two of the main sources of battery drain in a smartphone, during extended periods of time: the screen and the radio modem.
Video streaming services consist of the constant transmission of video frames over a period of time. The quality of the video source is determined by the frame rate and the resolution of the video frames: in general, the higher the frame rate, and the higher the resolution, the better the quality. There are typically two types of video frames:
- p frames, with a larger frame size, contain the full information required to decode the video image.
- i frames, of a smaller size, contain differential information in reference to the previous p frame.
During a video stream, i frames are typically sent with a higher frequency than p frames; this results in a variable bitrate profile, with instantaneous peaks – corresponding to the transmission of p frames – followed by a lower speed transfer of the subsequent i frames.
To allow time to decode the frames, and to account for possible fluctuations on the air interface, the receiver client implements a decoding buffer that can introduce several seconds of playback delay. This ensures a smooth video playback compensating for differences in delay arrival between packets or temporary packet loss.
13.5.6.1 Streaming Protocols
The media content can be transferred over TCP or UDP. Transport protocols built on top of UDP, such as RTP, are more suitable for the content of real-time data since they involve less overhead and lower latency. Since these protocols don't provide error protection or sequential delivery, any degradation in the radio layer will be reflected in the video quality, and will result in “blockiness” or even periods of video blackout.
On the other hand, video services that use the TCP protocol will ensure the correct and in-order delivery of all data frames; however, problems at the radio layer will trigger TCP retransmissions or timeouts, which can result in data stalling. With TCP, a temporary data loss will normally be masked to the user thanks to the receiver buffer; however, in areas with poor radio conditions or high load it can result in a pause of video playback or “rebuffering” events.
As will be analyzed in detail in this section, the actual video user experience depends to a large extent on the streaming protocol used and the actual data transfer strategy from the video service provider. The analysis will be based on two of the most popular video streaming services in the USA, YouTube and Netflix, and will cover the most relevant areas in terms of user experience: elapsed time to initiate the video playback, offered video quality, and battery consumption.
Two of the most popular streaming schemes seen on wireless networks today are progressive downloads and HTTP adaptive streams. The most well-known adaptive streaming solutions are Apple's HTTP Live Streaming (HLS), MPEG's Dynamic Adaptive Streaming over HTTP (DASH), and Microsoft's Smooth Streaming (MSS). Progressive streams account for the majority of video volume today, due to the popularity of YouTube; however, this is quickly shifting as even YouTube is changing their content to HTTP adaptive streaming, in particular HLS.
Progressive video streams are generally encoded into different formats (such as 240P, 360P, 480P, 720P, 1080P), but only one quality and bitrate is downloaded at a time. This does not automatically change or adjust based on congestion or the user's available bandwidth.
HTTP Adaptive Streaming (HLS, Dash, MSS) video streams are encoded in many different qualities and are delivered in chunks of 2 to 10 s of video. The video quality is adjusted both up and down as conditions or available bandwidth fluctuates.
A common feature of all streaming services is an initial buffering of multimedia content at the client, which tries to ensure smooth playback in the presence of bandwidth fluctuation and jitter. This buffering is visible to the user as start-up delay and referred to as “fast start.” The name comes from the fact that this initially buffered data is typically downloaded using all the available bandwidth, while the rest of the video is downloaded using one of these techniques according to the study in [4]:
- encoding rate streaming;
- throttling;
- buffer adaptive streaming;
- rate adaptive streaming;
- fast caching.
Encoding rate streaming means that after the fast start the client is able to receive data at the encoding rate. For example, YouTube uses the encoding rate technique for HD video in the case of Flash player in Android.
In the case of throttling, the server limits the rate. Throttling can be used, for example, with Flash players on Android or the YouTube app in iOS. Different throttling factors are used depending on the client.
In buffer adaptive streaming, the client stops downloading when the receive buffer is full and continues when the buffer drains to a certain threshold. The YouTube app and HTML5 player in Android use the buffer adaptive technique.
In rate adaptive streaming, the client can switch dynamically between different video qualities depending on available throughput. HTTP Live Streaming (HLS) is one such technology used by, for example, Netflix.
Fast caching downloads as fast as possible even the whole video. This is used, for example, in the YouTube client in the Windows Phone.
13.5.6.2 Video Start Time
Twenty percent of mobile users will abandon a video if it does not start within 10 s [5]. The faster the network, the higher the abandonment rate, so in order to maintain customer satisfaction, it is important that video start time decreases as mobile network speeds increase.
Video Start Time (VST) is an important KPI, but is difficult (costly) to measure from a carrier perspective due to the complexity of the transaction, and it has to be tailored to the specific service that one wants to be monitored. In this section we will discuss two of the most popular video services: YouTube and Netflix.
A YouTube progressive video stream has between four and eight transactions before the video starts. A delay in any of these transactions can have a significant impact on video start time so it is important to include all the transactions in the video start time metric:
- DNS query for redirector.c.youtube.com.
- HTTP request for video from redirector and HTTP 302 redirect to nearest YouTube cache.
- DNS query for redirected address.
- HTTP request for video from redirected address and either starts downloading the video or receives another HTTP 302 redirect.
- Steps 3 and 4 can be repeated multiple times depending on the popularity of the video and the location of the YouTube caches.
At the moment of writing this book, the Android YouTube player required at least 5 s of video in buffer before the video will start playing. While this is the minimum required to start the video, the client can store up to 30 s of video buffered by the time the video starts playing. This is due to how YouTube bursts 1 MB (240P) before throttling the connection to 1.25x the video encoded bitrate.
If, however, the initial burst of video is throttled or is slowly downloaded, the client will start the video as soon as it has 5 s of video in buffer. This situation will often trigger video buffering events as the client does not have enough video in buffer to handle the variations in conditions and video bitrate. If buffering occurs, the video start buffer increases to 8 s for the remainder of the video; however, this value is reset when the next video is started.
Figure 13.29 illustrates the YouTube video start time measured with different devices under good and poor radio conditions. As can be observed, the main factors affecting the YouTube performance are the operating system and the device type (single vs. dual carrier).
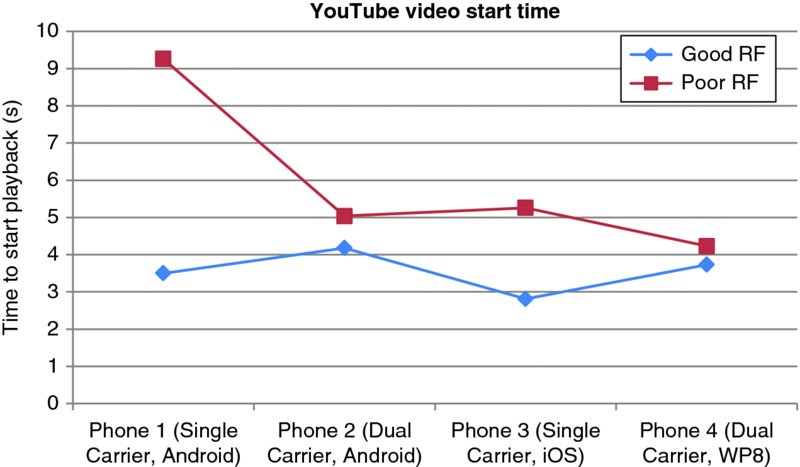
Figure 13.29 YouTube video start time for various devices in good and poor radio conditions
Netflix uses an adaptive stream: it adjusts the quality automatically based on measurements taken by the client while downloading chunks of video data. The delivery mechanism for Netflix varies based on the operating system of the smartphone; this example illustrates the case of an Android client:
- DNS query for Netflix Content Distribution Network (CDN).
- HTTPS session where client sends capabilities.
- HTTPS session where server sends video bitrates and qualities based on #2.
- DNS query for Netflix CDN.
- Multiple HTTP sessions for isma and ismv files – isma are audio files and ismv are video files.
- HTTP session for index file (.bif), which contains image previews used for fast forward and rewind.
The Android Netflix player requires at least 120 s of video in the buffer for the video to start.
13.5.6.3 Impact of Network Proxy on Video Start Time
Network proxies are often introduced to manage and improve data user experience; however, they can have a degrading impact on video performance. Since video services can vary greatly across the same delivery technology, and proxies often apply the same policy per technology, these policies can negatively impact certain users, devices, and sometimes whole services or technologies. Testing for all scenarios to prevent this is not practical with such a broad range of variables so issues often go undetected for extended periods of time.
Two popular ways to manage video from the carrier side are just in time delivery (JIT) and transcoding. These methods can be used together or separately and both aim to reduce overall video volume, but often have unintended tradeoffs.
Just in Time (JIT) delivery throttles the rate at which a video is downloaded to the client so that just enough video is held in the client's buffer to theoretically prevent buffering. Just in Time delivery's main goal is to manage video “wastage,” or video downloaded and not consumed, but has tradeoffs such as higher battery consumption, more rebuffering, longer video start time, and less efficient delivery leading to spectral inefficiencies.
An extreme example of this is shown in Figure 13.30. In this example, video start time was delayed up to 30 s for longer videos as the proxy was applying buffer tuning before the video metadata was fully transferred. This caused over 50% of the impacted videos to be abandoned before the videos were able to start. It also caused buffering every few seconds once the video started as the buffer tuned rate did not allow for any variation in video bitrate. This is an extreme example but highlights the challenges faced when trying to apply a blanket policy across technologies.
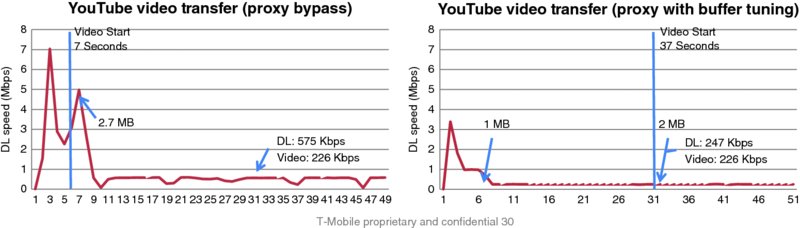
Figure 13.30 User experience degradation with proxy buffer tuning on long videos
As revealed by the study in [5], JIT does not play an important role in high-speed networks, therefore its gains may be questionable in modern HSPA+ networks.
Transcoding reduces the video bitrate while attempting to keep a similar perceived quality. There are various techniques to accomplish this, including dropping frames, re-encoding the video into multiple formats, and so on. Transcoding requires significant hardware to process the videos and store the content, but can help maintain a decent level of video quality under varying network conditions.
Video services have recognized the need for managing wastage and have implemented client and server buffer management schemes for progressive streams. As mentioned before, many services are also transitioning to an adaptive streaming format, which will capture the benefits of current transcoding techniques. These new schemes of managing wastage, the move to adaptive streams, and the ever increasing speeds of networks have made traditional proxy techniques less relevant for video delivery on HSPA+ networks.
13.5.6.4 Video Quality (MOS)
In addition to video start time, the quality offered during the video playback is a key element to characterize the video service. Video quality is typically measured in terms of video Mean Opinion Score (MOS), and considers items such as frame rate, artifacts due to packet losses, and video interruptions.
One of the challenges associated with video MOS measurements is that, as is the case with voice MOS measurements, the measurement setup requires the transmission of a pre-defined pattern file that will be evaluated by the MOS tool upon reception. This means that video MOS measurements are not possible with on-the-fly content, and the measurements are restricted to spot tests performed by the operator. There are tools that try to estimate video MOS based on real-time measurements from the network, however we won't discuss those in this chapter.
Figure 13.31 illustrates the lab setup configured by T-Mobile's product realization team to perform video quality measurements.

Figure 13.31 Lab setup to measure video MOS
This setup can be used both for video streaming and video calling services. The received video is captured with a camera from the screen of the receiving device, and processed at the video controller device. The test setup provides a controlled environment in which to test various aspects of the video service. Figure 13.32 shows the impact on video MOS from encoding the content with a higher frame rate (left); the chart on the right shows that hardware codecs are able to deliver better performance than software codecs for video calling services.
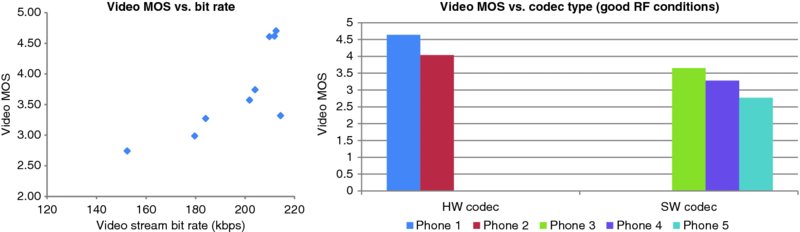
Figure 13.32 Effect of frame rate and codec type on video MOS
Another important factor affecting video quality is the transfer rate, which is limited by the radio conditions. Figure 13.33 illustrates the impact on MOS at various test conditions; the chart shows a dramatic video quality degradation beyond a certain point.
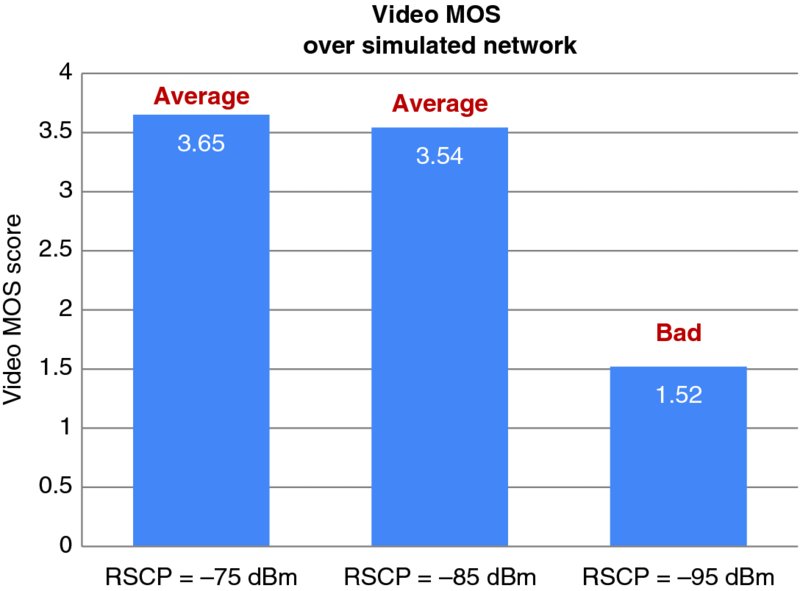
Figure 13.33 Video calling MOS under various test conditions
13.5.6.5 Streaming Resource Consumption
Until recently, video delivery on mobile networks was treated the same as wired networks – often keeping the radio in an active state for the whole duration of the video consumption. Considering that video is about 50% of network traffic (and growing), developing efficient video applications and delivery is key for both the carrier and user experience: video delivery that is not optimized for mobile networks will increase battery consumption and decrease spectrum efficiencies.
Each video service and technology has their own unique way of delivering video. Progressive streams are delivered in three basic ways – each with their own benefits and tradeoffs:
- Download the whole video as quickly as possible
- Pros: Battery, spectrum, signaling
- Cons: High potential wastage.
- Download the video in chunks every few minutes
- Pros: Battery, spectrum
- Cons: Small potential wastage, signaling.
- Download the video at slightly above the encoded bit rate.
- Pros: Wastage, signaling
- Cons: Battery, spectrum.
Adaptive streaming (e.g., HLS or MSS) downloads each chunk as fast as possible, that is, servers do not throttle the download rate. This is the case, for example, with Netflix (HLS for iOS and MSS for Windows Phone). This results in efficient battery and spectrum usage, while eliminating wastage and ensuring the best video quality given the conditions. Adaptive streams may or may not save on signaling – depending on the chunk delivery pattern and the carrier's T1 and T2 timers. For example, if the video is delivered every 10 s and the T1 timer is 5 s and T2 timer is 5 s, it will create additional signaling for every chunk of data delivered.
Carriers and video service providers often focus on one item while ignoring the others. This leads to non-efficient video delivery for mobile networks. The key for both is to find the right mix to ensure the proper user experience. A video service provider is less concerned with spectrum efficiencies and signaling, and more concerned with battery usage, wastage, and user experience. Luckily, these are related to spectral efficiencies and signaling on the carrier side so there are benefits for both sides from optimizing video delivery.
An example of the above can be seen in Figure 13.34. The same 104-min long movie of standard quality was downloaded in the three ways listed above. Service 1 downloaded chunks of video every 3 to 5 min and consumed 27% of battery on device A. Service 2 downloaded the video throughout the duration of the consumption, which consumed 52% of battery on Device A. By adopting a delivery mechanism like Service 1, the consumer can do more with their device since their battery lasts longer, and the network is able to serve more customers.
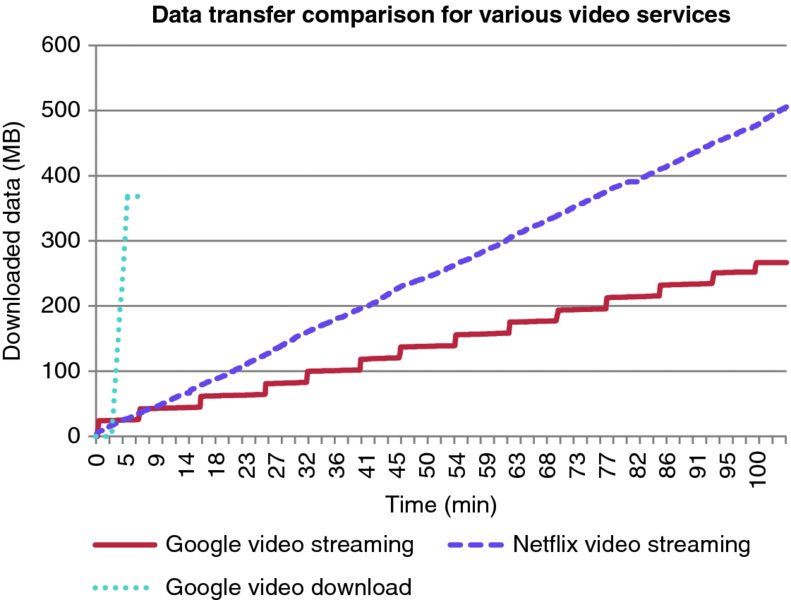
Figure 13.34 Data transfer comparison for different online video services
Table 13.3 provides the detailed battery consumption for the tested video services.
Table 13.3 Battery drain comparison for two popular video services (Service 1: Download in chunks; Service 2: Continuous download)
| Device | Service | Consumption of battery life (%) |
| Device A | Service 2 | 52 |
| Device A | Service 1 | 27 |
| Device B | Service 2 | 80 |
| Device B | Service 1 | 35 |
Adaptive streams may have their video and audio combined into one stream, or they can be delivered in two separate streams. This kind of delivery can have a significant impact on user experience and resource consumption, so there is benefit to both the video service and carrier to working together to optimize delivery.
An example of the benefits to the carrier, consumer, and video service are shown in Figure 13.35. Before optimization, this video service delivered video in chunks of video every 6 to 10 s. It also delivered audio and video in two different streams and these streams were not delivered in sync.
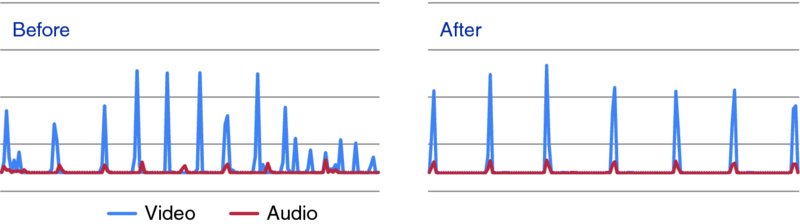
Figure 13.35 Movie transfer profile before (left) and after (right) app was optimized
The video service changed their video delivery by increasing the chunk duration to 24 s and syncing the audio and video streams together. This decreased battery consumption by 23%, and reduced the time spent on DCH by 54%. This approach resulted in an increase in radio signaling, but the impact was minimal compared to the battery and spectrum efficiency improvements.
13.6 Use Case Study: Analysis of Smartphone User Experience in the US
In 2012, the US-based research consultancy, Signals Research Group, conducted a large-scale study for a major North American operator to determine the user experience while using typical smartphone applications across a wide range of network technologies and handset/operating system platforms. The tested networks included CDMA2000 EV-DO Rev A, HSPA+, DC-HSDPA, LTE (5 MHz), and LTE (10 MHz) and the operating systems consisted of Android (version 2.3.5 and 4.0), Apple iOS, and Windows 8. For completeness sake, the testing was done in two different major markets and in various locations/times of day in order to gauge the effects of different RF conditions (e.g., loading, high interference, etc.).
Although the study included basic downlink and uplink throughput tests in order to help characterize the performance of the networks as it is traditionally done, most of the testing focused on the measured performance of actual user applications as implemented on the three operating systems and running on the aforementioned network technologies.
The following sample results help demonstrate the point that the typical user experience with a smartphone application depends on many factors that are not necessarily tied to the achievable data speeds of the network. In all figures, the results are a composite across all testing that occurred in the particular market. Further, all times that involved user interaction, such as typing in text or selecting an image, were excluded.
The first figure (Figure 13.36) shows the average downlink throughput that was measured from the various locations and times when the application testing took place. Figure 13.37 shows the various components that impacted the user experience while uploading an identical picture to Facebook. Several observations are worth mentioning:
- The average DC-HSDPA downlink throughput for all of the tests was on par with the 10 MHz LTE network, just as HSDPA Cat 10 throughput with the iPhone was comparable with the two 5 MHz LTE networks. Network loading and coverage considerations could have been contributing factors, but from the perspective of the user it doesn't matter.
- The total time required to upload an identical Facebook picture was measurably shorter with the legacy HSPA+ networks and one of the EV-DO networks than with the DC-HSDPA and LTE networks. The former used the iPhone 4 and the latter used the Galaxy S III (Android Version 4.0).
- The better user experience with the iPhone 4 also extended to the initial steps during the process, namely the time from when the application was launched until the Facebook page loaded on the mobile device.
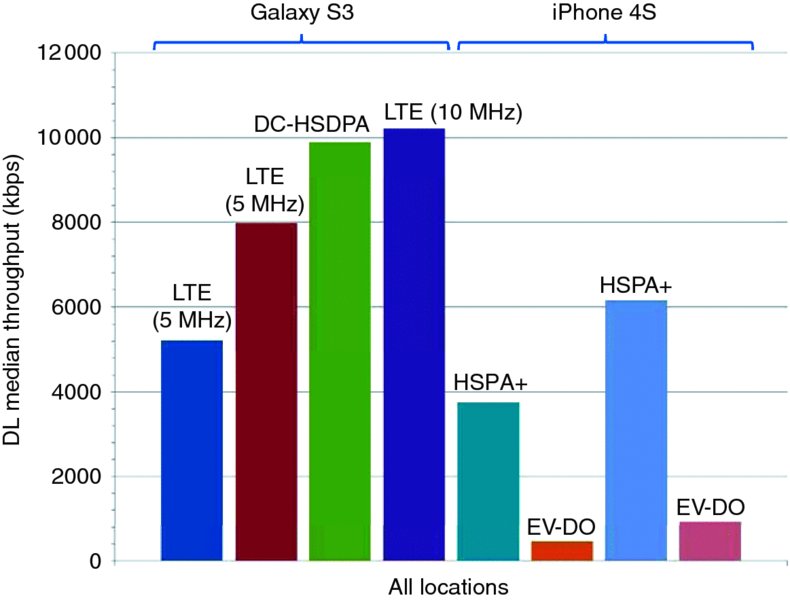
Figure 13.36 Available throughput network technology and operating system. Reproduced with permission of Signals Research Group

Figure 13.37 Facebook user experience – by network technology and operating system. Reproduced with permission of Signals Research Group
The “secret” behind the stronger performance of the iPhone is shown in Figure 13.38. In reality, the performances of the networks or the RF capabilities of the phones do not explain the differences in the overall results. Instead, it is evident that the iPhone compressed the size of the picture before uploading it to the site. From the perspective of the user, the picture quality looks the same when viewed from the screen of the mobile device. However, the user also perceives that the network was “faster,” even though it wasn't. The figure also shows that the iPhone on the second EV-DO network didn't compress the picture and this phenomenon also explains the longer upload time.
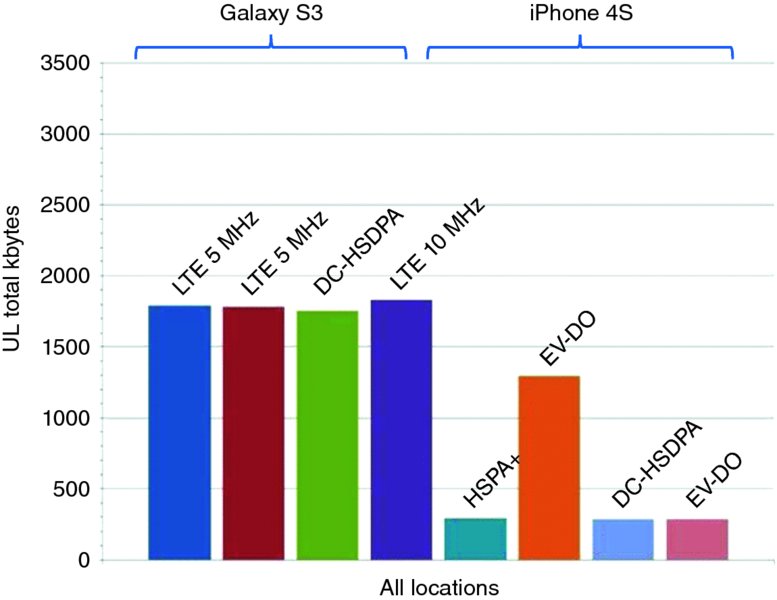
Figure 13.38 Facebook picture upload payload – by network technology and operating system. Reproduced with permission of Signals Research Group
It is also worth pointing out that the actual time required to upload the picture didn't necessarily impact the user experience. This situation exists because the picture is uploaded in the background, meaning that the user could switch to another application without having to wait for the video to upload. Facebook does indicate when the picture or video is uploaded and the screen refreshes to reveal the uploaded content, but the user doesn't have to wait for these events to occur.
The study also found differences in the amount of transferred payload associated with downloading and playing an identical YouTube video and loading an identical web site. In the case of YouTube (Figure 13.39), there seemed to be a strong relationship between the capabilities of the network and the quality of the video. With LTE networks, YouTube delivered a higher quality video format, or at least the file size was larger, than it did with the other 3G networks. In the case of one 5 MHz LTE network, the use of a third-party optimization platform could have reduced the video payload. From the perspective of the individuals who conducted the tests, there wasn't any perceived difference in the quality of the videos.
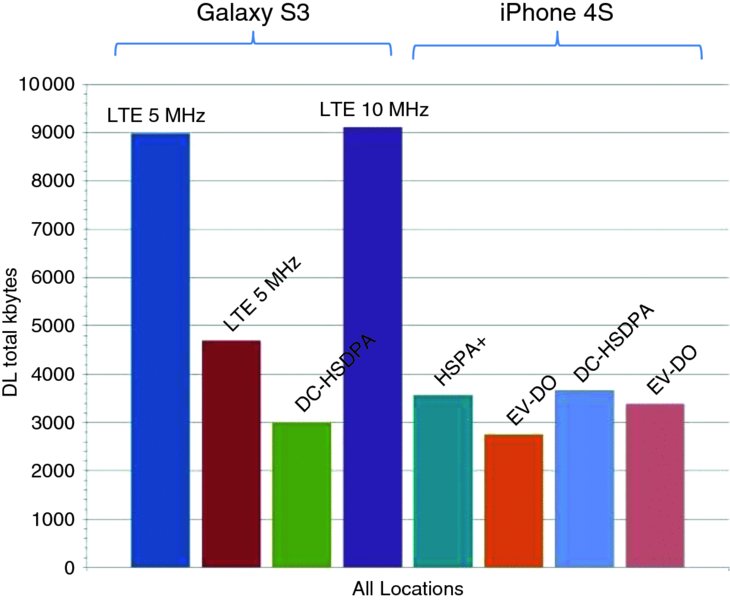
Figure 13.39 YouTube video content vs. network technology – by network technology and operating system. Reproduced with permission of Signals Research Group
In the case of web page content, Apple's decision to not support Flash in its browser actually had at least one positive impact on the user experience. As shown in Figure 13.40, the size of the downloaded web pages was lower with iOS than it was with Android. Although the web pages still generally loaded faster on the Galaxy S III devices that operated on the faster networks, the differences would have been even greater if the iPhone had downloaded the same amount of web content.
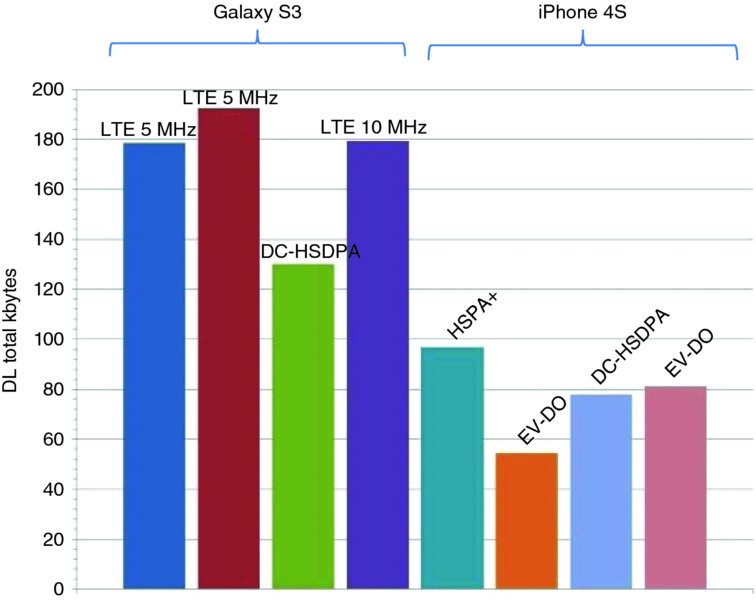
Figure 13.40 Web page data content – by network technology and operating system. Reproduced with permission of Signals Research Group
Generally, the iPhone (iOS) delivered a better user experience than the Android-based smartphones, or the user experience was at least comparable to the Android-based smartphones, despite the latter devices using much faster networks (i.e., legacy 3G versus DC-HSDPA and LTE). This situation, however, didn't pan out with all applications. For example, the study found that the Google voice search application was nearly ten times faster than Apple's Siri when it came to loading the first page of search results – the performance of both applications was still deemed very compelling. Interestingly, the Google search function also used eight times more data traffic, in part due to the incorporation of more graphics and overall content in the results.
13.7 Summary
Below are some recommended steps towards ensuring an optimum user experience in HSPA+ networks:
- Reeducate consumers on what really matters. Although easier said than done, operators frequently place too much emphasis on advertising the data speeds that their networks deliver. Instead, they should market their service offering based on the typical user experience that it delivers. This approach will also prove to be beneficial once newly deployed LTE networks experience network loading and previously marketed data speeds are no longer achieved on a consistent basis.
- Identify non-optimized applications and take corrective action. Operators need to invest time and energy into studying how applications behave in their network. In many cases, simple fixes to the application are all that is required to transform a poor performing application into a fully optimized application.
- Mandate new user experience KPIs to ecosystem device and OS partners. Device and OS partners have a vested interest in delivering a good user experience, but they do not always understand what it takes to deliver a compelling user experience that makes the most efficient use of the available network resources.
- Minimize poor RF coverage areas. Leveraging the benefits of SON is perhaps the best way to identify poor coverage areas. In this case “poor coverage” should equate to a minimum user experience threshold not being achieved and not necessarily to a specific RF parameter, although the two could be correlated.
- Optimize the network parameter settings and the network architecture based on typical user behavior. Moving popular content closer to the edge of the cell is one example. Adjusting network timer settings (e.g., T1, T2, and T3) in order to minimize RRC state transition times without sacrificing battery life is another example.
Notes
References
- Sharma, C. (2013), “US Wireless Data Market Update.Q4 2013 and 2013”.
- Seow, S. (2008) Designing and Engineering Time, Pearson Education, Inc., Boston, MA.
- Cisco (2012), “Cisco Visual Networking Index: Global Mobile Data Traffic Forecast Update, 2012–2017”.
- Hoque, M., Siekkinen, M., Nurminen, J. Aalto, M. and Tarkoma, S. (2013) “Mobile Multimedia Streaming Tecniques: QoE and Energy Consumption Perspective”, arXiv:1311.4317.
- Shunmuga Krishnan, S. and Sitaraman, R. (2012) “Video stream quality impacts viewer behavior: inferring causality using quasi-experimental designs”, Proceedings of the 2012 ACM conference on Internet measurement conference (IMC).