
1
Introduction
Harri Holma
1.1 Introduction
GSM allowed voice to go wireless with more than 4.5 billion subscribers globally. HSPA allowed data to go wireless with 1.5 billion subscribers globally. The number of mobile broadband subscribers is shown in Figure 1.1. At the same time the amount of data consumed by each subscriber has increased rapidly leading to a fast increase in the mobile data traffic: the traffic growth has been 100% per year in many markets. More than 90% of bits in mobile networks are caused by data connections and less than 10% by voice calls. The annual growth of mobile data traffic is expected to be 50–100% in many markets over the next few years. Mobile networks have turned from voice networks into data networks. Mobile operators need to enhance network capabilities to carry more data traffic with better performance. Smartphone users expect higher data rates, more extensive coverage, better voice quality, and longer battery life.
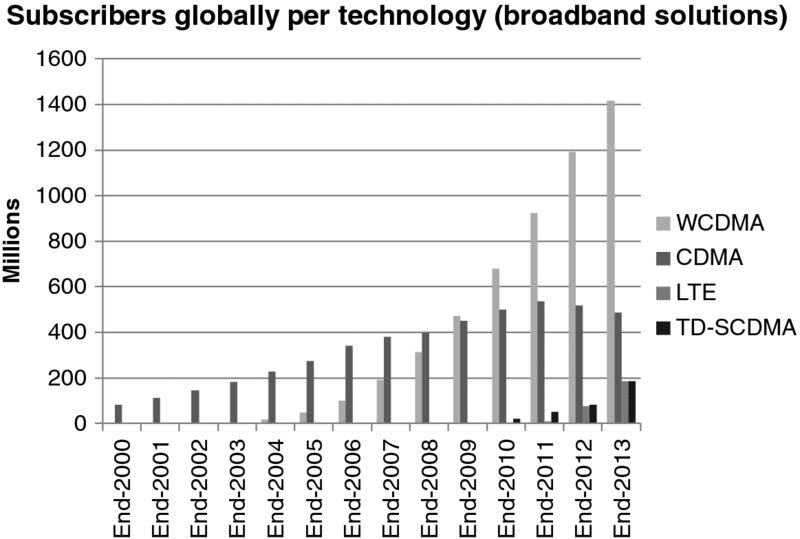
Figure 1.1 Number of subscribers with mobile broadband technologies
Most of the current mobile data traffic is carried by HSPA networks. HSPA+ is expected to be the dominant mobile broadband technology for many years to come due to attractive data rates and high system efficiency combined with low cost devices and simple upgrade on top of WCDMA and HSPA networks. This book presents HSPA evolution solutions to enhance the network performance and capacity. 3GPP specifications, optimizations, field performance, and terminals aspects are considered.
1.2 HSPA Global Deployments
More than 550 operators have deployed the HSPA network in more than 200 countries by 2014. All WCDMA networks have been upgraded to support HSPA and many networks also support HSPA+ with 21 Mbps and 42 Mbps. HSPA technology has become the main mobile broadband solution globally. Long Term Evolution (LTE) will be the mainstream solution in the long term for GSM and HSPA operators and also for CDMA and WiMAX operators. HSPA traffic will continue to grow for many years and HSPA networks will remain in parallel to LTE for a long time. The technology evolution is shown in Figure 1.2.
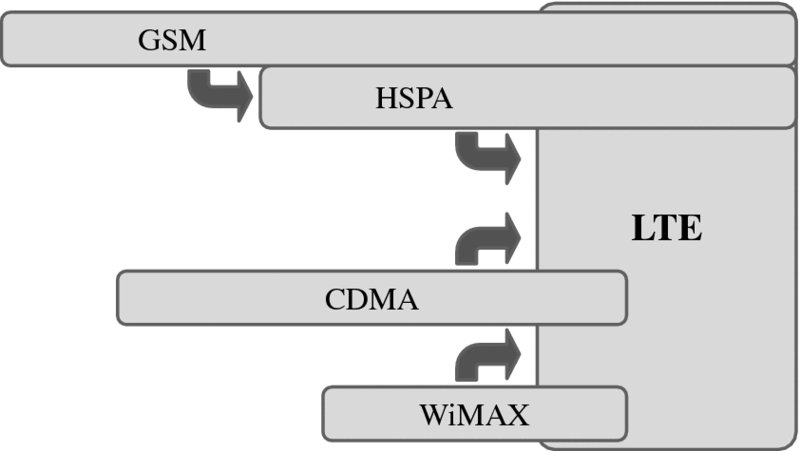
Figure 1.2 Radio technology evolution
HSPA has been deployed on five bands globally, see Figure 1.3. The most widely used frequency band is 2100 MHz 3GPP Band 1 which is used in many countries in Europe, Asia, the Middle East, and Africa. The other high-band options are Band 4 at 2100/1700 MHz and Band 2 at 1900 MHz. In many cases operators have deployed HSPA on two bands: high band for capacity and low band for coverage. The two low-band options are 900 MHz and 850 MHz. The low-band rollouts have turned out to be successful in improving the network coverage, which gives better customer performance and better network quality. Low bands have traditionally been used by GSM. Using the same bands for HSPA is called refarming. GSM and HSPA can co-exist smoothly on the same band.
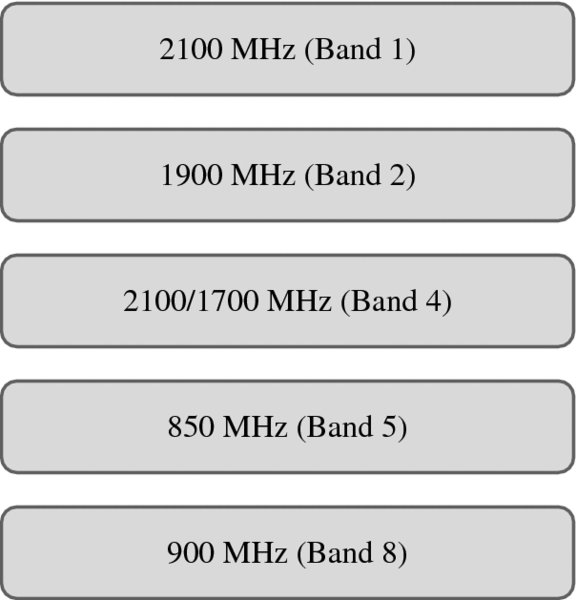
Figure 1.3 HSPA main frequency bands
1.3 Mobile Devices
The very first 3G devices ten years ago suffered from high power consumption, high cost, poor quality, and lack of applications. Battery power consumption during a voice call has dropped from more than 400 mA to below 100 mA in the latest devices, 3G smartphone prices have dropped below 50 EUR, and a huge number of applications can be downloaded to the devices. The attractive price points for 3G smartphones are enabled by the low-cost chip sets available from multiple vendors. The major improvement in power consumption shows the importance of RF and baseband technology evolution. The large HSPA market size brings high volume production and enables low cost devices. The attractive price points are needed to make the devices available to billions of subscribers. HSPA devices are available for many operating systems including Android, iOS, and Windows Phones. Those smartphone platforms offer hundreds of thousands of applications for the users. Not only has the data capability been improved but also the voice quality has been enhanced with the introduction of High Definition (HD) voice based on Adaptive Multirate Wideband (AMR-WB) codec.
Since the number of global HSPA frequency variants is just five, it is possible to make a global HSPA device that can be used in any HSPA network worldwide. That makes the logistics simpler. The LTE frequency options are more complex and, therefore, multiple variants of the same devices are required for the global market.
An example low end 3G device is shown in Figure 1.4: HSPA Release 7 capability with 7.2 Mbps data rate, dual band support, 2.4′′ screen, 90 g weight, and up to 500 hours of standby time. Such devices can act as the first access to the Internet for millions of people.
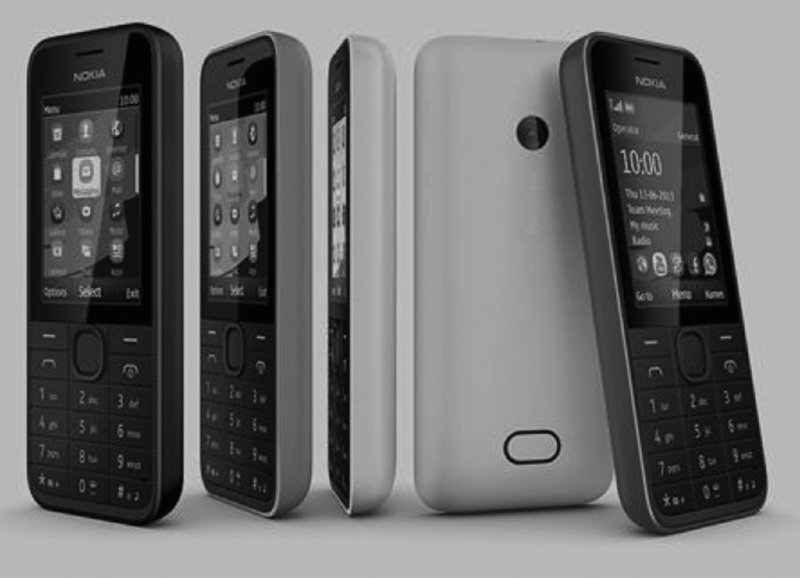
Figure 1.4 Low end HSPA phone – Nokia 208. Source: Nokia. Reproduced by permission of Nokia
1.4 Traffic Growth
The new smartphones and their applications are increasing traffic volumes rapidly in mobile networks. The combined data volume growth of a few major operators over a two-year period is shown in Figure 1.5: the growth rate has been 100% per year. The fast data growth sets challenges for network capacity upgrades. Higher spectral efficiency, more spectrum, and more base stations will be needed. If the traffic were to grow by 100% per year for a 10-year period, the total traffic growth would be 1000 times higher.
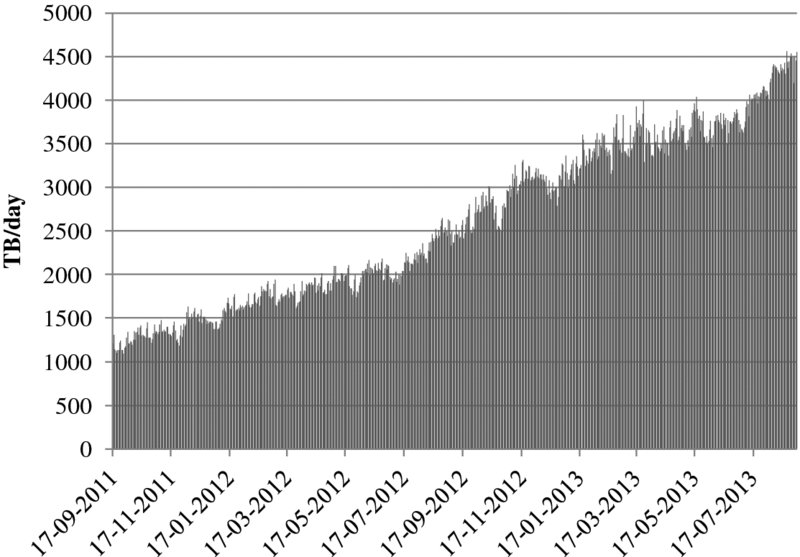
Figure 1.5 HSDPA data volume growth of a few major operators
Not only the data volume but also the signaling volumes are increasing in the network. Smartphone applications typically create relatively small packet sizes that are transmitted frequently, causing continuous channel allocations and releases. Figure 1.6 shows the average data volume for each High Speed Downlink Shared Channel (HS-DSCH) allocation. Each bar represents a different mobile operator. Those operators with a low data volume per allocation (below 100 kB) have high penetration of smartphones while those operators with a large data volume per allocation (above 200 kB) have relatively higher penetration of USB modems and laptop connectivity. If the average data volume per allocation is low, then more allocations and more related signaling will be required. If we assume 50–100 kB per allocation and the data volume 1 GB/sub/month, this corresponds to 330–660 allocations per subscriber per day. Assuming that the busiest hour takes approximately 6% of the daily allocations, we have then on average 20–40 allocations per busy hour. That means the network allocates resources on average every 2 minutes for every smartphone subscriber during the busy hour. Such frequent channel allocations require high signaling capacity. The high signaling also causes more uplink interference because of the control channel overhead. Therefore, solutions for uplink interference control solutions are needed in the smartphone dominated networks.
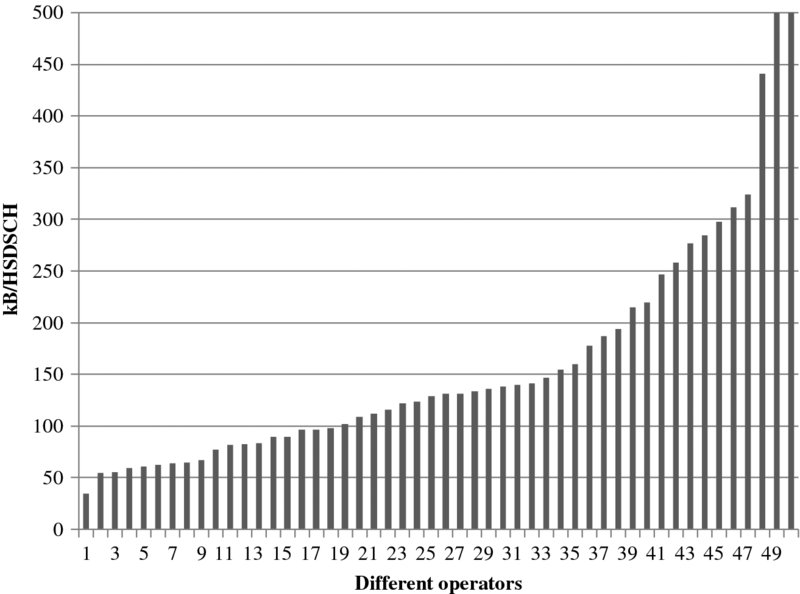
Figure 1.6 Average data volume for HS-DSCH channel allocation
1.5 HSPA Technology Evolution
The first version of HSDPA was defined in 3GPP Release 5 during 2002, the backwards compatibility started in 2004, and the first HSDPA network was launched in 2005. Release 5 allowed a maximum data rate of 14 Mbps in downlink, although the first networks supported only 1.8 and 3.6 Mbps. Since then, data rates have been increasing in 3GPP releases both in downlink and in uplink. The peak rate in Release 11 is up to 336 Mbps in downlink and 35 Mbps in uplink. The evolution is shown in Figure 1.7. The maximum data rates in the commercial networks currently (mid 2014) are 42 Mbps in downlink and 11 Mbps in uplink, which are based on Release 8.
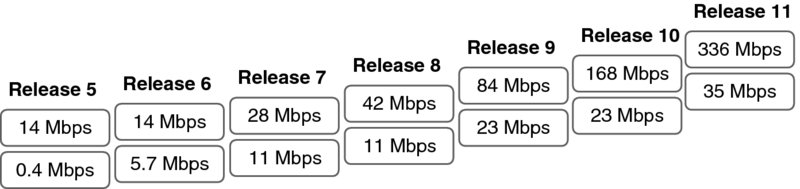
Figure 1.7 Peak data rate evolution in downlink and in uplink
The latency evolution helps end user performance since many interactive applications benefit from the low latency. The typical latency in WCDMA Release 99 networks was 150–200 ms while HSDPA Release 5 enabled sub-80 ms latency, and the combination of HSDPA and HSUPA in Release 6 gave even sub-30 ms latency. Latency here refers to round-trip time, which is the two-way latency through the mobile and the core network. The HSPA latency improvements are shown in Figure 1.8. Latency consists of the transmit delay caused by the air interface frame sizes and by the processing delays in UE and by the delays in the network elements and transport network. The channel allocation delay has also improved considerably from typically 1 second in the first WCDMA networks to below 0.4 seconds in the latest HSPA networks.
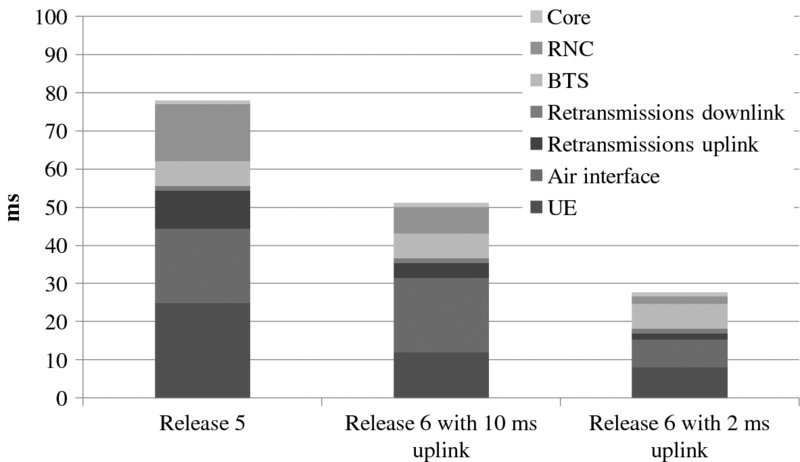
Figure 1.8 Round-trip time evolution
1.6 HSPA Optimization Areas
A number of further optimization steps are required in HSPA to support even more users and higher capacity. The optimization areas include, for example, installation of additional carriers, minimization of signaling load, optimization of terminal power consumption, low band refarming at 850 and 900 MHz, control of uplink interference, and introduction of small cells in heterogeneous networks. Many of these topics do not call for major press releases or advanced terminals features but are quite important in improving end user satisfaction while the traffic is increasing.
The most straightforward solution for adding capacity is to add more carriers to the existing sites. This solution is cost efficient because existing sites, antennas, and backhaul solutions can be reused. The load balancing algorithms can distribute the users equally between the frequencies.
The limiting factor in network capacity can also be the signaling traffic and uplink interference. These issues may be found in smartphone dominated networks where the packet sizes are small and frequent signaling is required to allocate and release channels. The signaling traffic can increase requirements for RNC dimensioning and can also increase uplink interference due to the continuous transmissions of the uplink control channel. Uplink interference management is important, especially in mass arenas like sports stadiums. A number of efficient solutions are available today to minimize uplink interference.
The frequent channel allocations and connection setups also increase the power consumption in the terminal modem section. Those solutions minimizing the transmitted interference in the network tend to also give benefits in terms of power consumption: when the terminal shuts down its transmitter, the power consumption is minimized and the interference is also minimized.
Low-band HSPA refarming improves network coverage and quality. The challenge is to support GSM traffic and HSPA traffic on the same band with good quality. There are attractive solutions available today to carry GSM traffic in fewer spectra and to squeeze down HSPA spectrum requirements.
Busy areas in mobile networks may have such high traffic that it is not possible to provide the required capacity by adding several carriers at the macro site. One optimization step is to split the congested sector into two, which means essentially the introduction of a six-sector solution to the macro site. Another solution is the rollout of small-cell solutions in the form of a micro or pico base station. The small cells can share the frequency with the macro cell in co-channel deployment, which requires solutions to minimize the interference between the different cell layers.
1.7 Summary
HSPA technology has allowed data connections to go wireless all over the world. HSPA subscribers have already exceeded 1 billion and traffic volumes are growing rapidly. This book presents the HSPA technology evolution as defined in 3GPP but also illustrates practical field performance and discusses many of the network optimization and terminal implementation topics.