
Analog gauges are useful for visualizing data with values bound between predefined minimums and maximums, which undergo changes over time. Examples include amount of fuel, current speed, disk space, process and memory usage, and so on.
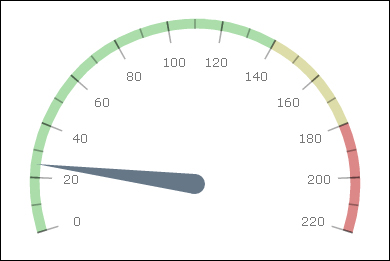
In this recipe, we're going to make a very flexible, data-driven gauge plugin for jQuery. Then we're going to use this plugin to display an analog car speedometer. The following is how the speedometer will look:
The recipe makes extensive use of HTML5's canvas.
Let's write the HTML code for our example, the gauge plugin and the code that ties them together.
- Make a simple HTML file with a canvas for our gauge:
<!DOCTYPE HTML> <html> <head> <title>Gauge example</title> </head> <body> <canvas id="gauge" width="400" height="400"></canvas> <script src="http://ajax.googleapis.com/ajax/libs/jquery/1.8.2/jquery.min.js"></script> <script type="text/javascript" src="example.js"></script> </body> </html> - Then write our gauge plugin code in
example.js:(function($) { - This is a support function that replaces
Array.forEachand works on both single items and arrays. Our gauge will support multiple stripes, needles, and ticks, but it should also be able to work when a single one is provided:function eachOrOne(items, cb) { return (items instanceof Array ? items : [items]).map(cb); } - The following is a generic function that rotates the point
ptaround the centerc(the angle amount isa). Direction is clockwise:function rotate(pt, a, c) { a = - a; return { x: c.x + (pt.x - c.x) * Math.cos(a) - (pt.y-c.y) * Math.sin(a), y: c.y + (pt.x - c.x) * Math.sin(a) + (pt.y-c.y) * Math.cos(a) }; } - The following is our gauge plugin
    $.gauge = function(target, options) {
        var defaults = {
            yoffset: 0.2,
            scale: {
                type: 'linear',
                values: [1, 200],
                angles: [0, Math.PI]
            },
            strip: {
                scale: 0, radius: 0.8, width: 0.05,
                color: "#aaa", from: 0, to: 200
            },
            ticks: {
                scale: 0, radius: 0.77, length: 0.1, width: 1, color: "#555",
                values: {from: 0, to:200, step: 10},
            },
            labels: {
                scale: 0, radius: 0.65,
                font: '12px Verdana', color: "#444",
                values: {from: 0, to:200, step: 20}
            },
            needle: {
                scale: 0, length: 0.8, thickness: 0.1,
                color: "#555", value: 67
            }
        };
By default, our gauge has the following:
- Is offset 20% from the top
- Has a linear scale with a value range 1 to 200, angle range 0 to 180 degrees,
- Has a single strip at 80% or total radius with a width of 5% of total radius colored with gray and going from 0 to 200.
- Has a single
ticksarray going from 0 to 200 withstep10 - Has labels from 0 to 200 with step 20
- Has a single needle set at value 67
- We allow the user to override options and to specify more than one of any of the components mentioned previously:
var options = $.extend(true, {}, defaults, options); for (var key in defaults) if (key != 'yoffset') options[key] = eachOrOne(options[key], function(item) { return $.extend(true, {}, defaults[key], item); }); var $target = $(target); var ctx = $target[0].getContext('2d'), - We construct our
scalefunction and replace our objects specifying ranges of values with actual arrays. Note that instead of arangeobject, you can also specify an actual array:options.scale = eachOrOne(options.scale, function(s) { return $.gauge.scale(s); }); eachOrOne(options.ticks, function(t) { return t.values = $.gauge.range(t.values); }); eachOrOne(options.labels, function(l) { return l.values = $.gauge.range(l.values); }); - The following is the drawing code:
function draw(options) { - We will use the gauge center as a reference point and will clear the canvas:
var w = $target.width(), h = $target.height(), c = {x: w * 0.5, y: h * (0.5 + options.yoffset)}, r = w * 0.5, pi = Math.PI; ctx.clearRect(0, 0, w, h); - Then we'll draw all the strips (one or more) as arcs:
// strips eachOrOne(options.strip, function(s) { var scale = options.scale[s.scale || 0]; ctx.beginPath(); ctx.strokeStyle = s.color; ctx.lineWidth = r * s.width; ctx.arc(c.x, c.y, s.radius * r, scale(s.to), scale(s.from), true); ctx.stroke(); }); - Then draw all the ticks (we use very short, very thick arcs as ticks). Our
scalefunction turns the values inrangeto angles:// ticks eachOrOne(options.ticks, function(s) { var scale = options.scale[s.scale || 0]; ctx.strokeStyle = s.color; ctx.lineWidth = r * s.length; var delta = scale(s.width) - scale(0); s.values.forEach(function(v) { ctx.beginPath(); ctx.arc(c.x, c.y, s.radius * r, scale(v) + delta, scale(v) - delta, true); ctx.stroke(); }); }); - Then we draw the labels. We determine the position by placing it at the right-most vertically-centered position, then rotating it counter-clockwise by the amount scaled with the value:
// labels ctx.textAlign = 'center'; ctx.textBaseline = 'middle'; eachOrOne(options.labels, function(s) { var scale = options.scale[s.scale || 0]; ctx.font = s.font; ctx.fillStyle = s.color; s.values.forEach(function(v) { var pos = rotate({x: c.x + r * s.radius, y:c.y}, 0 - scale(v), c); ctx.beginPath(); ctx.fillText(v, pos.x, pos.y); ctx.fill(); }); }); - Finally, we draw the needles. The needles are made of a circle centered at the central rotation point of the gauge and a triangle extending from there. We rotate all three triangle points the same way we rotate the label centers:
// needle eachOrOne(options.needle, function(s) { var scale = options.scale[s.scale || 0]; var rotrad = 0 - scale(s.value); var p1 = rotate({x: c.x + r * s.length, y: c.y}, rotrad, c), p2 = rotate({x: c.x, y: c.y + r*s.thickness/2}, rotrad, c), p3 = rotate({x: c.x, y: c.y - r*s.thickness/2}, rotrad, c); ctx.fillStyle = s.color; ctx.beginPath(); ctx.arc(c.x, c.y, r * s.thickness / 2, 0, 2*Math.PI); ctx.fill(); ctx.beginPath(); ctx.moveTo(p1.x, p1.y); ctx.lineTo(p2.x, p2.y); ctx.lineTo(p3.x, p3.y); ctx.fill(); }); } draw(options); - After drawing the whole gauge, the
gaugefunction returns a function that can be used to change the gauge needle value(s) and redraw it:return function(val, i) { i = i || 0; options.needle[i].value = val; draw(options); } }; - These are common helper functions. The
rangefunction creates an array of values, whilescalecreates a function that scales values from one range to another. Both support logarithmic scales:$.gauge.range = function(opt) { if (opt instanceof Array) return opt; var arr = [], step = opt.step; var last = opt.from; for (var k = opt.from; k <= opt.to; k+= step) arr.push(opt.log ? Math.pow(opt.log, k) : k); return arr; }; $.gauge.scale = function(opt, f) { if (opt.type == 'linear') opt.type = function(x) { return x; }; else if (opt.type == 'log') opt.type = Math.log; var f = opt.type, v0 = f(opt.values[0]), v1 = f(opt.values[1]); return function(v) { return (f(v) - v0) / (v1 - v0) * (opt.angles[1] - opt.angles[0]) + Math.PI + opt.angles[0]; }; } }(jQuery));The anonymous function is invoked with the jQuery object as a parameter that, in the scope of the function, becomes
$. This is a typical way to construct jQuery plugins with their own private scope, and to make jQuery available as$within that scope regardless of whether$is the same as jQuery in the global namespace. - We will draw our gauge in
example.js. The following is the content:$(function() { var g = $.gauge("#gauge", { scale: { angles: [-0.3, Math.PI+0.3], values: [0, 220] }, strip: [ { from: 0, to: 140, color:"#ada" }, { from: 140, to: 180, color:"#dda" }, { from: 180, to: 220, color:"#d88" } ], ticks: [{ color: "rgba(0,0,0,0.33)", values: { from: 0, to: 220, step:10 }, length:0.05, radius:0.8, width:0.3 }, { color: "rgba(0,0,0,0.33)", values: { from: 0, to: 220, step:20 }, length:0.11, radius: 0.77, width:0.3 }], labels: { color: "#777", values: { from: 0, to: 220, step:20 }, radius: 0.62 }, needle: { color:"#678" } }); g(25); });
We specified a linear scale for the gauge with angles going slightly below the middle, and speed values in the range 0 to 220. We created three strips, the green one in the range 0 to 140 km/h, a yellow one in the range 140 to 180 km/h, and a red one in the range 180 to 220 km/h. We're going to use two sets of strips: one larger every 20 km/h and one smaller on every 10 km/h, both semi-transparent. Finally, we add a needle with a bluish tint.
At the end, we can set our gauge value with the returned function, which we use to set it at 25 km/h.