

6
A Visualization Tool for Mining Large Correlation
Tables: The Association Navigator
Andreas Buja, Abba M. Krieger, and Edward I. George
CONTENTS
6.1 Overview ........................................................................ 73
6.2 Introduction .................................................................... 74
6.3 Graphical Displays ............................................................. 75
6.3.1 Graphical Display of Correlation Tables: Blockplots .................. 75
6.3.2 Graphical Overview of Large Correlation Tables ..................... 78
6.3.3 Other Uses of Blockplots: p-Values .................................... 80
6.3.4 Other Uses of Blockplots: Fraction of Missing and Complete Pairs
of Values ............................................................... 81
6.3.5 Marginal and Bivariate Plots: Histograms/Barcharts, Scatterplots,
and Scatterplot Matrices .............................................. 82
6.3.6 Variations on Blockplots .............................................. 85
6.4 Operation of the AN ........................................................... 86
6.4.1 Starting Up the AN .................................................... 87
6.4.2 Moving Around: Crosshair Placement, Panning, and Zooming ....... 87
6.4.3 Graphical Parameters ................................................. 88
6.4.4 Correlations, p-Values, and Missing and Complete Pairs ............. 89
6.4.5 Highlighting: Strips .................................................... 90
6.4.6 Highlighting: Rectangles ............................................... 90
6.4.7 Reference Variables .................................................... 91
6.4.8 Searching Variables .................................................... 91
6.4.9 Lenses: Scatterplots and Barplots/Histograms ........................ 92
6.4.10 Color Brushing in Scatterplots ........................................ 94
6.4.11 Linear Adjustment ..................................................... 94
6.4.12 Future of AN ........................................................... 98
Appendix A: Versatility of Correlation Analysis .................................. 98
Appendix B: Creating and Programming AN Instances .......................... 100
Acknowledgments ...................................................................... 102
References ............................................................................. 102
6.1 Overview
The Association Navigator (AN for short) is an interactive visualization tool for viewing
large tables of correlations. The basic operation is zooming and panning of a table that is
presented in a graphical form, here called a blockplot.
73
74 Handbook of Big Data
The tool is really a toolbox that includes, among other things, the following: (1) display
of p-values and missing value patterns in addition to correlations, (2) markup facilities to
highlight variables and sub-tables as landmarks when navigating the larger table, (3) his-
tograms/barcharts, scatterplots, and scatterplot matrices as lenses into the distributions of
variables and variable pairs, (4) thresholding of correlations and p-values to show only
strong and highly significant p-values, (5) trimming of extreme values of the variables
for robustness, (6) reference variables that stay in sight at all times, and (7) wholesale
adjustment of groups of variables for other variables.
The tool has been applied to data with nearly 2000 variables and associated tables
approaching a size of 2000 × 2000. The usefulness of the tool is less in beholding gigantic
tables in their entirety and more in searching for interesting association patterns by
navigating manageable but numerous and interconnected sub-tables.
6.2 Introduction
This chapter describes the AN in three sections: (1) In this introductory section, we give
some background about the data analytic and statistical problem addressed by this tool;
(2) in Section 6.3, we describe the graphical displays used by the tool; and (3) in Section 6.4,
we describe the actual operation of the tool. We start with some background:
An important focus of contemporary statistical research is on methods for large
multivariate data. The term large can have two meanings, not mutually exclusive: (1) a
large number of cases (records, rows), also called the large-n problem, or (2) a large number
of variables (attributes, columns), also called the large-p problem. The two types of largeness
call for different data analytic approaches and determine the kinds of questions that can
be answered by the data. Most fundamentally, it should be observed that increasing n,the
number of cases, and increasing p, the number of variables, each has very different and in
some ways opposite effects on statistical analysis. Because the general multivariate analysis
problem is to make statistical inference about the association among variables, increasing n
has the effect of improving the certainty of inference due to improved precision of estimates,
whereas increasing p has the contrary effect of reducing the certainty of inference due to
the multiplicity problem or, more colorfully, the data dredging fallacy. Therefore, the level
of detail that can be inferred about association among variables improves with increasing
n, but it plummets with increasing p.
The problem we address here is primarily the large-p problem. From the above discussion,
it follows that, for large p, associations among variables can generally be inferred only to
a low level of detail and certainty. Hence, it is sufficient to measure association by simple
means such as plain correlations. Correlations indicate the basic directionality in pairwise
association, and as such they answer the simplest but also the most fundamental question:
are higher values in X associated with higher or lower values in Y , at least in tendency?
Reliance on correlations may be subject to objections because they seem limited in
their range of applicability for several reasons: (1) they are considered to be measures of
linear association only; (2) they describe bivariate association only; and (3) they apply to
quantitative variables only. In Appendix A, we refute or temper each of these objections
by showing that (1) correlations are usually useful measures of directionality even when
the associations are nonlinear; (2) higher-order associations play a reduced role especially
in large-p problems; and (3) with the help of a few tricks of the trade (scoring and dummy
coding), correlations are useful even for categorical variables, both ordinal and nominal. In
A Visualization Tool for Mining Large Correlation Tables 75
view of these arguments, we proceed from the assumption that correlation tables, when used
creatively, form quite general and powerful summaries of association among many variables.
In the following sections, we describe first how we graphically present large correlation
tables, and then how we navigate and search them interactively. The software written to this
end, the AN, implements the essential displays and interactive functionality to support the
mining of large correlation tables. The AN software is written entirely in the R language.
∗
All data examples in this chapter are drawn from the phenotypic data in the Simons
Simplex Collection (SSC) created by the Simons Foundation Autism Research Initiative
(SFARI). Approved researchers can obtain the SSC dataset used in this chapter by applying
at https://base.sfari.org.
6.3 Graphical Displays
6.3.1 Graphical Display of Correlation Tables: Blockplots
Figure 6.1 shows a first example of what we call a blockplot
†
of a dataset with p =38
variables. This plot is intended as a direct and fairly obvious translation of a numeric
correlation table into a visual form. The elements of the plot are as follows:
• The labels in the bottom and left margins show lineups of the same 38 variables:
age at ados p1.CDV, family type p1.CDV, sex p1.CDV,. . . . In contrast to tables, where the
vertical axis lists variables top down, we follow the convention of scatterplots where the
vertical axis is ascending, and hence the variables are listed bottom up.
• The blue and red squares or blocks represent the pairwise correlations between variables
at the intersections of the (imagined) horizontal and vertical lines drawn from the
respective margin labels. The magnitude of a correlation is reflected in the size of the
block and its sign in the color; positive correlations are shown in blue and negative
correlations in red.
‡
Along the ascending 45
◦
diagonal are the correlations +1 of the
variables with themselves; hence, these blocks are of maximal size. The closeness of
other correlations to +1 or −1 can be gauged by a size comparison with the diagonal
blocks.
• Finally, the plot shows a small comment in the bottom left, Correlations (Compl. Pairs),
indicating that what is represented by the blocks is correlation of complete—that is,
non-missing—pairs of values of the two variables in question. This comment refers to
the missing values problem and to the fact that correlation can only be calculated
from the cases where the values of both variables are non-missing. The comment also
alludes to the possibility that very different types of information could be represented
by the blocks, and this is indeed made use of by the AN software (see Sections 6.3.3
and 6.3.4).
∗
http://www.cran.r-project.org.
†
This type of plot is also called fluctuation diagram (Hofmann 2000). The term blockplot is ours, and
we introduce it because it is more descriptive of the plot’s visual appearance. We may even dare propose
that blockplot be contracted to blot, which would be in the tradition of contracting scatterplot matrix to
splom and graphics object to grob.
‡
We follow the convention from finance where being in the red implies negative numbers; the opposite
convention is from physics where red symbolizes higher temperatures. Users can easily change the defaults
for blockplots; see the programming hints in Appendix B.

76 Handbook of Big Data
age_at_ados_p1.CDV
family_type_p1.CDV
sex_p1.CDV
ethnicity_p1.CDV
cpea_dx_p1.CDV
adi_r_cpea_dx_p1.CDV
adi_r_soc_a_total_p1.CDV
adi_r_comm_b_non_verbal_total_p1.CDV
adi_r_b_comm_verbal_total_p1.CDV
adi_r_rrb_c_total_p1.CDV
adi_r_evidence_onset_p1.CDV
ados_module_p1.CDV
diagnosis_ados_p1.CDV
ados_css_p1.CDV
ados_social_affect_p1.CDV
ados_restricted_repetitive_p1.CDV
ados_communication_social_p1.CDV
ssc_diagnosis_verbal_iq_p1.CDV
ssc_diagnosis_verbal_iq_type_p1.CDV
ssc_diagnosis_nonverbal_iq_p1.CDV
ssc_diagnosis_nonverbal_iq_type_p1.CDV
ssc_diagnosis_full_scale_iq_p1.CDV
ssc_diagnosis_full_scale_iq_type_p1.CDV
ssc_diagnosis_vma_p1.CDV
ssc_diagnosis_nvma_p1.CDV
vineland_ii_composite_standard_score_p1.CDV
srs_parent_t_score_p1.CDV
srs_parent_raw_total_p1.CDV
srs_teacher_t_score_p1.CDV
srs_teacher_raw_total_p1.CDV
rbs_r_overall_score_p1.CDV
cbcl_2_5_internalizing_t_score_p1.CDV
cbcl_2_5_externalizing_t_score_p1.CDV
cbcl_6_18_internalizing_t_score_p1.CDV
cbcl_6_18_externalizing_t_score_p1.CDV
abc_total_score_p1.CDV
non_febrile_seizures_p1.CDV
febrile_seizures_p1.CDV
age_at_ados_p1.CDV
family_type_p1.CDV
sex_p1.CDV
ethnicity_p1.CDV
cpea_dx_p1.CDV
adi_r_cpea_dx_p1.CDV
adi_r_soc_a_total_p1.CDV
adi_r_comm_b_non_verbal_total_p1.CDV
adi_r_b_comm_verbal_total_p1.CDV
adi_r_rrb_c_total_p1.CDV
adi_r_evidence_onset_p1.CDV
ados_module_p1.CDV
diagnosis_ados_p1.CDV
ados_css_p1.CDV
ados_social_affect_p1.CDV
ados_restricted_repetitive_p1.CDV
ados_communication_social_p1.CDV
ssc_diagnosis_verbal_iq_p1.CDV
ssc_diagnosis_verbal_iq_type_p1.CDV
ssc_diagnosis_nonverbal_iq_p1.CDV
ssc_diagnosis_nonverbal_iq_type_p1.CDV
ssc_diagnosis_full_scale_iq_p1.CDV
ssc_diagnosis_full_scale_iq_type_p1.CDV
ssc_diagnosis_vma_p1.CDV
ssc_diagnosis_nvma_p1.CDV
v
ineland_ii_composite_standard_score_p1.CDV
srs_parent_t_score_p1.CDV
srs_parent_raw_total_p1.CDV
srs_teacher_t_score_p1.CDV
srs_teacher_raw_total_p1.CDV
rbs_r_overall_score_p1.CDV
cbcl_2_5_internalizing_t_score_p1.CDV
cbcl_2_5_externalizing_t_score_p1.CDV
cbcl_6_18_internalizing_t_score_p1.CDV
cbcl_6_18_externalizing_t_score_p1.CDV
abc_total_score_p1.CDV
non_febrile_seizures_p1.CDV
febrile_seizures_p1.CDV
Correlations
(Compl. Pairs)
FIGURE 6.1
A first example of a blockplot: labels in the bottom and left margins show variable names,
and blue and red blocks in the plotting area show positive and negative correlations.
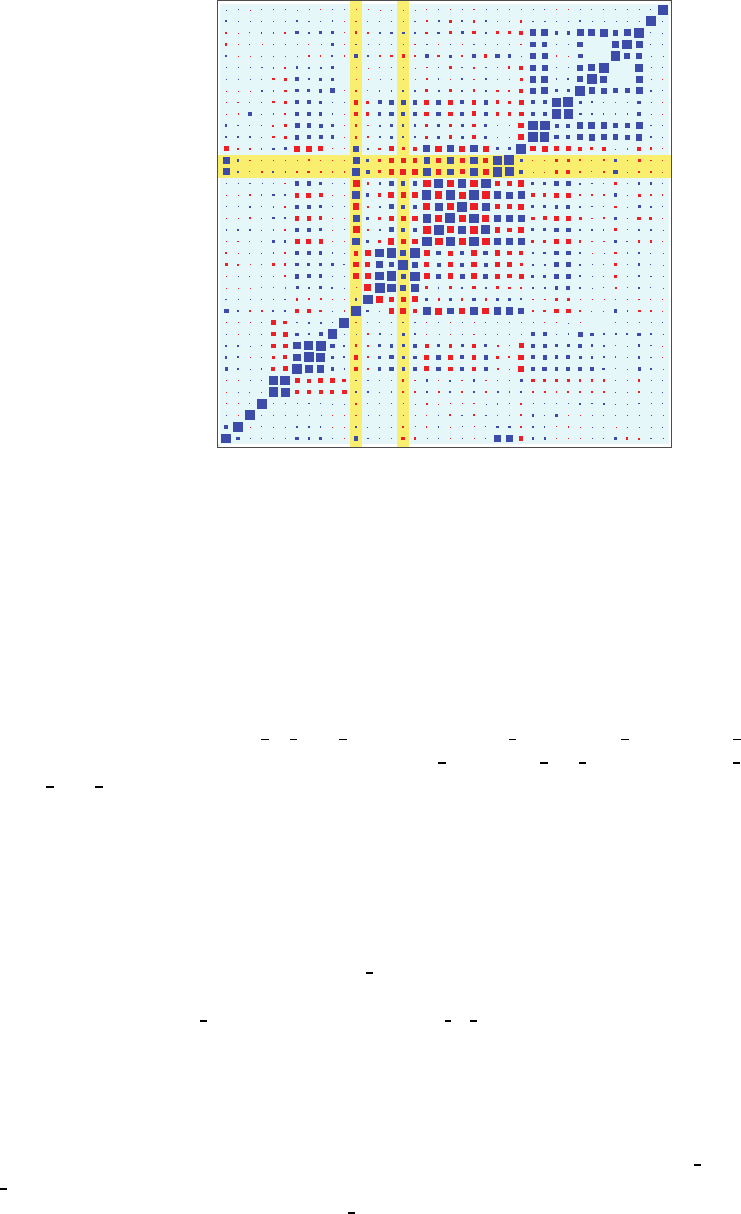
As a reading exercise, consider Figure 6.2: this is the same blockplot as in Figure 6.1,
but for ease of pointing, we marked up two variables on the horizontal axis
∗
:
age at ados p1.CDV, ados restricted repetitive p1.CDV
which means “age at the time of the administration of the Autism Diagnostic Observation
Schedule,” and “problems due to restricted and repetitive behaviors,” respectively. Two
other variables are marked up on the vertical axis:
ssc diagnosis vma p1.DCV, ssc diagnosis nvma p1.DCV.
which means verbal mental age,andnonverbal mental age, respectively, which are related
to notions of intelligence quotient (IQ). For readability, we will shorten the labels in what
follows.
As for the actual reading exercise, in the intersection of the left vertical strip with the
horizontal strip, we find two blue blocks, of which the lower is recognizably larger than the
upper (the reader may have to zoom in while viewing the figure in a PDF reader), implying
that the correlation of
age at ados.. with both ..vma.. and ..nvma.. is positive, but more
strongly with the former than the latter, which may be news to the nonspecialist: verbal
∗
This dataset represents a version of the table proband cdv.csv in version 9 of the phenotypic SSC.
The acronym cdv means c ore descriptive variables.
A Visualization Tool for Mining Large Correlation Tables 77
age_at_ados_p1.CDV
family_type_p1.CDV
sex_p1.CDV
ethnicity_p1.CDV
cpea_dx_p1.CDV
adi_r_cpea_dx_p1.CDV
adi_r_soc_a_total_p1.CDV
adi_r_comm_b_non_verbal_total_p1.CDV
adi_r_b_comm_verbal_total_p1.CDV
adi_r_rrb_c_total_p1.CDV
adi_r_evidence_onset_p1.CDV
ados_module_p1.CDV
diagnosis_ados_p1.CDV
ados_css_p1.CDV
ados_social_affect_p1.CDV
ados_restricted_repetitive_p1.CDV
ados_communication_social_p1.CDV
ssc_diagnosis_verbal_iq_p1.CDV
ssc_diagnosis_verbal_iq_type_p1.CDV
ssc_diagnosis_nonverbal_iq_p1.CDV
ssc_diagnosis_nonverbal_iq_type_p1.CDV
ssc_diagnosis_full_scale_iq_p1.CDV
ssc_diagnosis_full_scale_iq_type_p1.CDV
ssc_diagnosis_vma_p1.CDV
ssc_diagnosis_nvma_p1.CDV
v
ineland_ii_composite_standard_score_p1.CDV
srs_parent_t_score_p1.CDV
srs_parent_raw_total_p1.CDV
srs_teacher_t_score_p1.CDV
srs_teacher_raw_total_p1.CDV
rbs_r_overall_score_p1.CDV
cbcl_2_5_internalizing_t_score_p1.CDV
cbcl_2_5_externalizing_t_score_p1.CDV
cbcl_6_18_internalizing_t_score_p1.CDV
cbcl_6_18_externalizing_t_score_p1.CDV
abc_total_score_p1.CDV
non_febrile_seizures_p1.CDV
febrile_seizures_p1.CDV
Correlations
(Compl. Pairs)
FIGURE 6.2
A reading exercise illustrated with the same example as in Figure 6.1. The salmon-colored
strips highlight the variables age
at ados p1.CDV and ados restricted repetitive
p1.CDV on the horizontal axis, and the variables ssc diagnosis vma p1.DCV and ssc
diagnosis nvma p1.DCV on the vertical axis. At the intersections of the strips are the
blocks that reflect the respective correlations.
skills are more strongly age related than nonverbal skills. (Strictly speaking, we can claim
this only for the present sample of autistic probands.) Similarly, following the right vertical
strip to the intersection with the horizontal strip, we find two red blocks, of which again
the lower block is slightly larger than the upper, but both are smaller than the blue blocks
in the left strip. This implies that
..restricted repetitive.. is negatively correlated with
both
..vma.. and ..nvma.. but more strongly with the former, and both are more weakly
correlated with
..restricted repetitive.. than with age at ados... All of this makes sense
in light of the apparent meanings of the variables: Any notion of mental age is probably
quite strongly and positively associated with chronological age; with hindsight we may also
accept that problems with specific behaviors tend to diminish with age, but the association
is probably less strong than that between different notions of age.
Some other patterns are quickly parsed and understood: the two 2 × 2blocksonthe
upper-right diagonal stem from two versions of the same underlying measurements, raw
total
and t
score. Next, the alternating patterns of red and blue in the center indicate that
the three IQ measures (verbal, nonverbal, full
scale) are in an inverse association with the
..................Content has been hidden....................
You can't read the all page of ebook, please click here login for view all page.