
A Visualization Tool for Mining Large Correlation Tables 93
rbs_r_vi_restricted_behavior_p1.OCUV
abc_nbr_missing_p1.OCUV
abc_i_irritability_p1.OCUV
abc_iv_hyperactivity_p1.OCUV
abc_ii_lethargy_p1.OCUV
abc_iii_stereotypy_p1.OCUV
abc_v_inappropriate_speech_p1.OCUV
scq_life_nbr_missing_p1.OCUV
scq_life_item_1_p1.OCUV
scq_life_total_p1.OCUV
cbcl_2_5_anxious_depressed_p1.OCUV
cbcl_2_5_somatic_complaints_p1.OCUV
cbcl_2_5_withdrawn_p1.OCUV
cbcl_2_5_sleep_problems_p1.OCUV
cbcl_2_5_attention_problems_p1.OCUV
cbcl_2_5_aggressive_behavior_p1.OCUV
cbcl_2_5_total_problems_p1.OCUV
cbcl_2_5_affective_problems_p1.OCUV
cbcl_2_5_anxiety_problems_p1.OCUV
cbcl_2_5_pervasive_developmental_p1.OCUV
cbcl_2_5_add_adhd_p1.OCUV
cbcl_2_5_add_adhd_p1.OCUV
cbcl_2_5_oppositional_defiant_p1.OCUV
cbcl_6_18_activities_p1.OCUV
cbcl_6_18_social_p1.OCUV
cbcl_6_18_school_p1.OCUV
cbcl_6_18_total_competence_p1.OCUV
cbcl_6_18_anxious_depressed_p1.OCUV
cbcl_6_18_withdrawn_p1.OCUV
cbcl_6_18_somatic_complaints_p1.OCUV
cbcl_6_18_social_problems_p1.OCUV
cbcl_6_18_thought_problems_p1.OCUV
cbcl_6_18_attention_problems_p1.OCUV
cbcl_6_18_rule_breaking_p1.OCUV
cbcl_6_18_aggressive_behavior_p1.OCUV
cbcl_6_18_total_problems_p1.OCUV
cbcl_6_18_affective_problems_p1.OCUV
cbcl_6_18_anxiety_problems_p1.OCUV
cbcl_6_18_somatic_prob_p1.OCUV
cbcl_6_18_add_adhd_p1.OCUV
cbcl_6_18_oppositional_defiant_p1.OCUV
cbcl_6_18_conduct_problems_p1.OCUV
cbcl_2_5_emotionally_reactive_p1.OCUV
Correlations
(Compl. pairs)
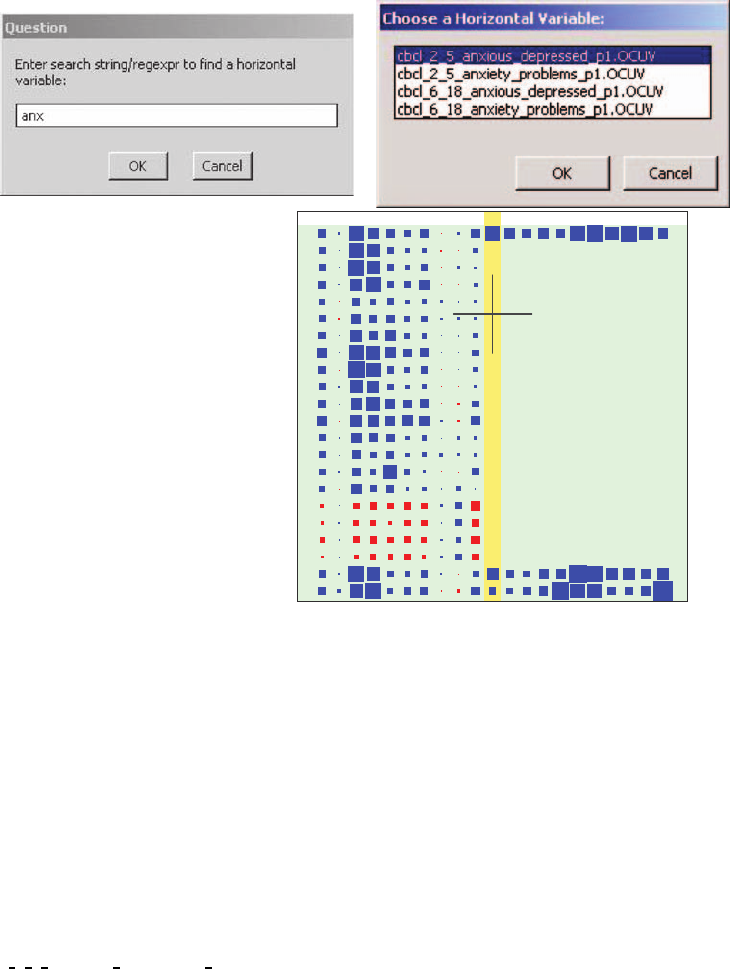
FIGURE 6.11
Text search with
H for horizontal variables containing anx, followed by selection of
cbcl 2 5 anxious depressed p1.OCUV. The view pans horizontally to the selected variable,
marks it with a vertical highlight strip, and places the crosshair on it.
the association (and the marginal distribution) in greater detail; see Section 6.3.5. The
mechanics are as follows: Hit
• x to see in a separate window (Figure 6.7) a scatterplot and barplots/histograms of the
two variables marked by the crosshair cursor.
• y to switch the x–y roles of the variables.
• l to toggle showing a line,thatis,asmoothifx is quantitative, and a trace of y-means
of the x-groups if x is categorical.
94 Handbook of Big Data
Important: The lens window is passive and does not accept interactive input. One must
expose the blockplot master window to continue with AN interactions.
These lenses have a simple history mechanism in that the consecutive x–y variable names
are collected in a list that can be traversed and edited: Hit
• PgUp to take one step back in the history.
• PgDn to take one step forward in the history.
• Home to jump to the beginning of the history.
• End to jump to the end of the history (the present).
• Delete to delete the current lens from the history.
Finally, there is a separate lens mechanism with its own window that shows all pairwise
scatterplots of the variables currently in highlight strips. An example is shown in Figure 6.8.
As to the mechanics, hit
• z to create the scatterplot matrix with independently scaled axes.
• Z to create the scatterplot matrix with identically scaled axes.
The latter option is sometimes useful when all variables live on the same scale but have
somewhat different ranges.
6.4.10 Color Brushing in Scatterplots
Often one would like to focus on groups of cases in the scatterplots of the lens window. This
can be achieved with color brushing as follows:
• Hit s to see the current lens scatterplot in the main window, replacing the blockplot.
• Hit r to fix one corner of a brush at the current mouse location.
• Left-depress and drag the mouse: The rectangular brushing area should open up and
change shape. Whenever the brush moves over a scatterplot point, it will change color.
• Right-depress and drag the mouse: The rectangular brushing area will translate along
with the mouse. Again, moving over scatterplot points will change their color.
• The brushing color can be changed by cycling through a series of colors, hitting S.The
color gray does not paint; it is useful for counting the points under the brush as their
number is shown in the bottom-left corner.
• Hit s to return to the blockplot in the main window.
Thus, hitting s toggles between blockplot and scatterplot in the main window. After each
brushing operation, the lens scatterplot will follow suit and color its points to match those
in the main window.
6.4.11 Linear Adjustment
Another recurrent task in large tables is what we may call adjustment. The phrase adjusting
for x has many synonyms: accounting for x, controlling for x, correcting for x, adjusting for
x, and holding xfixedor conditioning on x. Technically most correct is the last expression: we
are often interested in the conditional association between variables y and z given (holding
fixed) a variable x, as measured, for example, by the conditional correlation r(y, z|x). In
the context of the autism phenotype, one may be interested in adjusting for age and/or
gender. In practice, particularly in large-p problems, there is rarely sufficient data to truly
A Visualization Tool for Mining Large Correlation Tables 95
estimate conditional distributions;
∗
hence, one makes the simplifying assumption that all
associations are linear with constant conditional variances (homoscedasticity).
†
In that
case, adjustment of y for x amounts to a linear regression and forming residuals, that
is, residualizing or partialling out is done by subtracting the equation fitted with linear
regression: y
·x
= y −(b
0
+ b
1
x). As a consequence, r(y
·x
,x) = 0, that is, by forming y
·x
one
removes from y the linear association with x. This type of linear adjustment generalizes to
multiple x variables by residualizing with regard to a multiple linear regression.
In the AN implementation of linear adjustment, one has to select a set of independent x-
variables, called adjustors,andasetofdependent y-variables, called the adjustees.Oftenthe
set of adjustors is small, possibly just one variable such as age, whereas the set of adjustees
can be large, for example, all items and summary scales of an autism phenotype instrument
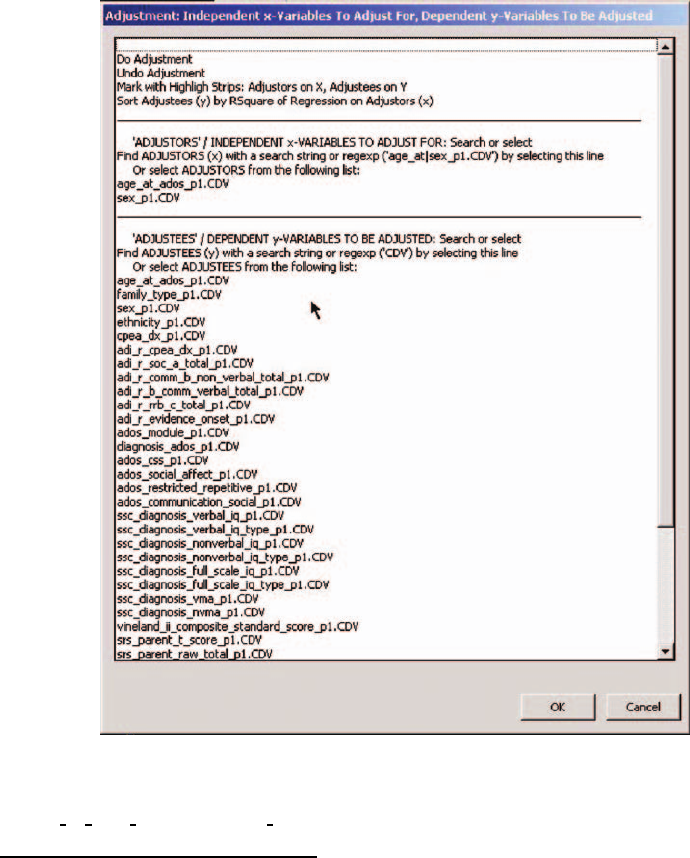
FIGURE 6.12
Screenshot of the adjustment menu. As shown, it enables adjustment of the
srs variables
for
age at ados p1.CDV and sex p1.CDV.
∗
Natural exceptions do exist: If we analyze females and males separate, for example, we study gender-
conditional associations.
†
Both assumptions may be wrong, but some form of adjustment, even if flawed, is often more informative
than remaining with raw variables.
96 Handbook of Big Data
such as the Social Responsiveness Scale (SRS). The selection mechanisms are the same for
both adjustors and adjustees: text search or regular expression matching, followed by menu
selection, similar to Section 6.4.8, but here the menu selection allows multiple choices. The
mechanics are as follows: Hit
• A to call up a large menu that forms the interface for all adjustment operations.
An example is shown in Figure 6.12. Initially, the list of adjustors and adjustees will be
empty, so both need to be populated with text searches that require a dialog initiated by
selecting the lines
Find ADJUSTORS... and Find ADJUSTEES... in sequence. Figure 6.12 shows
the state after having matched the regular expression
age at|sex p1.CDV for adjustors and
searched the string
CDV for adjustees.
Finally, after selection of adjustors and adjustees is completed, the user may select the
top line of the menu to actually
Do Adjustment. Each raw adjustee will then be replaced by
its residuals obtained from the regression onto the adjustors. (To undo adjustment, select
the second line from the Adjustment dialog,
Undo Adjustment.)
To assist the visual examination of adjustment results, one may want to select the third
line from the top of the menu in order to highlight the adjustors among the x-variables
and the adjustees among the y-variables (
Mark with Highlight Strips...). Turning them
further into reference variables (Section 6.4.7) by hitting
R, we obtain Figure 6.13. As it
should be, the correlations between the two adjustors on the x-axis and the many adjustees
age_at_ados_p1.CDV
sex_p1.CDV
adi_r_b_comm_verbal_total_p1.CDV
adi_r_rrb_c_total_p1.CDV
adi_r_evidence_onset_p1.CDV
ados_module_p1.CDV
diagnosis_ados_p1.CDV
ados_css_p1.CDV
ados_social_affect_p1.CDV
ados_restricted_repetitive_p1.CDV
ados_communication_social_p1.CDV
ssc_diagnosis_verbal_iq_p1.CDV
ssc_diagnosis_verbal_iq_type_p1.CDV
ssc_diagnosis_nonverbal_iq_p1.CDV
ssc_diagnosis_nonverbal_iq_type_p1.CDV
ssc_diagnosis_full_scale_iq_p1.CDV
ssc_diagnosis_full_scale_iq_type_p1.CDV
ssc_diagnosis_vma_p1.CDV
ssc_diagnosis_nvma_p1.CDV
v
ineland_ii_composite_standard_score_p1.CDV
srs_parent_t_score_p1.CDV
srs_parent_raw_total_p1.CDV
srs_teacher_t_score_p1.CDV
srs_teacher_raw_total_p1.CDV
rbs_r_overall_score_p1.CDV
cbcl_2_5_internalizing_t_score_p1.CDV
cbcl_2_5_externalizing_t_score_p1.CDV
cbcl_6_18_internalizing_t_score_p1.CDV
cbcl_6_18_externalizing_t_score_p1.CDV
abc_total_score_p1.CDV
non_febrile_seizures_p1.CDV
febrile_seizures_p1.CDV
bckgd_hx_highest_edu_mother_p1.OCUV
bckgd_hx_highest_edu_father_p1.OCUV
bckgd_hx_annual_household_p1.OCUV
bckgd_hx_parent_relation_status_p1.OCUV
ssc_dx_best_estimate_dx_list_p1.OCUV
ssc_dx_overallcertainty_p1.OCUV
gender_sib1_p1.OCUV
nbr_stillbirth_miscarriage_p1.OCUV
proband_birth_order_p1.OCUV
family_structure_p1.OCUV
adi_r_q09_single_words_p1.OCUV
word_delay_p1.OCUV
adi_r_q10_first_phrases_p1.OCUV
phrase_delay_p1.OCUV
adi_r_q30_overall_language_p1.OCUV
adi_r_q86_abnormality_evident_p1.OCUV
adi_r_q87_abnormality_manifest_p1.OCUV
ados1_algorithm_p1.OCUV
ados2_algorithm_p1.OCUV
a1_non_echoed_p1.OCUV
ados_communication_p1.OCUV
ados_reciprocal_social_p1.OCUV
vabs_ii_communication_p1.OCUV
vabs_ii_dls_standard_p1.OCUV
vabs_ii_soc_standard_p1.OCUV
vabs_ii_motor_skills_p1.OCUV
srs_parent_nbr_missing_items_p1.OCUV
srs_parent_awareness_p1.OCUV
srs_parent_cognition_p1.OCUV
srs_parent_communication_p1.OCUV
srs_parent_mannerisms_p1.OCUV
srs_parent_motivation_p1.OCUV
srs_teacher_nbr_missing_items_p1.OCUV
srs_teacher_awareness_p1.OCUV
srs_teacher_cognition_p1.OCUV
srs_teacher_communication_p1.OCUV
srs_teacher_mannerisms_p1.OCUV
age_at_ados_p1.CDV
family_type_p1.CDV
sex_p1.CDV
ethnicity_p1.CDV
cpea_dx_p1.CDV
adi_r_cpea_dx_p1.CDV
adi_r_soc_a_total_p1.CDV
adi_r_comm_b_non_verbal_total_p1.CDV
adi_r_b_comm_verbal_total_p1.CDV
adi_r_rrb_c_total_p1.CDV
adi_r_evidence_onset_p1.CDV
ados_module_p1.CDV
diagnosis_ados_p1.CDV
ados_css_p1.CDV
ados_social_affect_p1.CDV
ados_restricted_repetitive_p1.CDV
ados_communication_social_p1.CDV
ssc_diagnosis_verbal_iq_p1.CDV
ssc_diagnosis_verbal_iq_type_p1.CDV
ssc_diagnosis_nonverbal_iq_p1.CDV
ssc_diagnosis_nonverbal_iq_type_p1.CDV
ssc_diagnosis_full_scale_iq_p1.CDV
ssc_diagnosis_full_scale_iq_type_p1.CDV
ssc_diagnosis_vma_p1.CDV
ssc_diagnosis_nvma_p1.CDV
v
ineland_ii_composite_standard_score_p1.CDV
srs_parent_t_score_p1.CDV
srs_parent_raw_total_p1.CDV
srs_teacher_t_score_p1.CDV
srs_teacher_raw_total_p1.CDV
rbs_r_overall_score_p1.CDV
cbcl_2_5_internalizing_t_score_p1.CDV
cbcl_2_5_externalizing_t_score_p1.CDV
cbcl_6_18_internalizing_t_score_p1.CDV
cbcl_6_18_externalizing_t_score_p1.CDV
abc_total_score_p1.CDV
non_febrile_seizures_p1.CDV
febrile_seizures_p1.CDV
ssc_dx_best_estimate_dx_list_p1.OCUV
ssc_dx_overallcertainty_p1.OCUV
gender_sib1_p1.OCUV
nbr_stillbirth_miscarriage_p1.OCUV
proband_birth_order_p1.OCUV
family_structure_p1.OCUV
adi_r_q09_single_words_p1.OCUV
word_delay_p1.OCUV
adi_r_q10_first_phrases_p1.OCUV
phrase_delay_p1.OCUV
adi_r_q30_overall_language_p1.OCUV
adi_r_q86_abnormality_evident_p1.OCUV
adi_r_q87_abnormality_manifest_p1.OCUV
ados1_algorithm_p1.OCUV
ados2_algorithm_p1.OCUV
a1_non_echoed_p1.OCUV
ados_communication_p1.OCUV
ados_reciprocal_social_p1.OCUV
vabs_ii_communication_p1.OCUV
vabs_ii_dls_standard_p1.OCUV
vabs_ii_soc_standard_p1.OCUV
vabs_ii_motor_skills_p1.OCUV
srs_parent_nbr_missing_items_p1.OCUV
srs_parent_awareness_p1.OCUV
srs_parent_cognition_p1.OCUV
srs_parent_communication_p1.OCUV
srs_parent_mannerisms_p1.OCUV
srs_parent_motivation_p1.OCUV
srs_teacher_nbr_missing_items_p1.OCUV
srs_teacher_awareness_p1.OCUV
srs_teacher_cognition_p1.OCUV
Correlations
(Compl. pairs)
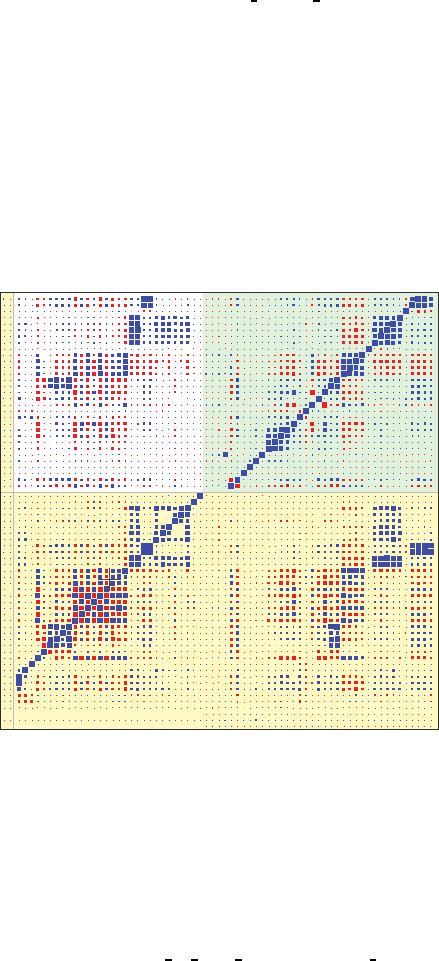
FIGURE 6.13
Results of adjustment of the
CDV variables for age at ados p1.CDV and sex p1.CDV:theformer
are reference variables on the y-axis, and the latter on the x-axis. As it should be, the
correlations between adjustors and adjustees vanish.
A Visualization Tool for Mining Large Correlation Tables 97
on the y-axis vanish. The correlations of the adjustees with other variables may now be of
renewed interest because they are free of age and gender effects, which would invite a search
of the correlations in the horizontal band of the adjustees.
A word of caution is that adjustment of a y-variable is done using only cases for which
there are no missing values among the adjustors and obviously the adjustee is not missing
either. Thus, the underlying set of cases may have been inadvertently decreased. It is
therefore good advice to check the missing pairs patterns with either
ctrl-M or ctrl-N
(Section 6.4.4) or by looking at scatterplots (Section 6.4.9).
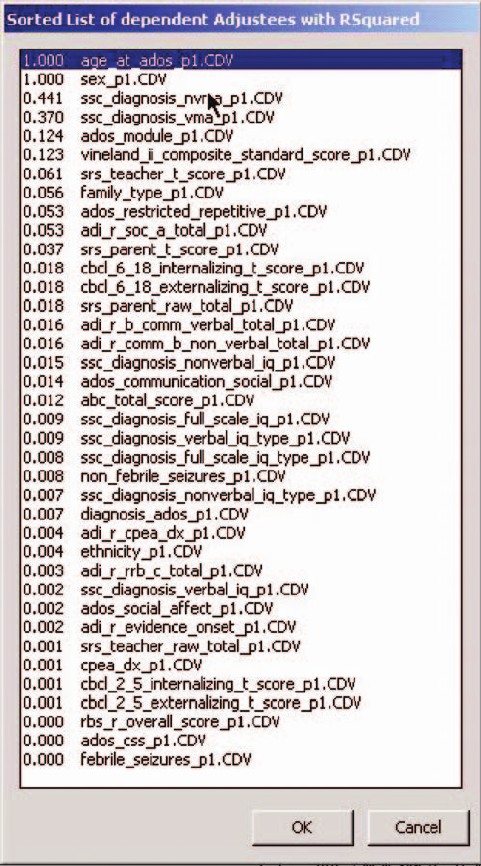
Having done adjustment of variables, one often wonders how much of it was done and
to which variable. To answer this question, select the fourth line from the Adjustment
FIGURE 6.14
List of adjustees/y-variables sorted according to the R
2
values from the regressions onto
the adjustors/x-variables.
..................Content has been hidden....................
You can't read the all page of ebook, please click here login for view all page.