
Characterization methods for high temperature polymer blends
L.A. Utracki, formerly of the National Research Council, Canada
Abstract:
This chapter provides information about characterization methods for examining the structure and properties of blends that contain at least one high temperature polymer. Methods are described that probe both the phase structure of such blends as well as techniques that define and measure the properties of blends. Relations between the determined phase structure and resultant properties are also discussed.
2.1 Introduction
The first patent relating to polymer alloys and blends (PAB) was granted to Parkes in 1846.1 It described blending two types of polyisoprene, amorphous natural rubber (NR) and semi-crystalline gutta-percha (GP). Neither the amorphous, sticky, highly deformable natural rubber nor its isomer, crystalline gutta-percha, was useful, but blending them created a rubber with superior processability and properties. Since then the blending of polymers has become widespread. Blending benefits the manufacturer as well as the consumer. The former enjoys improved production flexibility, better processability, product uniformity, and scrap reduction, while the latter benefits by having tailor-made materials with a full set of desired properties. There are a number of books which review the fundamental aspects of PABs,2,3 the evolution of commercial PABs4,5 and the commercial blends available in the market.6 There are also major reference works on PAB, such as those by Utracki and Isayev.7,8
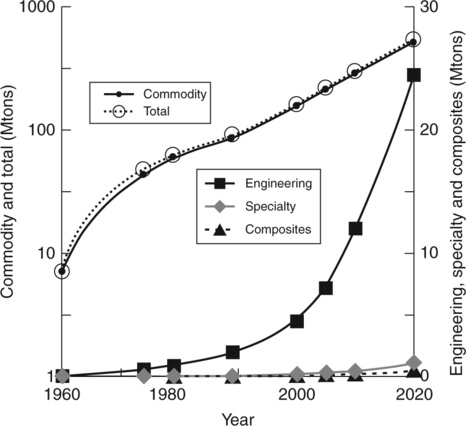
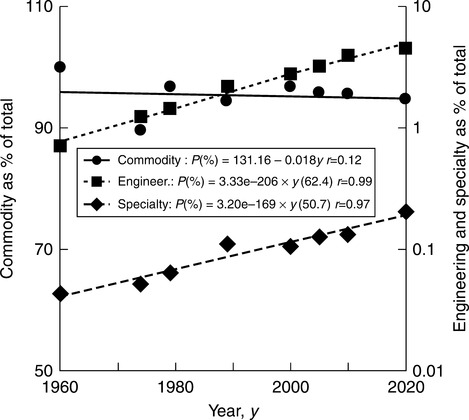
While the early plastics were bio-based (e.g., rubbers, cellulose, starch, urea-formaldehyde) at present 95 wt% of plastics are synthetic, consuming 4–8% of the available petroleum feedstock. Packaging uses the most plastics (32%), followed by building construction (20%), consumer goods (18%), electrical and automotive engineering (each 9%), agriculture (6%) and other sectors (the remainder). World plastics production to meet this need has followed an exponential curve clearly influenced by political events, for example, slow-down during periods of depression (e.g., in the 1930s) and acceleration during wars (e.g., during WWII).5 World plastics production in 1900 was about 30 thousand tons (kt), increasing to 300 million tons (mt) by the year 2010. Figures 2.1 and 2.2 show the growth after 1960, extrapolated to 2020.9
Dozens of blends are in the market. Since synergism is rare, new blends are designed by adding components to achieve the desired performance characteristics. Historically blend complexity has tended to increase; for example, while initially two-component blends were sufficient (e.g., PPE + PS or HIPS) nowadays blends with seven polymers + compatibilizers are available (e.g., PPE + PS or HIPS, PC, ASA, SAN, SEBS and PTFE10) or alternatively PPE with either PS, SEBS or HIPS, PC, PEST, ABS, PMMA and copolymer of alkyl and glycidyl methacrylate.11
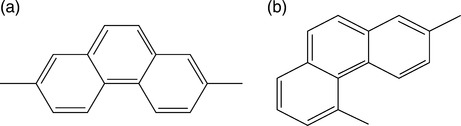
Physical modification usually leads to molecular orientation of high molecular weight semicrystalline polymers, such as PE, PP, or PARA produced in the form of fibers or tapes. Examples include Dyneema®, Innegra™ and Kevlar.12–14 Since high performance is often associated with a rigid molecular structure, these materials are excellent for applications such as reinforcing composites.15 Chemical modification also opens the way to new, better performing blends. For example, Solvay Advanced Polymers deposited a patent application for a new PPE obtained by condensation para-substituted polyphenylene and kink-forming arylene units (see Fig. 2.3). By combining two types of polyarylene macromolecules the inventors obtained materials with an exceptional set of mechanical properties and flame resistance.16 In essence, the invention describes blends of two high performance copolymers containing substituted or not substituted p-phenylene with unsubstituted m-phenylene, i.e., two types of rigid rod and flexible chain statistical segments that are miscible in the amorphous phase and self-reinforced by forming high aspect ratio rigid-rod crystals.
Copolymers with different concentrations of linear and kinked monomers can be melt-blended with each other or with other high temperature polymers (HTPs) into a variety of grades optimized for aerospace applications, surgical and medical devices, silicon wafer processing in electronics, military and defense applications, membranes for separation of gases, liquids and solids, etc. These self-reinforcing polyphenylenes (SRPs) show high strength and stiffness, outstanding mechanical performance, flame resistance, chemical resistance, surface finish, low thermal expansion and H2O absorption. As an example, Table 2.1 lists a variety of PA blends. Similar tables can be constructed for any polymer in Table 2.2.2–8
Table 2.1
PA blends with specialty polymers17
| Composition | Comment | |
| 1. | PA/PSF blends | |
| PSF with PA-11 | For improved impact properties | |
| PA/PSF with poly(sulfone-g-lactam) | Processability and mechanical properties | |
| PA-6/PSF | Processability, thermal and mechanical properties | |
| PARA/PES | HDT = 172 °C and mechanical properties | |
| PA-46/PES | Mechanical and thermal properties | |
| PARA/PES | Mechanical and thermal performance | |
| PAES or PES blended with PA-6 T6 | High heat resistance and stiffness | |
| 2. | PA/PPS blends | |
| PARA with a small amount of PPS | Moldability, HDT, and impact strength | |
| PA-46 with PPS | Impact and mechanical properties, HDT, heat and chemical resistance | |
| PPS with polyphthalamide (PPA) | Heat and chemical resistance, HDT, mechanical properties | |
| PPS with PPA and GF | Mechanical properties | |
| PPS/PA with EPDM and MA | Compatibilized-cum-impact modified | |
| PPSS with either PA or PEST | Mechanical properties, HDT, dimensional and chemical stability | |
| PPS, either PA-66 or PA-MXD6 and Mg(OH)2 | Tensile strength, arc tracking, and heat resistance | |
| 3. | PA/phenoxy blends | |
| PA-6 with phenoxy | Excellent ESCR | |
| PA-66 with phenoxy and SEBS | Tensile and impact strength | |
| PA with PEST, phenoxy and MBS | Tensile and impact properties | |
| 4. | PA/PEA blends | |
| PA-12 with PEA | Tough, flexible, heat and hot oil resistant | |
| PEBA/PA and (ABS, MBS, NBR, SBR or EPDM) | Impact strength at low-T, Rilsan™ | |
| 5. | PA/PAI blends | |
| PAI with PA-66 or PARA and inorganic filler | Moldings with high mechanical performance | |
| PI, PA, PAI or PI + PA and aromatic PI | Miscible blends for selective permeation | |
| 6. | PA/PEI blends | |
| PEI with PA or PEST | Processability | |
| PEI with PA-6 and PEI-b-PA | Impact strength | |
| PEI with PA-6 or PA-66 | Compatibilized by nonyl-phenolic | |
| PEI with PA-12 | Reduced shrinkage and water absorption | |
| Copolyesteretherimide, PEEI Lomod™, blended with either PA or PARA | Thermal aging behavior | |
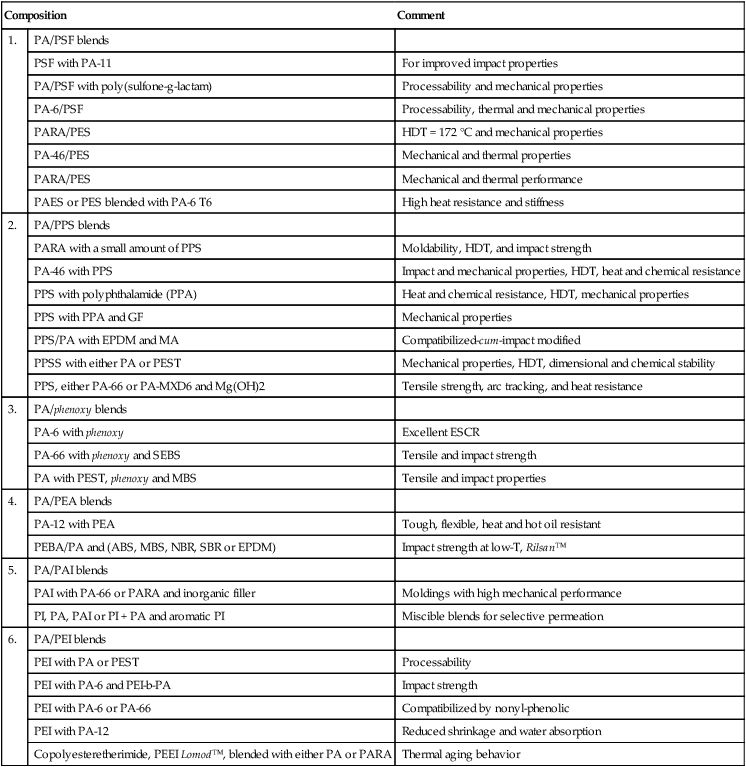
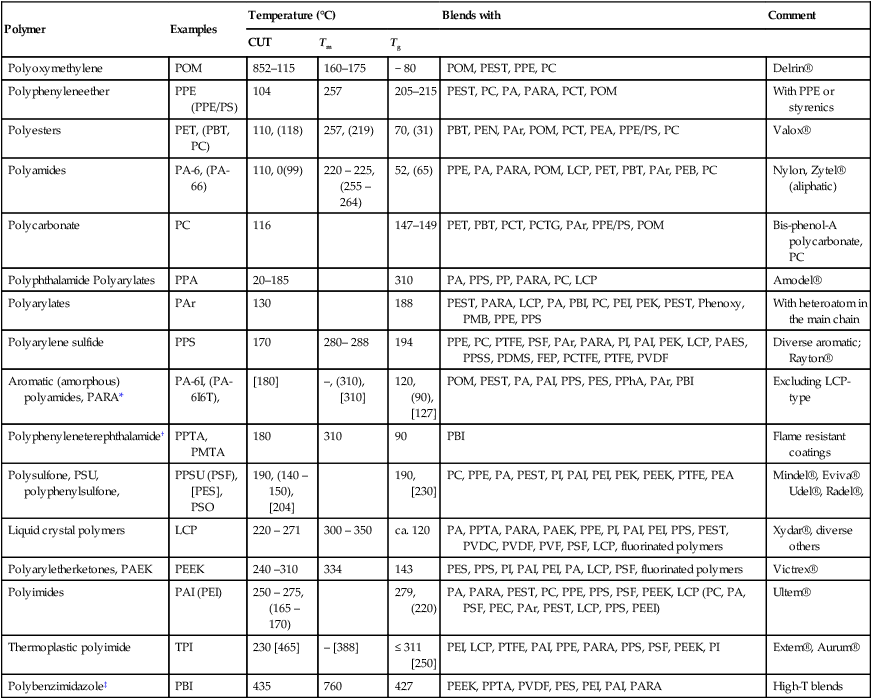
Table 2.2
High temperature polymer blends (HTPBs) arranged in order of increasing ‘continuous use temperature’ (CUT)
| Polymer | Examples | Temperature (°C) | Blends with | Comment | ||
| CUT | Tm | Tg | ||||
| Polyoxymethylene | POM | 852–115 | 160–175 | − 80 | POM, PEST, PPE, PC | Delrin® |
| Polyphenyleneether | PPE (PPE/PS) | 104 | 257 | 205–215 | PEST, PC, PA, PARA, PCT, POM | With PPE or styrenics |
| Polyesters | PET, (PBT, PC) | 110, (118) | 257, (219) | 70, (31) | PBT, PEN, PAr, POM, PCT, PEA, PPE/PS, PC | Valox® |
| Polyamides | PA-6, (PA-66) | 110, 0(99) | 220 – 225, (255 – 264) | 52, (65) | PPE, PA, PARA, POM, LCP, PET, PBT, PAr, PEB, PC | Nylon, Zytel® (aliphatic) |
| Polycarbonate | PC | 116 | 147–149 | PET, PBT, PCT, PCTG, PAr, PPE/PS, POM | Bis-phenol-A polycarbonate, PC | |
| Polyphthalamide Polyarylates | PPA | 20–185 | 310 | PA, PPS, PP, PARA, PC, LCP | Amodel® | |
| Polyarylates | PAr | 130 | 188 | PEST, PARA, LCP, PA, PBI, PC, PEI, PEK, PEST, Phenoxy, PMB, PPE, PPS | With heteroatom in the main chain | |
| Polyarylene sulfide | PPS | 170 | 280– 288 | 194 | PPE, PC, PTFE, PSF, PAr, PARA, PI, PAI, PEK, LCP, PAES, PPSS, PDMS, FEP, PCTFE, PTFE, PVDF | Diverse aromatic; Rayton® |
| Aromatic (amorphous) polyamides, PARA* | PA-6I, (PA-6I6T), | [180] | –, (310), [310] | 120, (90), [127] | POM, PEST, PA, PAI, PPS, PES, PPhA, PAr, PBI | Excluding LCP-type |
| Polyphenyleneterephthalamide† | PPTA, PMTA | 180 | 310 | 90 | PBI | Flame resistant coatings |
| Polysulfone, PSU, polyphenylsulfone, | PPSU (PSF), [PES], PSO | 190, (140 – 150), [204] | 190, [230] | PC, PPE, PA, PEST, PI, PAI, PEI, PEK, PEEK, PTFE, PEA | Mindel®, Eviva® Udel®, Radel®, | |
| Liquid crystal polymers | LCP | 220 – 271 | 300 – 350 | ca. 120 | PA, PPTA, PARA, PAEK, PPE, PI, PAI, PEI, PPS, PEST, PVDC, PVDF, PVF, PSF, LCP, fluorinated polymers | Xydar®, diverse others |
| Polyaryletherketones, PAEK | PEEK | 240 –310 | 334 | 143 | PES, PPS, PI, PAI, PEI, PA, LCP, PSF, fluorinated polymers | Victrex® |
| Polyimides | PAI (PEI) | 250 – 275, (165 – 170) | 279, (220) | PA, PARA, PEST, PC, PPE, PPS, PSF, PEEK, LCP (PC, PA, PSF, PEC, PAr, PEST, LCP, PPS, PEEI) | Ultem® | |
| Thermoplastic polyimide | TPI | 230 [465] | – [388] | ≤ 311 [250] | PEI, LCP, PTFE, PAI, PPE, PARA, PPS, PSF, PEEK, PI | Extem®, Aurum® |
| Polybenzimidazole‡ | PBI | 435 | 760 | 427 | PEEK, PPTA, PVDF, PES, PEI, PAI, PARA | High-T blends |
*PA-6I, poly(hexamethylene isophthalamide);
†PPTA, poly(p-phenylene terephtalate) and PMTA, poly (m-phenylene terephthalate);
‡PBI, poly[2,2′-(m-phenylene)-5,5′ bis-benzimidazol].
2.2 High temperature polymer blends (HTPBs)
As shown in Table 2.3, plastics can be grouped into four categories according to continuous use temperature (CUT):
Table 2.3
Four categories of amorphous and semi-crystalline polymers
| Category | Amorphous | Semi-crystalline |
| Commodity | PS, PVC, PMMA, ABS, SAN | PP, HDPE, LDPE |
| Engineering | PC, PPE, COC, (cyclic olefin copolymers) | PEX, PVDC, PBT, PET, POM, PA, UHMWPE |
| Specialty | PPSU, PEI, PES, PSU | Fluoropolymers, LCP, PARA, PPS, PPA, PA-6/3 T |
| Ultra | PI, SRP,TPI, PAI, HTS, PBI | PFSA, PEEK, PAEK |
• Commodity (CUT ≤ 75 °C): a category which includes high and low density polyethylenes (HDPE and LDPE), polypropylenes (PP), styrenics (PS), acrylics (PMMA), and polyvinylchloride (PVC). For recycling these resins are identified with a numbered triangle, namely 2 = HDPE, 3 = PVC, 4 = LDPE, 5 = PP, 6 = PS. The category 1 denotes engineering (PET) and all others are marked as 7.
• Engineering (CUT ≤ 140 °C): a category comprising polyamides (PA), thermoplastic polyesters (PEST including PET, PBT), polycarbonate of bisphenol-A (PC), polyoxymethylene (POM or acetal), and poly(2,6-dimethyl-1,4-phenylene oxide), better known as polyphenylene ethers (PPE)
• Specialty (CUT 140 to 240 °C): including, for example, poly-aromatic amides (PARA), polyphthalamide (PPA), polysulfones (PSF, PSU), polyphenylene sulfone (PPSU), polyethersulfone (PES), polysulfides (PPS), liquid crystal polymers (LCP), etc. These polymers show high mechanical performance.
• An ‘ultra’ class of high performing polymers (CUT > 240 °C): including polybenzimidazole (PBI), polyetheretherketone (PEEK), polyimide, polyamide-imide, polyether-imide (PI, PAI, PEI), high temperature sulfone (HTS), self-reinforced polyphenylene ether (SRP), etc.
These CUT limits pertain to neat polymers and may be increased further by compounding with solids and/or blending with another polymer, e.g., PPS has a CUT of 170 °C that increases to 260 °C in reinforced grades. The reason for the change is that CUT, even in semi-crystalline polymers, is limited by Tg, which after compounding may either increase or become less relevant to some aspects of performance. For example, PEEK with Tg = 143 °C and Tm = 340 °C has a CUT under load of 150 °C. However, PEEK reinforced with carbon fiber (CF) has a CUT ≤ 315 °C, at a cost of increased viscosity, density, surface roughness and anisotropy of performance (e.g., weld-lines). An elegant solution is blending, especially if the blend could be made miscible. Good performance has been reported for PEEK blends with another PAEK, as well as with PEI, PI, PSF etc.3,5–7
Sauer et al. described several miscible blends of PAEK with thermoplastic polyimide (TPI).18 Thus, PEK, PEEK and PEKK were melt-blended at T > 400 °C with three TPIs. The blends had lower viscosities and so were easier to process. More recently miscible HTPB are mentioned below. New hyper-branched polyesters of the AB2 and A2B3 type (the subscripts indicate the number of reactive groups), with Tg = 199−268 °C and TGA 10% weight loss at 400−427 °C, were found miscible with semi-aromatic PA6T/6.19
The range of HTPBs is shown in Table 2.2. Jaffe et al. published a comprehensive overview of HTPB. The authors specifically reviewed PBI and LCP blends.20 However, as the technology evolves, new polymers and their blends are being developed with better processability and performance. As an example, in 2011 a patent was deposited for blends with new type of PBI (in 1956 the co-inventor, Allan Hay then at GE, patented the polyphenylene ether, PPE).21 The new polymer, poly(aryletherketone phthalazinone), PAEKP, with Tg = 230−320 °C, may be blended with: PAEK, PAK, PEEK, PEKK, or PBI, thermoplastic-PI, PEI, PAES, PPS, and their mixtures thereof. The compositions have improved high temperature processability and performance. These materials may be molded or extruded into sheets, fibers, foams, tubings, coated articles, etc.
Poly(phthalazinoneethersulfoneketone) (PPESK) is a recent high performance, high temperature resistance polymer, but with high viscosity. However, blends with PEI or PES were found to improve processability and allowed reinforcement with carbon fiber. The blends showed excellent mechanical properties. PPESK was also found to be an excellent basic material for the production of a diversity of membranes with applications ranging from water purification to fuel cell.22–24
In 2006 GE announced a new amorphous TPI, Extem®, with Tg ≤ 311 °C, and high strength, stiffness, chemical and creep resistance at T ≤ 230 °C. The new TPI finds applications in auto, aerospace and military products, down-hole oil and gas production, medical membranes, electrical connectors, electronics for lead-free soldering, semiconductor wafer handling, and specialty films for insulators and flexible circuitry.25
In August 2007 GE Plastics became SABIC Innovative, resulting in further developments in HTP technology. It was found, for example, that Extem® is miscible with PI, PAI, PEI, PEEK or LCP.26,27 For example, its blends with PEI Ultem® show a smooth increase of Tg from about 220 to 311 °C following the Fox equation for miscible blends.28 These transparent or opaque blends may be custom-colored; they show an enhanced combination of performances at T ≤ 311 °C including inherent flame-retardancy, wear resistance, electrostatic dissipative properties, dimensional stability, etc. TPI blends with PEEK are available as the Victrex®-MAX series.29
Replacing a few bisphenol-A links in PC with resorcinol derived esters leads to isophthaloyl and terephthaloyl resorcinol polyester-carbonate (ITR-PC), also known as Lexan SLX.30 This polymer is impact, scratch, flame and weather resistant. Furthermore, it is fully miscible with PEI and, having inherent good flame resistance, is suitable for the manufacture of interior components in the aviation industry.31 Within the full range of composition, Tg = 142−218 °C, and follows the Fox equation with the correlation coefficient r = 0.995. These ITR-PC/PEI blends offered easy processing (melt: T = 290−370 °C; mold: T = 80−150 °C), high temperature capability, dimensional stability, high ductility and significantly improved impact properties over PEI.32 ITR-PC is also miscible with PET, provided that the resorcinol phthalate level ranges from 40 to 80 mol%.33
Modification of PC by copolymerization has been highly successful, resulting in six commercial products with others in development.34 It seems that the strategy was extended to PEI, creating amorphous siloxane-poly-etherimide copolymer (Si-PEI), SILTEM® (see Fig. 2.4), with Tg = 202 °C, 400% elongation at break, flexibility, excellent mechanical performance, high thermo-oxidative stability, and inherent flame and chemical resistance. The material was designed for applications in the aerospace, electrical and electronics, healthcare, and automotive industries. The resin was blended with semi-crystalline PEEK (Tg = 143 °C; Tm = 344 °C), similarly showing good mechanical properties, hydrolytic stability, wear and chemical resistance. The Si-PEI/PEEK blends are fully miscible, their Tg smoothly varies from 143 to approximately 200 °C, have excellent properties (namely tensile elongation to break, high softening temperature, flexibility and good processability), are suitable for injection molding, wire coating, extrusion and uses at high temperature, especially where the inherent flame resistance is required.35,36

Along with new polymers and their blends there is an important progress in the manufacturing technologies, for example incorporation and orientation of nano-filler particles,37 gel-spun ultra-high molecular weight polymers (e.g., Dyneema® HB80 cross-plied unidirectional PE fabrics38, or Innegra S PP fibers with > 90% crystallinity39), or control of orientation/crystallization of rigid-rod or platelet macromolecules, etc.
2.3 Methods of polymer characterization
Metrology is the science of measurement. Measurement is based on national or international measurement standards, usually set by national metrological institutes such as National Institute of Standards and Technology (NIST), National Physics Laboratory (NPL), BAM, NPL-I, etc.40,41 Five independent units of measure are internationally recognized:
These SI (Systèeme International) units are fundamental, the others being based on one or more of these. In addition, the SI recognizes candela (cd = luminous intensity) and mole (mol = number of substance elements corresponding to that of 12C atoms in 12 g). Standards are upgraded as scientific knowledge develops; for example, the current definition of meter is the length of the path travelled by light in a vacuum in 1/(299,792,458) s.
The measurement process should comprise:
(1) sampling the test specimens
(2) selection of the standard test method
(3) calibration-traceability of measurements
(4) statistical evaluation of data
(5) validation by means of reference material, inter-laboratory comparisons, etc.42
Since 1920 numerous national standardization organizations (e.g., Australia – AS/NZS, Britain – BSI, France – NF, Germany – DIN, Japan – JIS, Korea – KATS, Switzerland – SN, USA – ASTM) have been created, followed by the international standards bodies: European – EN, and International – ISO and IEC. The international organizations try to harmonize measurement procedures where possible.
Polymers are organic materials and their properties, starting with atomic composition up to performance of their multiphase systems, are well documented. However, specific standard test methods are often lacking.43 Current test methods may be grouped into three categories, with diverse standard test methods available within each of them. These three categories are:
In the category ‘Determination of molecular composition and structure’, standard test methods are:
• Chemical composition by chemical analysis, spectrometry [Analytical spectroscopic methods ISO 6955; Fourier Transform Infrared Analysis (FT-IR) ASTM E1252], chromatography, microanalysis, microscopy, etc.
• Determination of molecular structures on the nano- and micro-scale, using diffractometry, micrography, spectroscopy, scattering and other methods [ASTM 5017 NMR of LLDPE].
• Surface and interphase characterization by spectroscopy (Auger, X-ray photoelectron, secondary ion mass [Surface chemical analysis ISO 17560; Surface Energy ASTM D5946; Surface Resistivity ASTM D257, IEC60093]), and topographic methods [Surface imperfections ISO 8785].44
• Processability of polymers [Determination of properties of polymeric materials by means of a capillary rheometer ASTM D 3835–02].
In the category ‘Measurement of material properties’, standard test methods are:
• Mechanical: elasticity [DIN 16913–2; ISO 6721; ISO 1798 Plastics; Tensile Test Plastics – Microtensile ASTM D1708, Tensile Test Plastics – ASTM D638, ISO 527; Flexural Test ASTM D790 and ISO 178], plasticity [ISO 899 Plastics creep], hardness [ISO 2039 Plastics hardness], strength [ISO 75 Deflection of plastics], fracture mechanics [ISO 13586 Plastics LEFM], impact [Izod Impact (Notched) ASTM D256, ISO 180; Multiaxial Impact (Dynatup) ASTM D3763, ISO 6603, 7765].
• Thermal: conductivity and specific heat [ASTM D2326 cellular plastics], enthalpy, expansion and compressibility [Thermal Expansion ASTM E831, ISO 11359 ASTM D696; D864 Plastics expansion; Compression Set ASTM D395; Compression Test ASTM D695, ISO 604], thermogravimetry [Compositional Analysis by TGA ASTM E1131, ISO 11358], dimensional stability [Dimensional Stability ASTM D1204]
• Electrical: conductivity and resistivity [ISO 21318 for plastics; Volume Resistivity ASTM D257, IEC 60093], dielectric [Dielectric Constant/Dissipation Factor ASTM D150, IEC 60250; DIN 53483; EN 60811 Insulating materials; Dielectric Strength ASTM D149, IEC 60243], etc.
• Magnetic [EN 62044 Measurement methods].
• Optical: optical sensing, fiber optics, non-linear optics, optical measurements [ISO 3146 Plastics measurements in polarized microscope].
In the category ‘Materials performance’, standard test methods are:
• Chemical aging, weathering and stabilization [Thermal Stability ASTM D3835, ISO 11443; Artificial weathering ISO 29664; QUV Accelerated Weathering ASTM D4329, D4587, ISO 4892, SAE J2020; Loss of plasticizers ISO 176, ISO 177], oxidation [Thermo-oxidative Stability ASTM D3012, GM9509P], hydrolysis [Water Absorption ASTM D570], accelerated aging [ISO 188 Accelerated Aging], flammability [ASTM D635, ISO 3795, 49CFR-571–302; Oxygen Index ASTM D2863].
• Physical aging [ISO 291:2008 Plastics – Standard atmospheres for conditioning and testing; ISO 877].
• Biogenic effects [Fungus resistance JIS Z 2911PP and PE degradation ASTM D3826; Antibacterial activity ISO 22196; Aerobic degradation of plastics ASTM D 5271, ASTM D 5511, ASTM D 5512, JIS K 6950, JIS K 6951, JIS K 6953].
• Environmental impact [Plastics exposed to solar radiation, heat and light ISO 2578 and ISO 4892, ASTM D 5272].
• Performance monitoring and control [Environmental stress cracking (ESC) ISO 22088; Non-destructive testing by ultrasound DIN EN 12668, ISO 10375].
Evidently, within each of the three test categories there are also standard procedures for testing specific polymers (e.g., PE [ASTM D3035], PP [ISO 1972; ISO 1873] or PVC [ASTM D3036]), or methods for carrying out specific types of test, e.g., Microbeam Analysis (MA):
• ISO 22309:2006 MA – Quantitative Analysis using EDS
• ISO 16700:2004 MA – Scanning Electron Microscopy (SEM) – Guidelines for Calibrating
• ISO 15632:2002 MA – Specification for Energy Dispersive X-ray Spectrometers
• ISO 14595:2003 MA – Electron Probe Microanalysis – Guidelines for the Specification of Certified Reference Materials (CRMs)
• ISO 14594:2003 MA – Electron Probe Microanalysis – Guidelines for the Determination of Experimental Parameters for Wavelength Dispersive Spectroscopy
• ISO/WD2 24173 MA – Guidelines for Electron Backscattered Diffraction Analysis.
Short descriptions of most of the aforementioned standards can be found on the internet.45
2.4 Characterization of polymer blends
Polymer blends are mixtures of at least two macromolecular substances. They may belong to the same chemical family (e.g., low and ultrahigh molecular weight PE) or to different ones (e.g., PP/PA-6). The former are known as homologous, the latter heterogeneous polymer blends. At a given set of independent variables, e.g., temperature (T), pressure (P), concentration (x), blends are either miscible or immiscible, i.e., they form one phase or several. The definition of miscibility is based on the thermodynamic free energy of mixing, ΔGm, and the heat of mixing, ΔHm.3,7 Polymers can be categorized as follows.
• The miscible polymer blend is homogeneous down to the molecular level, has a negative value of ΔGm ≈ ΔHm ≤ 0, and a positive second derivative ∂2ΔGm /∂φ2 > 0. The immiscible blend has a positive value of the free energy of mixing: ΔGm ≈ ΔHm > 0.
• Polymer alloys are immiscible, compatibilized blends with modified interface and morphology.
• Interphase is the third phase in binary polymer alloys (Δl = 2 to 60 nm thick), engendered by inter-diffusion of the macromolecular components and/or compatibilization.
• Compatibilization modifies the immiscible polymer blend interphase, reducing the interfacial energy and stabilizing the blend morphology.
The above four terms define the key differences between a polymer and PAB. The specific tests developed for the characterization of polymer blends focus on the detection of miscibility, construction of phase diagrams, evaluation of compatibilization and the characterization of interphase.
The commercial nomenclature is not as precise as the scientific one. A polymer is rarely labeled as a blend or an alloy, unless the concentration of the minor component exceeds the locally accepted limiting concentration. For example, ‘toughened’ PC may be called a blend when the elastomer content exceeds 5 or 45 wt%. Evidently, these products are blends and should be treated as such.6
Standard test methods specific to polymer blends do not exist. PABs are tested using the standard procedures developed for polymers or composites. For example, the international standards do not discuss thermodynamic miscibility. There are two standards tests of ‘compatibility’, a term sometimes substituted for miscibility. However, chemical compatibility tests [ASTM D 543, ISO 4599] refer to evaluation of plastics’ resistance to chemicals – tests similar to that for the Environmental Stress Cracking Resistance, ESCR [ASTM D1693, IS22088].46 Another compatibility test was designed for detecting the effects of other materials (solvents, coatings, solids) on crazing and cracking of PC [EIA 564–1992]. Again, the test has little to do with the determination of thermodynamic miscibility.47
All liquids, single or multicomponent, are heterogeneous in terms of the density fluctuations function; thus the miscibility is defined mathematically by ΔGm < 0, but operationally one likes knowing which size of heterogeneity, dd. Silberberg and Kuhn proposed that in miscible blends the size of heterogeneity should not exceed that of the radius of gyration: dd ≤ ![]() s2
s2![]() 1/2 ≈ 3–10 nm.48 The customary scattering methods for detecting miscibility are applicable above that limit, dd ≥ 15 nm.17
1/2 ≈ 3–10 nm.48 The customary scattering methods for detecting miscibility are applicable above that limit, dd ≥ 15 nm.17
Traditionally, turbidity or opacity has been used for detecting the cloud-point curve (CPC), which approximated the bimodal of the phase diagram.49 Evolution of this approach involved application of laser light scattering, which combined with small specimen size and precise temperature control led to the pulse-induced critical scattering (PICS) for spinodal determination. Unfortunately, the method is limited to the size of heterogeneity > 100 nm and the difference in refractive index of the two phases > 0.01.50,51
The plot of the glass transition temperature, Tg, vs. composition has been frequently used as an unsophisticated test of blend miscibility. However, Tg is insensitive when the amount of the second component is less than about 10 wt% and/or when Tg values of the blend components differ by less than 20 °C.3 Furthermore, it is to be noted that Tg is more sensitive to the degree of dispersion than to the thermodynamic miscibility of the components.52
Recently the Atomic Force Microscopy (AFM) showed that in a single-component molten PS below the crossover temperature, Tc, there are solid dynamic aggregates with diameter d ≈ 4–40 nm.53 Since on the one hand blend miscibility has been postulated on the basis of a single Tg, and on the other hand the presence of a single Tg has been detected when the degree of dispersion d ≤ 15 nm, the presence of such aggregates in neat PS blends makes detection of miscibility by the Tg method ambiguous. A better measure of blend homogeneity is the width of Tg peak at half-height, ΔTg. Its value in homopolymers, miscible blends and immiscible blends near the spinodal curve are, respectively: ΔTg = 6, 10 and 32 °C.
The advanced scattering methods, such as high resolution nuclear magnetic resonance techniques (HR-NMR), the NMR-spin diffusion, non-radiative energy transfer, excimer fluorescence, thermally stimulated depolarization current, small angle neutron scattering, SANS and FT-IR, are more appropriate for the task. For example, the NMR spin-lattice relaxation times, T1, distinguishes dd ≥ 2 nm and it may be used for either molten or solidified specimens:54
• a-PVC/PMMA: homogeneous at 20 nm, but heterogeneous at 2 nm, but a-PVC blended with deuterated d-PMMA was miscible, dd ≈ 1–2 nm;
• PS/PVME, poly butyl methacrylate (PnBMA)/PS (2 mol%-OH): homogeneous at 20 nm;
• SAN/PMMA: homogeneous at 20 nm, but heterogeneous at 2–15 nm;
• a-PET/PC, a-PVDF/PMMA, and a-PCL/PVC: homogeneous at 2 nm.
In addition to the direct experimental methods of miscibility detection, there are several fundamental approaches useful for predicting or justifying miscibility/non-miscibility of a given blend. For example, ΔHm was used by Paul and Barlow for predicting blend miscibility:55
The Huggins–Flory type segmental, binary interaction parameters, Bij, are tabulated.56 A similar approach, based on the Hildebrand solubility parameters (∂), calculates ΔHm from the high pressure dilatometry (PVT) data.57
Atomistic calculations of the interaction energies and enthalpies of mixing for PAB modeled by realistic pair configurations of two polymer fragments may predict the specific interactions from tabulated force field constants.58–60 The diverse atomistic simulations of blend energies of mixing are powerful tools for predicting a host of diverse properties, including miscibility.61 The simulation results depend on the selected procedure and completeness of the energetic contribution. For example, the recent simulation of a 1:1 blend of poly-N-vinyl-pyrrolidone (PVP) and poly(bisphenol-A-ether-sulfone) (PES) with a COMPASS (condensed-phase optimized molecular potentials for the atomistic simulation studies) force field expressed the total energy of the system as a sum of seven bonding and non-bonding interactions.62,63
The statistical mechanical Polymer Reference Interaction Site Model (PRISM) also predicts structure and phase diagrams of polymer blends.64,65 The theory involves computations of the system structure by means of the probability density function, which describes the location of all N particles of the system. The computations include enthalpy, as well as the combinatorial and non-combinatorial entropy effects. Over the years RISM has been applied to progressively more complex liquids, from mono-atomic to multi-atomic molecules, then to polymers and their blends. PRISM requires less computing time than atomistic simulations, incorporating structural details of polymeric molecules (e.g., bond lengths, angles, chain conformation, different interaction potentials), which lattice models are unable to account for PRISM results of polymer blends are well correlated with the small angle neutron scattering (SANS) and light scattering (LSc) experimental data.56
2.5 Characterization of HTPBs: chemical constitutions and molecular weights
Table 2.4 provides an abbreviated list of methods used for characterization of polymer blends, starting with determination of molecular structure and interactions and ending with determination of the crystallinity and flow-imposed orientation. The methods are general – their adaptation to HTPBs may require modification of equipment (e.g., high temperature cell for FT-IR or special heating oven for rheology of PEEK).
Table 2.4
Characterization of polymer blends
| Method | Molecular structure interactions | Miscibility | Surface and interphase | Phase separation | Crystal structure | Orientation | |
| Scattering | SANS | E | E | G | G | E | E |
| SAXS | E | E | G | E | |||
| SALS | G | G | F | ||||
| Microscopy | TEM | G | G | E | E | E | |
| SEM | F | G | G | G | G | ||
| PCM | F | F | F | F | F | ||
| PM | F | F | E | G | |||
| Relaxation | NMR-pulsed | G | E | G | G | E | F |
| Rheology | F | F | F | G | G | G | |
| Dynamic mech. | G | G | G | F | |||
| Dielectric spect. | G | ||||||
| Thermal analysis | DSC, DTA | F | E | F | G | G | G |
| TOA | G | F | F | G | |||
| TSC | G | G | G | ||||
| Spectroscopy | FT-IR | E | F | G | G | G | |
| HR-NMR | E | E | F | G | G | ||
| ESCA | G | E | E | ||||
| SIMS | E | E | |||||
| Fluorescence | F | ||||||
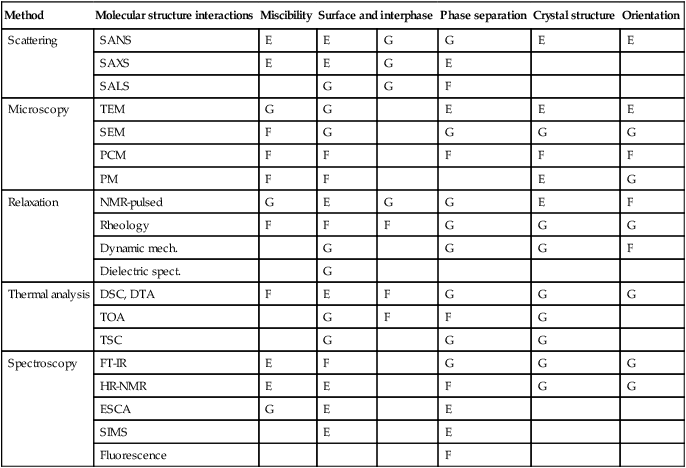
Notes: E = excellent; G = good; F = fair; SALS, small angle light scattering; PCM, polarized contrast microscopy;TOA, thermal oxidative analysis. Other abbreviations are listed in Section 2.12.
Source: T Nishi, J. Appl. Polym. Sci., 79, 192 (1993).
There are two aspects in the characterization of polymers and their blends: (1) chemical constitution, (2) molecular weight (MW) and its distribution (MWD). Identification of the chemical constitution is conducted by the manufacturer and rarely performed by the industrial or academic users. The exception may be the determination of fine isomeric sequences (e.g., in polyolefins, PO), identification of tactic content (for example in PVC), or identification of end groups (e.g., in PA, PEST, or PO). The applied analytic methods include FT-IR, SANS and pulsed nuclear magnetic resonance (NMR). These may be combined with pyrolysis, followed by chromatogra-phy and mass spectrometry (MS). For the users of HTP, the most pertinent information is how the polymeric structure, MW and MWD, changes with time.
Quantitative NMR (e.g., 1H NMR and 13C NMR spectroscopy) has been used for determining monomer/co-monomer composition, polymeric structures and impurities down to 0.1−0.01%. For enhanced resolution of 13C spectra inverse-gated 1H decoupling may be used. A 500 MHz NMR instrument at T = − 80 to + 150 °C is suitable for analyzing polymers in solution, e.g., PE or PP dissolved in 1,2,4-trichlorobenzene and analyzed at 130 °C. ASTM D5017−2009 recommends using 13C NMR spectroscopy for determining impurities or co-monomer ratios of linear low density PE (LLDPE).
Historically, the following methods have been used for measuring MW and MWD:
• size exclusion (or gel permeation) chromatography, SEC or GPC;
• viscometry (intrinsic viscosity: [η]);
• mass spectroscopy (including the matrix assisted laser desorption, MALDI);
• end group analysis (chemical and spectroscopic methods);
• colligative properties (boiling point elevation, depression of freezing point, osmometry);
As will be discussed in Chapter 3, HTPs are often employed in severe environments; thus their structure, MW and MWD, may alter their performance. The polymers and their blends may degrade by either reducing the average MW, or increasing it by branching or crosslinking. For example, PS has been known for over a century for its ability to depolymerize into styrene, whereas most elastomers are known for crosslinking. These effects may be followed by the dynamic melt flow, or viscoelasticity measurements. The decrease of loss modulus (dynamic viscosity) suggests depolymerization or chain scission, whereas increase of the storage modulus (dynamic elasticity) indicates branching, which eventually leads to crosslinking. Thus, the dynamic rheology may be used as an indirect measure of MW and MWD.
During the last two decades, there was a concerted effort for predicting flow behavior from MW and MWD and vice-versa, calculating the two molecular parameters from rheology.66–70 In that work, invariably the parameters calculated from rheology were compared with those obtained directly from SEC (previously known as GPC).71 SEC (introduced to polymers by Claesson and Claesson in 1944) belongs to liquid chromatography methods, where an injected solution of polydispersed polymers is separated by macromolecules being entrapped in pores of porous gel particles (e.g., crosslinked PS) – the smaller the molecule the deeper it penetrates and the longer it stays in the column. SEC in combination with low-angle laser light scattering (LALLS) and/or solution viscometry determines the MW and MWD as well as the degree of long chain branching of a polymer.72–75
The development of the solution viscosity theory76 relates the coil volume to intrinsic viscosity:77–79
opening the possibility of determining the viscosity-average MW (Mv) of the dissolved polymer. Its fractionation into narrow-MWD fractions, followed by determination of [η] each, resulted in the early determination of MWD curves.80–82 In Equation [2.2], [η] is the intrinsic viscosity and K and a are constants, whose values depend on the nature of the polymer, solvent and temperature.
An inverted variant of SEC, the temperature rising elution fractionation (TREF), has been developed for determining the short chain branches population distributed over the various molecular weights.83 Polymer heterogeneity is not only represented by the distribution of chain lengths (MWD), but also by tacticity, presence of branched and cross-linked structures and, in the case of copolymers, by differences in chemical composition. Thus TREF was developed for examining how the diverse heterogeneities superpose on the MWD. It is a technique for analysis of crystalline and semi-crystalline polymers by separating the fractions according to crystal-lizability.84 The molecular elution during the test depends on the melting of semi-crystalline polymers in the presence of a solvent. The customary detectors are infrared, light scattering and a capillary viscometer. Thus, by contrast with SEC, in TREF fractionation takes place by melting and dissolution. Newer versions of TREF are preparative (PTREF) and analytical (ATREF), the latter applicable for analyzing blends of crystallizable polymers.85
Several types of extractors and test strategies are used for characterization or purification of a variety of polymeric materials, including copolymers, blends, nano-composites, etc. For example, the Kumagawa extractors have been used for elimination of the low molecular weight fractions.86 The special thimble holder is surrounded by solvent vapors at a higher temperature than that in Soxhlet; thus this extractor is better suited for removal of low molecular weight impurities from HTP.87 Vandenburg et al. published a critical review of old and new extracting methods, including precipitation from solution, the use of Soxhlet-type extractors, the supercritical fluid extraction (SFE), microwave-assisted extraction (MAE), accelerated solvent extraction (ASE), sonication-assisted extraction, etc.88 The methods vary in the extraction time (from 15 min up to 24 h), range of application and the development stage. The extracted substances are: monomers, dimers, trimers, plasticizers, industrial additives, stabilizers, etc.
The inverse gas chromatography (IGC) also involves deposition of polymers or their blends on solid support and probing with suitable solvent vapors. The method, first described by Kiselev in 1967, has been used in blend technology for characterizing the polymer-polymer and another type binary interactions.89–93
Reed and coworkers developed a strategy for automatic continuous online monitoring of polymerization (ACOMP).94,95 The method may be used during the initial development of the polymerization process, its optimization and monitoring of the continuous reaction. ACOMP automatically dilutes samples from the reactor and measures its properties, e.g., refractive index, near infrared (NIR) spectra, LSc, [η], etc., from which it computes evolution of MW, MWD, degree of conversion, copolymer composition (in copolymerization) and others. The method has been applied to a variety of the free radical homo- and co-polymerizations, including the reactions in emulsion or suspension.96–98
2.6 Characterization of HTPBs: chemical-, thermal-, mechanical- and radiation-induced degradation
Polymer’ degradation may be categorized according to the degrading agent as:
• chemical (e.g., oxidation or hydrolysis);
• mechanical (e.g., by ultrasonics or during processing);
• radiation (ultraviolet, visible light, nuclear or cosmic rays, atomic oxygen, etc.).
Since HTPs are often used under severe conditions (temperature, T, pressure, P, irradiation, Q, stress, σ, and their combinations), their structure, MW and MWD, change with the lifetime. The process may lead to the reduction or increase of MW, erosion, etc. Several mechanisms have been identified for either effect, and stabilization methods are constantly upgraded.99,100
2.6.1 Chemical degradation
The chemical degradation takes place when a polymer is exposed to reacting fluids, such as gaseous O2, O3, Cl2, H2S, H2O, etc. In polymers with carbon-carbon backbone, oxidation is the principal chemical degradative mechanism that results in formation of peroxides and/or hydroxy peroxides, chain scission and accompanying it the free radical grafting (which may be absent in high vacuum). Polymers with tertiary carbons (e.g., PP or linear low density PE, LLDPE) oxidize readily; for PO the process is autocatalytic.101
It is noteworthy that O2 dissolves in polymers to a rather large depth, namely 10 mm in PP.102 Repeated re-extrusion of polystyrene (PS) in a twinscrew extruder (TSE, under nitrogen) each time reduced its MW by around 10%. The reduction was not related to the level of stresses in TSE and, since in a rheometer the dynamic properties were constant with time, the observed effects could only be explained by the presence of absorbed oxygen, O2, in the pelletized polymeric compounds – once the resident oxygen was consumed, the compound became stable.103 Thus, oxygen dissolution in polymers is a common phenomenon, expected in amorphous or mesocrystalline regions. Polymers with double-bonds readily suffer degradative oxidation and ozonolysis, crosslinking by sulfur, etc. Oxidation is also present in PA, PEST or poly-glycols such as polyethylene glycol (PEG), but in these cases the hydrolysis dominates.
Hydrolysis may be treated as de-polymerization, in which water molecules peel off molecular fragments, e.g., for polyester: R1 CO2R2 + H2 ![]() R1CO2H + R2OH. However, since the reaction is a reversible one, condensation and hydrolysis take place at the same time and the equilibrium is determined by the concentration of products on both sides of the equation. In polymer processing, hydrolysis of the condensation polymers, e.g., PA, PC, PEST, occurs during high temperature processing, namely extrusion or injection molding.104 To prevent their loss of performance these polymers must be dried before processing to the maximum acceptable level of moisture for the given polymer, e.g., 0.2 wt% or 2000 parts per million (ppm) for PC, 1000 ppm for PA-6 and PA-66, 400 ppm for PBT, 30 ppm for PET, etc.
R1CO2H + R2OH. However, since the reaction is a reversible one, condensation and hydrolysis take place at the same time and the equilibrium is determined by the concentration of products on both sides of the equation. In polymer processing, hydrolysis of the condensation polymers, e.g., PA, PC, PEST, occurs during high temperature processing, namely extrusion or injection molding.104 To prevent their loss of performance these polymers must be dried before processing to the maximum acceptable level of moisture for the given polymer, e.g., 0.2 wt% or 2000 parts per million (ppm) for PC, 1000 ppm for PA-6 and PA-66, 400 ppm for PBT, 30 ppm for PET, etc.
2.6.2 Thermal degradation
A good introduction to this topic is provided by Beyler and Hirschler, with a short introduction to polymers and their properties.105 Thermal degradation/stability has been studied by several methods, namely TGA, differential thermogravimetry (DTG), thermal volatilization analysis (TVA), differential thermal analysis (DTA), differential scanning calorimetry (DSC), pyrolysis gas chromatography (PGC), thermo-mechanical analysis (TMA), and others. Furthermore, the positron annihilation lifetime spectroscopy (PALS) was found useful for the thermal degradation studies of PE. PE films exposed to T = 100 °C for t ≤ 30 days showed significant reduction of the o-positronium formation caused by the thermal oxidation of PE. The method is sensitive to degradation of PE and other nonpolar polymers and their blends.106
McNeill and Rincon studied thermal degradation of PC by means of TGA, TVA, DSC, FT-IR, mass spectrometry (MS) and gas chromatography–MS (GC-MS) method (see Fig. 2.5). PC is stable up to 300 °C.107 Above that temperature, small quantities of phenol and p-cresol were detected, at 375−400 °C CO2 appeared and then at T > 455 °C CO and CH4 were formed; the peak on the DTG curve was at T = 462 °C. At 500 °C the main products are cyclic dimer and bisphenol A, with small quantities of CO2., p-cresol, p-ethyl phenol, phenol, p-vinyl phenol, p-isopropyl phenol, CO and CH4. In the absence of air and moisture, degradation of PC proceeds by hemolytic decomposition of the polymer chain, radical reactions, fragmentations and molecular rearrangements.

However, PC degradation is also sensitive to the presence of oxygen and water. Accordingly, there are patents on stabilization of PC against thermal as well as hydrolytic degradation. The thermally stable PC composition might contain a dioxane phosphate (prepared in reaction between tri-phenyl phosphate with a 1,3-dioxane and phenol),108 or a sulfone compound (of the general formula: R1-SO2-CHR2R3 . including polymers with sulfonyl groups).109 Both these stabilizers belong to the peroxide decomposer category. The patent for hydrolytically stable PCs specifies addition of a stabilizing compound selected from epoxy silanes, epoxy siloxanes or their blend.110 The stabilizer of a general formula: ZnSiR4-n, (where Z is epoxy radical and R is hydrogen, alkyl or aryl radical) is added in the amount of 0.005 to 2 wt%. For good color stability the PC formulation should also contain an organophosphite.
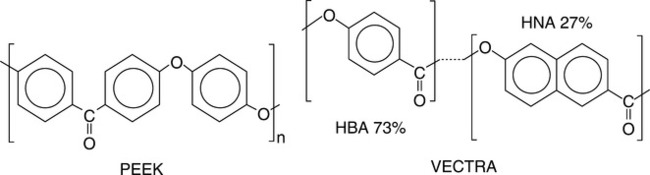
The most frequently used is TGA at constant temperature or heating rate of q = 5−20 °C/min in vacuum, air or inert gas.111 The degradation process has been described taking into account the reactions: (i) initiation by random chain scission, (ii) depropagation, and (iii) chain termination.112 TGA is an integral part of synthesis and characterization of HTP and their blends. For example, developing new isomeric polythioetherimides (PTEI),113 polyamides based on s-triazine,114 polyaryletherketones (PAEK)115 or polyimides (PI)116,117 and their nanocomposites118 invariably involved determination of thermal stability by TGA or its differential version. Naffakh et al.119 studied the thermal decomposition of PEEK blends with a thermotropic Vectra® LCP, using dynamic TGA and calculating the activation energies of the process. The molecular structure of the polymeric constituents is shown in Fig. 2.6. Compared to neat components the blends were found to be less stable. In PEEK/LCP = 85/15 wt/wt degradation of the former high melting point component was accelerated by the latter. The FT-IR indicated that in blends the degradation rate was higher, but the mechanisms remained the same.
While PC is stable up to 300 °C many polymers that are blended with it decompose at lower temperatures.120 For example, the miscible blends of PC with PMMA were studied by TGA, TVA and DSC. During thermal degradation of the blend the volatiles were the same as those from component degradations, the rate of PC degradation increased while the PMMA depolymerization was retarded by around 10 °C. The results suggest that PMMA radicals accelerate chain scission of PC while PC retards PMMA degradation. The PC/PMMA blend is unique for the reaction between a macro-radical and a macromolecule, which are seldom observed during degradations of immiscible blends.
PC being polyester may also undergo trans-reaction with another polyester, polyester-amide or polyamide. Lin and Yee studied such reactions in blends of a liquid crystalline copolyesteramide (LCP, Vectra® B950) with PC or PET.121 Due to transesterification, the PC/LCP blends were slightly miscible, with miscibility increasing with time and temperature, T < 340 °C. The trans-reaction also reduced LCP crystallinity. The DSC-determined decomposition temperature of LCP/PET blend was about 400 °C. The exchange reactions between LCP and PC or PET improves the interfacial adhesion in these immiscible blends; thus they may be used for in situ formation of compatibilizing copolymers. The reactions are rather slow and need to be accelerated by, for example, an ionic catalyst.
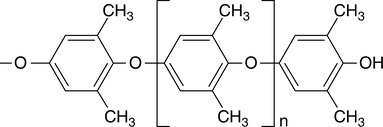
Evidently, all reactants in polymer blends contribute to thermal degradation/stability, but it is not a priori evident how they will affect each other. For example, PVC stability was poorer in its blend with polyvinyl acetate (PVAc) than without it.122 TGA of PP, PE, polyvinylidenechloride (PVDC), and polyacrylonitrile (PAN), as well as of their blends, were carried out. Comparing with neat PP its blends with PE had higher thermal stability, in contrast to the results for PVDC with PAN.123 Syndiotactic polystyrenes (sPS) were solution blended with PPE (Fig. 2.7), co-precipitated, and then compression molded. DSC indicated a partial crystallization of sPS and some miscibility in the amorphous phase.124 TGA (at q = 10 °C/min) and FT-IR spectroscopy were used for following the structural changes on heating. Degradation of the three molecular weight sPS resins was similarly initiated by chain scission. In the blends, degradation of sPS started at higher temperature by 10−20 °C, indicating stabilizing effects of PPE, but in turn degraded faster in the blends than in the neat state. FT-IR identified the structural changes of PPE molecules at T = 250−400 °C as breakage of the ether link followed by H-abstraction from the methyl, which results in an increase of the –OH group concentration. Since sPS degradation and PPE rearrangement occurs at the same T, it seems that the latter polymer is a radical acceptor, slowing the degradation of sPS. This cross-termination process limits the PPE rearrangement and consequently reduces the ultimate stability of that polymer.
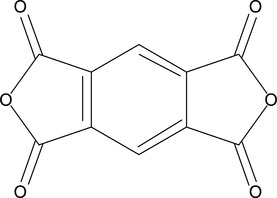
Bacosca et al. synthesized a series of aromatic PI with cyano-groups, by polycondensating aromatic di-amine having cyano and ether groups, with either flexible or rigid aromatic di-anhydride.125 The flexible polymers were soluble in polar organic solvents and easily formed into films with high thermal stability. Their Tg = 210−260 °C and the initial decomposition temperature, Tdecomp > 400 °C, increased with the increase of the chain rigidity. The rigid PI, based on pyromellitic di-anhydride (PMDA, see Fig. 2.8) had Tg > 250 °C and it was insoluble.
2.6.3 Mechanical and thermomechanical degradation
It is no surprise that a combination of different agents that cause polymer instability increases the degradation rate. For example, the presence of heavy metals (left behind catalyst or brought in with, for example, clay nano-particles) enhances photo- or thermo-oxidative degradation.126 Dynamic flow behavior of the polymeric nanocomposites (PNC) with either PS or PP matrix showed that during time sweep in a rheometer (under a blanket of N2) the storage and loss shear moduli (G′ and G″, respectively) were constant, indicating thermal stability. However, each re-extrusion in a TSE under N2 reduced MW of the matrix polymer by around 10%. The reduction was not related to screw configuration or speed. These seemingly conflicting results could only be explained by the presence of absorbed oxygen, O2, in the pelletized polymeric compounds – once the resident oxygen was consumed, the compound became stable.103,127,128 Data analysis showed that the principal degrading agent was absorbed O2 activated by shear and temperature.
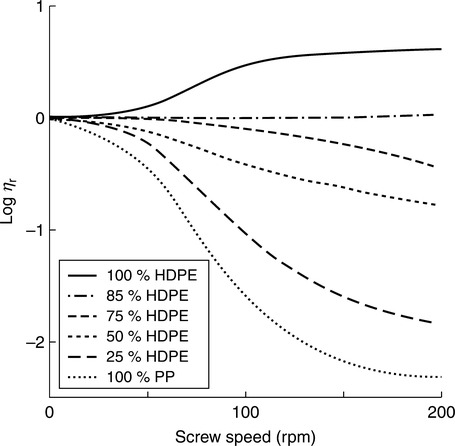
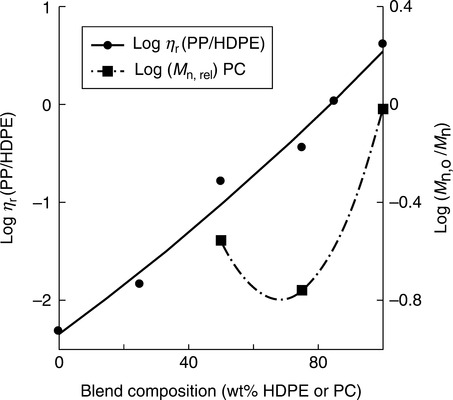
When studying the effects of the mechanical stress on polymer degradation, it is difficult to separate the mechanical effects from the thermal effects.129 So most publications on the subject discuss these two factors together as the thermomechanical process. Several key publications on the thermomechanical behavior of PAB came from the Università di Palermo. For example, in high density PE (HDPE) blends with PP the chain scission of PP molecules dominated composition with more than 20 wt% PP, whereas below that limit branching of HDPE overpowered these effects. 130 Figures 2.9 and 2.10 compare the effect of composition on the degradation process. As is evident, blending of two POs, PE and PP, at constant T and screw speed indicate a mild, if any, binary influence on degradation, but the situation is dramatically different in blends of PA-6 with PC. In this case, the presence of around 35 wt% PA-6 causes maximum degradation of PC. The effect may be caused by transreaction, catalyzed by the presence of H2O.
La Mantia and Mongiovi studied the thermomechanical degradation of PA-6/PP blends without and with a compatibilizer.The degradation depended on the compatibilizing functional group. Thus, degradation was worse in the presence of acrylic acid (AA) then maleic anhydride (MAH) groups on PP. In other words, compatibilization and degradability inseparably influenced each other. In the case of PA-6/PP-g-AA blend the compatibilization (and degradation) decreased with mixing time, caused by the shear effects on the PP-PA-6 copolymer. Blends with PP-g-MAH showed relatively good resistance to thermomechanical degradation and better performance than those with PP-g-AA. The binary PA-6/PP blends initially showed improved properties, which decreased with mixing time, which reduced MW.131
2.6.4 Degradation by radiation
Polymers, their blends and composites may be exposed to radiation during radiation processing, or when exposed to irradiation (e.g., irradiative sterilization, exposure to radiation in space, exposure to radiation during wire coating).132 In space (hard vacuum and cold) the radiation may lead to mass loss (progressive surface erosion). However, in inert atmosphere, irradiation may cause crosslinking, degradation or both.
• Crosslinking: PA, PE, PEG, PEST, PP, PS, polyacrylates, polyacrylamides, polysiloxanes, rubbers, and so on.
• Degradation: polyisobutylene (PIB), poly(α-methyl styrene), polymethacrylates, polymethacrylamide, polytetrafluoroethylene (PTFE), and so on.
Since irradiation leads to chain scission and formation of free radicals, in the presence of O2, it leads to the formation of peroxides, which further accelerate the degradative effects.
The radiation affects the miscible and immiscible polymer blends differently.133,134 Whereas in the former case the effect is similar to that encountered by individual homopolymers, in the latter it may be used for improving compatibility, and thereby the performance of blends or for stabilization of their morphology by a radiation crosslinking. PP is particularly sensitive to irradiation, which makes it discolored and brittle. However, the behavior may be improved by blending PP with polybutylene (PB), then quenching into tough and radiation-resistant non-crystalline alloy.135
A large volume of literature exists for PO blends with easily crosslinkable elastomers, but the information on radiation processing and degradation of HTPB is scarce. For dimensionally recoverable applications a blend of LCP with PVDF or PE was radiation crosslinked.136 Similarly, PSF or PES was blended with water-soluble PVP and crosslinked to make it water insoluble for medical or food applications.137 For the use in cable jackets and heat-shrinkable applications PVDF or a copolymer of tetrafluoroethylene and ethylene (ETFE) could be compounded with a thermoplastic elastomer, formed and radiation crosslinked. Adjusting composition and irradiation dose produced a series of materials with good balance of tensile strength and elongation.138
Sterilization of PC by irradiation causes yellowing and loss of performance. Analysis of gases generated during irradiation showed the presence of gases: CO > CO2 >> H2 >> CH4 > benzene, as well as phenolic and salicylic esters coupling by-products. The process engenders Fries-type free radical reactions that affect the sensitive carboxylic groups.139 However, the UV stability of PC may be significantly improved if during its synthesis aliphatic and aromatic ester glycols are incorporated into the PC chains.140 Another patent on a production of γ-radiation-resistant PC disclosed incorporating of disulfide linkages (0.02 to 2%) into the main chain, side or terminal groups.1141 The presence of the disulfide bisphenol improved the resistance to discoloration caused by γ-rays. The resulting PC-disulfide resin may be used directly for molding radiation-resistant articles or as a stabilizing additive for neat PC. Another patent described incorporation into PC macromolecules 0.01 to 1.0% of benzofuran and 0.01 to 1.0% of saccharine.142 This modified PC has good resistance to degradation by γ-radiation as evidenced by reduced yellowing. The new material is suitable for medical devices.
PC exposed to neutron irradiations with the incident energy in the range of 0.8−19.2 MeV degrades by the free radical processes that lead to yellowing, crosslinking and embrittlement. The process was followed by FT-IR, X-ray diffraction (XRD), solution viscosity, refractive index and color change studies. The FT-IR showed that in the energy range of 2.3−19.2 MeV crosslinking dominates increasing [η] (from 0.41 to 0.68) and refractive index.143 The yellowing could be reduced by blending PC or its copolymers with poly(cyclohexane terephthalate-glycol), PCTG. These well-processable, miscible blends (e.g., Ektar® DA for garden, floor care, appliances, medical equipment) are transparent, resistant to UV, neutron and γ degradation and have good chemical resistance.144,145
The Industrial Applications and Chemistry Section of the International Atomic Energy Agency published a series of articles on stability and stabilization of polymers and their blends and composites.146,147 Most of the articles there discuss degradation mechanisms and stabilization methods for commodity polymers and their blends. The exception is the work by Sun and Zhong on γ-irradiation crosslinking of fluoro-polyimide (FPI).148 The authors reported that the reaction resulted in an increase of Tg, the tensile strength, the elongation at break, resistance to hot water as well as to subsequent irradiation. The X-ray photoelectron spectroscopy (XPS, also known as ESCA) showed that during radiation crosslinking the concentration of the terminal -CF3 groups decreases, suggesting defluorination. Similarly, PTFE may be radiation-crosslinked at high temperature for better performance and radiation resistance. It is noteworthy that irradiation of the same polymer may result in chain scission or crosslinking – the key is the temperature:
• at T < Tg irradiation reduces MW and reduces performance;
• at T > Tg branching and crosslinking increases MW and improves performance.
The effect is related to chain flexibility. Accordingly, miscible blends of rigid with flexible backbone polymers improve the radiation resistance, namely, blending two fluoro-co-polymers or PMMA with PEG or with PVDF yields radiation-resistant blends.
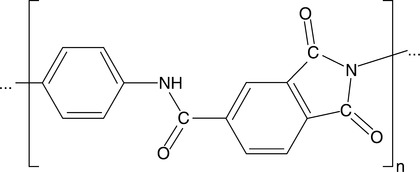
Alvino studied the stability of two PIs and PAI exposed to ultraviolet (UV) irradiation in wet or dry environment.149 The films were UV-irradiated (290–400 nm) for 125 and 250 days, respectively. The PIs were found to be more stable than PAI, but the latter was less susceptible to hydrolysis. The three polymers were more sensitive to UV in the wet than in a dry state. The degradation affected the elongation at break more than the tensile strength. By contrast, the electrical properties of dry PIs were unaffected by UV exposure at least up to 250 days while PAI begin to deteriorate after 167 days of exposure. The structure of a PI and a PAI are shown in Figs 2.11 and 2.12.

Hill et al. simulated low Earth orbit (LEO) radiation effects on PI films of different molecular structures, studying UV degradation in air and under vacuum.150 The process was followed using UV-visible, FT-IR, electron spin resonance (ESR), and XPS spectroscopies. The UV-visible spectrum showed a blue shift relative to Kapton, caused by the structural disruption of a charge-transfer complex. The UV irradiation also resulted in an ablative surface degradation with intact central part of the PI films. Irradiation in vacuum caused formation of stable carbon-centered radicals, while that in air produced oxygen-centered radicals of peroxy and/or alkoxy type; XPS indicated the surface oxidation accompanied by aromatic rings opening and loss of low molecular weight oxidized carbon species.
2.7 Stabilization of HTPBs
Stabilizers are chemicals used for maintaining the polymer’s strength, flexibility and toughness during their processing and life-time; thus they should preserve the polymer’s original molecular structure. In other words, stabilization aims to retain the original molecular architecture in spite of the effect of heat, stress, chemical environment and irradiation. Stabilizers are classified as:151
• primary antioxidants (AO1) – phenolic or 2,6-di-tert-butyl-4-methylphenol (BHT) type;
• secondary antioxidants (AO2) – phosphites, phosphonites, sulfur compounds;
• metal deactivators or complexing agents;
• Ni-quenchers or hydroxyperoxide deactivators;
• UV absorbers (UVA) – transparent absorbing UV within 300–400 nm range;
• hindered amine (light) stabilizers (HALS, now HAS) – radical scavengers.
Without a suitable stabilization package, polymers exposed to light and O2 would degrade. Appropriate mixtures of stabilizers protect polymers at various stages throughout the processing and formation stage as well as during their lifecycle. For example, an organophosphite is a short-term antioxidant that protects the polymer during the high temperature and shear processing, while phenolic antioxidants offer a long-term defense.
The stabilizing package must be designed to finely disperse the appropriate stabilizer at a specific location or phase where it is needed. For this reason, its melting point (Tm) should be below the processing/forming temperature and it must be thermodynamically miscible with the degradation-sensitive polymer. Since the stabilizing activities are controlled by functional groups, adjustment of miscibility depends on the type and size of paraffinic vs. aromatic parts of the stabilizer molecules. Table 2.5 gives examples of four popular stabilizer types. The listed boiling point (Tb) indicates the upper temperature that would eliminate the stabilizer from the compound; thus it should not be approached either during processing or application.
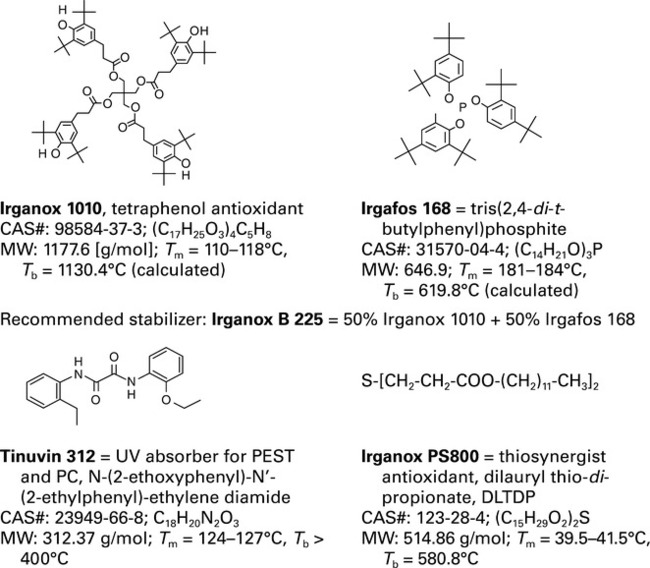
Degradation of polymers starts with a formation of free radicals, R•, caused by structural defects, temperature, stress, etc. Examples of labile bonds that break creating R• are listed in Table 2.6. Once R• is formed, the radical degradation process is initiated; it abstracts the most labile H-atom in the stabilizer or polymer. In the presence of O2, R• transforms into peroxy radical, ROO•, which accelerates the autocatalytic process. The alkyl-peroxy radicals dominate the propagation step of degradation. Usually polymers contain 0.05−0.10 wt% of antioxidants. The AO1 are radical scavengers or H-donors, e.g., Irganox 1010, while the long-term protection is provided by AO2, e.g., hydroperoxide decomposers such as Irgafos 168. Byproducts of the transformation and degradation reactions, as well as additives and pigments, are potentially leachable and extractable.
Table 2.6
Examples of labile hydrogens152
| Polymer | Labile hydrogen, H |
| Polyamide | − CO−NH−CH2− |
| Polyester | − CO−O−CH2− |
| Polyacetal | − O−CH2− O − |
| Unsaturated system | − CH=CH−CH2− |
| Polypropylene/polyethylene | − CH2−CHR−CH2 − |
Several books and other publications on the stabilization of polymers have been mentioned in this chapter. In addition, two patents are noteworthy. The one by Hamilton discusses protection of polymer blends against transesterification.154 For example, blends of PC with semi-crystalline PEST (e.g., PET) finds application in the automotive industry. Since the resistance to solvents depends on the PET crystallinity, which decreases with advancing transreactions, its control is essential. The patent specifies addition of a silyl phosphate compound for inhibiting the ester-carbonate interchange. The stabilization is achieved by deactivation of the residual metallic catalyst in the reaction with silyl phosphate stabilizers or their mixture.
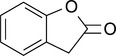
The second patent addresses several types of degradation mechanism, of the engineering or specialty polymers.155 Thus, oxidative, thermal and/or light-induced degradation of PC, PEST, polyketones or their blends may be prevented by addition of substituted benzofuran-2-one derivatives (see Fig. 2.13). In principle, the function of these molecules is radical scavenging; thus the patent also provides long lists of antioxidants, UV absorbers, light stabilizers, metal deactivators, phosphites and phosphonites, hydroxylamines, nitrones, thio-synergists, peroxide scavengers, co-stabilizers, etc. Nine examples offer stabilizing formulations for PC, PET and polybutylene terephthalate (PBT).
2.8 Challenges in blending polymers
The principal challenges in blending polymers are:
These problems are discussed below.
Since PAB performance depends on morphology, great efforts are expended to ascertain that the produced articles have optimized structure. However, since the molecular mobility exists above the beta-transition temperature, T > Tβ ≈ 0.86 Tg,156 the morphology may change during the lifetime of the article, especially if exposed to high T. Fortunately, there are several methods of morphology stabilization, including compatibilization, modification of the interphase, crosslinking, incorporation of solids (fillers or crystallization), the use of self-reinforcing miscible systems, etc.
The degradability and stabilization of HTPBs was discussed in Sections 2.6 and 2.7. Now, the influence of one macromolecular blend component on another is of interest. Evidently, in totally immiscible blends the inter-species influences are expected to be small and the blend degradability should be an additive function of composition. By contrast, the largest effects should be observed for miscible blends, for example, transreaction in condensation polymer blends, and free radical dominated processes in the addition polymers with –C–C– bonds in the main chain. At low conversion the transesterification improves compatibility of the condensation polymers, but at higher ones it reduces crystallinity, mechanical performance and thermal stability, as well as the solvent and chemical resistance.
Evidently, degradability depends on many variables (including composition), but from the limited perspective of mutual polymer-polymer effects it may be stated that transreactions, which reduce MW and crystallinity, are detrimental. However, the free radical reactions may have stabilizing effects through grafting, compatibilization and crosslinking. The presence of unsaturated bonds may be beneficial by their free radical scavenging/entrapment capability. Frequently the effect of polymer-1 on polymer-2 is opposite to that of polymer-2 on polymer-1, as reported, for example, for blends of PVC with PMMA or with polybutadiene rubber (BR). However, as the degradation mechanism depends on many variables (presence of O2, T, P, additives, concentrations, contaminants, etc.) the additivity should not be assumed and each blend should be tested – see the cited reviews for examples.157–161
A few examples of the effect of polymer-1 on the degradation of polymer-2 are presented in Table 2.7. Notably, during the dynamic TGA scans the degradation process passes through several stages, each characterized by its own set of chemical reactions. The accelerated and reduced degradation effects have been reported. In blends the less stable component degrades first, either by branching and crosslinking, or chain scission with fragmented byproducts, which may affect stability of the second polymer. Thus, in PC/PVAc or PC/PVC deacetylation and dehydrochlorination liberate acetic or hydrochloric acid, respectively, which accelerates PC hydrolysis.
Table 2.7
Examples of polymer-1 degradative effects on polymer-2 in HTPBs
| Year | Blend | Effect | Comment | Ref. |
| 1988 | PC/PBT | Embrittlement caused by MW reduction and PBT crystallization; transreaction not observed | Aged 42 days at 130 °C | 162 |
| 1991 | PC/PBI | PBI catalyzes degradation of PC | 17 h at 250 °C | 163 |
| 1997 | PMMA/PSS | Polystyrene sulfides (PSS) stabilize PMMA | TGA up to 450 °C | 164 |
| 1998 | PPEK/LCP | LCP lowers the degradation T of poly(phenolphthalein-ether-ether ketone) (PPEK or PEK-C) | Immiscible blends; TGA up to 600 °C | 165 |
| 2000 | LDPE/PPZ | Polyphosphazene increased the LDPE crystallinity (by 11%) and the maximum degradation T (by 14 °C) | Immiscible blends; TGA up to 800 °C | 166 |
| 2000 | PA-6/PP | PP and PP grafted with di-ethylmaleate (DEM) reduced the degradation T by 60 and 40 °C, resp. | Immiscible blends; TGA up to 600 °C | 167 |
| 2001 | PA-6/PC/PPG | PA-6/PC transreaction slightly improved stability of the PA-6/PC and PA-6/PC/PPG blends | Immiscible blends; TGA up to 700 °C | 168 |
| 2003 | s-PS/PPE | In blends the syndiotactic PS ( s-PS) degrades at higher T than neat, while PPE just the opposite | Miscible, crystalline blends; TGA to 700 °C | 124 |
| 2003 | PEEK/PAES | Blends degrade faster than expected by assuming additivity | TGA up to 800 °C | 169 |
| 2004 | PC/PVC | In blends PC degrades significantly faster than neat, while PVC shows slight stabilization | Miscible blends; TGA up to 600 °C | 170 |
| 2005 | PA-6/PP, PA-6/EPDM, PP/TPU | Addition of a compatibilizer, PP-grafted with maleic anhydride (PP-MAH), little affects the degradation | Immiscible blends; TGA up to 600 °C | 171 |
| 2006 | PEEK/LCP | Addition of LCP accelerates degradation of PEEK. By contrast, a small stabilization effect is noted for LCP. | Immiscible blends; TGA up to 700 °C | 172 |
| 2006 | PC/PVAc | At T ≥ 300 °C deacetylation of PVAc accelerates degradation of PC well above that of neat polymer | Immiscible blends; TGA, pyrolysis + MS to 650 °C | 173 |
| 2007 | MDMO-PPV/PC60BM | Presence of PC60BM reduced degradation of MDMO-PPV in the presence or absence of O2 | Photodegradation at 60 °C for up to 2000 min | 174 |
| 2007 | PSPI/PBA-a | Polysiloxane-b-polyimide increases Tg and char of polybenzoxazine and lowers the activation energy, Ea | Immiscible blends; TGA up to 1000 °C | 175 |
| 2008 | PA-12/PP | For w(PA) ≥ 50 and w(PA) ≤ 30 wt%, degradation was similar to that of the matrix; addition of PP-MAH reduced blend degradation | Immiscible blends; TGA up to 700 °C | 176 |
| 2010 | PEEK/PEI | Thermo-oxidation of PEEK is enhanced by PEI. The highest Ea is for 50:50 composition – recommended | Miscible blends; TGA up to 1100 °C in air or Ar | 177 |
| 2010 | PHB/S-PET | Blending reduced degradability of poly(3-hydroxy butyrate) and that of sulfonated-PET | Miscible and immiscible blends; TGA up to 900 °C | 178 |
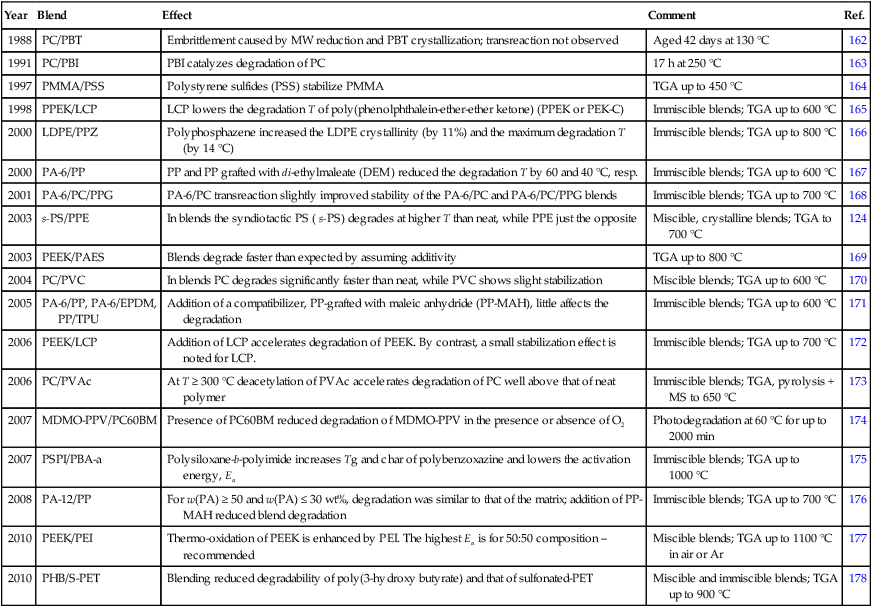
Most of the blends listed in Table 2.7 were prepared using commercial polymers or blends; thus the results also contain the effects of industrial additives. Furthermore, blend compounding for specific morphology and performance affects blend degradability by consumption of stabilizer, chain scission, addition or formation of compatibilizers, etc. Thus, variability of the degradative behavior for the same polymer-1/polymer-2 mixture is to be expected.
There are thousands of chemical species used as additives, namely antioxidants, metal deactivators, flame retardants, colorants, plasticizers, impact modifiers, lubricants, fungicides, bio-stabilizers, nucleating agents, antistatic agents, crosslinkers, etc. In addition, there are contaminants left after polymerization, compounding or foaming processes. Ideally, the additives should be miscible with the polymer they are supposed to reinforce, protect or color. However, thermodynamics requires that the low molecular weight species migrate to the interphase in immiscible PAB. Since miscibility depends on concentration, concentrated additives may precipitate within the interphase, reducing their functionality.
When blending semi-crystalline type PA and/or PEST polymers, information about polymeric chain terminal groups is essential. For example, unprotected chain ends of one polymer may cause transreaction, which may transform the blend into an amorphous copolymer, usually with reduced MW. Different types of stabilizers are needed for different polymers, but when combined they may react and neutralize each other. Similarly, the presence of hydrophilic inorganic stabilizers in one polymer may hydrolyze ester groups of others stabilizing molecules, e.g., phosphites, phosphonites or hydroxy-phenol esters.
2.9 Summary
This chapter describes high temperature polymer blends (HTPBs), methods for their characterization and how these can be used to understand blend functionality. By adjusting the molecular parameters and incorporating suitable additives, commercial polymers may be formulated for a variety of applications. Dozens of different additive types (e.g., heat, light stabilizers, flame retardants, pigments, lubricants, fungicides, nucleating agents, catalyst deactivators, metal scavengers, etc.) amount to 9–15 wt% of the total content. Furthermore, the polymer (e.g., PA or PEST) may be impact modified with up to 20 wt% elastomer. However, in spite of the biphasic nature of the compound it is not labeled as a blend. It seems that with time the number and diversity of blends increase while the number of systems described as blend decrease.
Characterization methods for analyzing blends may be divided into two types: single-phase and multi-phase. Evidently, the number of single-phase systems is limited to amorphous polymers with miscible additives. The semi-crystalline polymers (such as PA-6 or PET) are suspension of the crystalline phase in a vitreous or molten phase, thus subjected to the same analysis of phase formation and evolution with stress and temperature as that of an immiscible blend. The characterization of single-phase systems focuses on the individual macromolecules, their configuration, conformation, molecular weight and its distribution, as well as on properties directly related to the molecular mass and constitution, namely, stability, thermodynamic interactions, rheology, etc.
The performance of multiphase systems is affected by the same parameters as that of a single-phase system, but in addition by the interphase, the global morphology and that of individual phases, as well as the structure variation with processing and forming parameters. Since industrial polymers contain different additives, one must also consider their effects. For example, we blended under the same conditions a series of PP with PA-6 polymers from different manufacturers and containing different additives. In one case a chemical reaction between incompatible additive cocktails resulted in rapid degradation of the blend, while using the same resins with different polymers resulted in respectably performing blends.
Another set of the characterization tests serves for optimization of a single- or multiphase system composition and processing. The characterization may involve mechanical, thermal, physical, flammability, electrical and other tests, which either are directly applicable to any polymeric compound or their applicability extended to the conditions of interest to HTPBs. However, since these materials are often used at high CUT where molecular dynamics affect the blend morphology, the verification of long-term performance may be required. Again, the presence of foreign ingredients, brought in by blending, part mounting or combination of the degrading influences (e.g., temperature and radiation) need to be examined and appropriate stabilizers implemented.
A very special category of characterization methods involves the use of HTPBs in highly demanding engineering applications such as, for example, structured membranes for gas or liquid separation at high temperature, T, and pressure, P, the fuel cell membranes and active layers in solar cells. Even more demanding are aerospace applications, where the polymers may be exposed to wide T and P variations, hard radiation and erosion by atomic oxygen. As discussed in Chapter 3, evaluation of the material performance for these applications requires elaborate specific test instrumentation and methods, often developed and maintained by a national organization.
2.10 Future trends
During the last half century polymer blends, like filled polymers before, became indispensable. Combining polymers with desired properties into new materials reduces developmental cost and expense for production and storage of numerous grades. PAB seldom offers synergistic properties, but provides the possibility of creating new material with a combination of properties rarely accessible from a single polymer.4,122
On the basis of the historical perspective, the future evolution of PAB technology will be motivated by three principal vectors:
In the case of the first of these vectors, some elements of this future HTPB technology are mentioned in this chapter, e.g., applications in aerospace, fuel and solar cells. For example, the use of polymers and their blends in the membrane application is in a relatively early stage, expensive, lacking efficiency and durability. For fuel cells in particular there are intense efforts for replacing expensive Pt catalyst and the polymeric per-fluoro sulfonic acid (Nafion®). Highly promising developments of these materials have been announced.179-181 The others include expanded use of PAB in electronic (e.g., as organic transistors) and optoelectronic (photovoltaics, LED) applications, as conductive material (plastic wires), bio-materials and others.182,183
Regarding the second vector, to this category belong new polymers and new additives. Some of these have been mentioned, for example, new high performance polymers, self-reinforcing miscible blends, self-organizing macromolecules, etc. Another group of materials that belongs to this category are nanoparticles, which with growing frequency are incorporated into PAB, alone or in combination with more traditional micro-reinforcements. The clay platelets migrate either to the interphase or to a more polar one. Their presence increases the modulus, reduces permeability by gases and vapors, and reduces and stabilizes the size of the dispersed phase.184,185 The nano-particle technology expanded to fuel and solar cell membranes. As in other fields, replacement of nano-size spheres by rods and plates offers significant improvement at low concentration.183,186 In addition, nanoparticles influence crystallization of the semicrystalline polymer in its vicinity.187 Layered clay nanoparticles, layered graphene, carbon nanotubes, metallic or metal oxide nanoparticles are used industrially. Hopefully, collaboration between the ceramic and polymer industries will yield a new family of synthetic, high temperature resistant nanoparticles with affinity to specific polymers that will eliminate the need for intercalation or compatibilization.188–190
Regarding the third vector, during the last few years there has been significant progress in the synthetic methods that lead to formation of self-organized macromolecular structures, based on the concept of end-groups attractive/repulsive interactions or formation of block copolymers, namely HyperMacs and HyperBlocks.191–193 Control of chain ends also offers means for efficient control of the surface properties, e.g., addition of < 0.5% of multi-functional fluoroalkyl additives transforms PS surface tension to that of PTFE.194
At the same time computational methods based on the molecular mechanics, molecular dynamics (MD), Monte Carlo (MC) and ab initio methods evolved to the high level of predictive capability, accelerating development of new materials with designed properties.61,195 For the multicomponent and multiphase systems (e.g., nanocomposites, blends, composites with properties adjusted by incorporation of intercalants or compatibilizers) the most promising is the hierarchical multi-scale molecular modeling (MSMM).196 Thus, while such molecular simulations as MD or MC efficiently analyze the molecular structure at 0.1−10 nm, MSMM, using for example the dynamic mean field density functional theory and dissipative particle dynamics, expands to mesoscopic level larger by a factor of 1000, where the systems morphology may be computed. In the next, macroscopic scale, the finite elements modeling may be used. The model is capable of predicting macroscopic properties of a part, such as degradability, mechanical performance, etc.