
Characterization of high temperature polymer blends for specific applications: fuel cells and aerospace applications
L.A. Utracki, formerly of the National Research Council, Canada
Abstract:
This chapter examines the use of high temperature polymers as membranes, fuel cells and solar cells. Also, it considers the application of such materials for aerospace developments. The methods for characterization and testing of specific high temperature polymer blends for each of these applications are reviewed.
3.1 Introduction
High temperature polymer blends (HTPBs) are typically used at T ≥ 140 °C and maintain at least 25% of their room temperature (RT) properties at 154 °C. Considering their expanding applications in such sectors as the military, aerospace, transportation, electronic, healthcare, and oil and gas industries, they need to have good processability, high mechanical performance, chemical resistance, fire retardancy etc. 1 Table 3.1 provides a list of some of the most important HTPBs in order of increasing continuous use temperature (CUT) from 75 °C to 540 °C. Building on the previous chapter, this chapter looks at the use of HTPBs for membrane, fuel and solar cell and aerospace applications. It reviews ways of characterizing and testing particular polymer blends for these applications.
Table 3.1
High temperature polymer blends (HTPBs) arranged in order of increasing ‘continuous use temperature’ (CUT)
| Polymer | Examples | Temperature (°C) | Blends with | Comment | ||
| CUT | Tm | Ty | ||||
| Polyoxymethylene | POM | 85–115 | 160–175 | –80 | POM, PEST, PPE, PC | Delrin® |
| Polyphenyleneether | PPE (PPE/ PS) | 104 | 257 | 205–215 | PEST, PC, PA, PARA, PCT, POM | With PPE or styrenics |
| Polyesters | PET, (PBT, PC) | 110,(118) | 257, (219) | 70,(31) | PBT, PEN, Par, POM, PCT, PEA, PPE/PS, PC | Valox® |
| Polyamides | PA-6, (PA-66) | 110, (99) | 220 – 225, (255–264) | 52, (65) | PPE, PA, PARA, POM, LCP, PET, PBT, PAr, PEB, PC | Nylon, Zytel® (aliphatic) |
| Polycarbonate | PC | 116 | 147–149 | PET, PBT, PCT, PCTG, PAr, PPE/PS, POM | Bis-phenol-A polycarbonate, PC |
|
| Polyphthalamide | PPA | 120–185 | 310 | PA, PPS, PP, PARA, PC, LCP | Amodel® | |
| Polyarylates | PAr | 130 | 188 | PEST, PARA, LCP, PA, PBI, PC, PEI, PEK, PEST, Phenoxy, PMB, PPE, PPS | VVith heteroatom in the main chain | |
| Polyarylene sulfide | PPS | 170 | 280 – 288 | 194 | PPE, PC, PTFE, PSF, PAr, PARA, Pl, PAI, PEK, LCP PAES, PPSS, PDMS, FEP PCTFE, PTFE, PVDF | Diverse aromatic; Rayton® |
| Aromatic (amorphous) polyamides, PARA* | PA-61, (PA-6I6T), | [180] | –, (310), [310] | 120,(90), [127] | POM, PEST, PA, PAI, PPS, PES, PphA, PAr, PBI | Excluding LCP-type |
| Polyphenylene-terephthalamide† | PPTA, PMTA | 180 | 310 | 90 | PBI | Flame resistant coatings |
| Polysulfone, PSU, polyphenylsulfone, | PPSU, (PSF), [PES], PSO | 190,(140–150), [204] | 190, [230] | PC, PPE, PA, PEST, Pl, PAI, PEI, PEK, PEEK, PTFE, PEA | Mindel®, Eviva® Udel®, Radel®, | |
| Liquid crystal polymers | LCP | 220-271 | 300–350 | ca. 120 | PA, PPTA, PARA, PAEK, PPE, Pl, PAI, PEI, PPS, PEST, PVDC, PVDF, PVF, PSF, LCP fluorinated polymers | Xydar®, diverse others |
| Polyaryletherketones, PAEK | PEEK | 240-310 | 334 | 143 | PES, PPS, Pl, PAI, PEI, PA, LCP, PSF, fluorinated polymers | Victrex® |
| Polyimides | PAI (PEI) | 250–275, (165-170) | 279, (220) | PA, PARA, PEST, PC, PPE, PPS, PSF, PEEK, LCP (PC, PA, PSF, PEC, PAr, PEST, LCP, PPS, PEEI) | Ultem® | |
| Thermoplastic polyimide | TPI | 230 [465] | – [388] | ≤ 311 [250] | PEI, LCP, PTFE, PAI, PPE, PARA, PPS, PSF, PEEK, Pl | Extem®, Aurum® |
| Polybenzimidazole‡ | PBI | 435 | 760 | 427 | PEEK, PPTA, PVDF, PES, PEI, PAI, PARA | High-T blends |
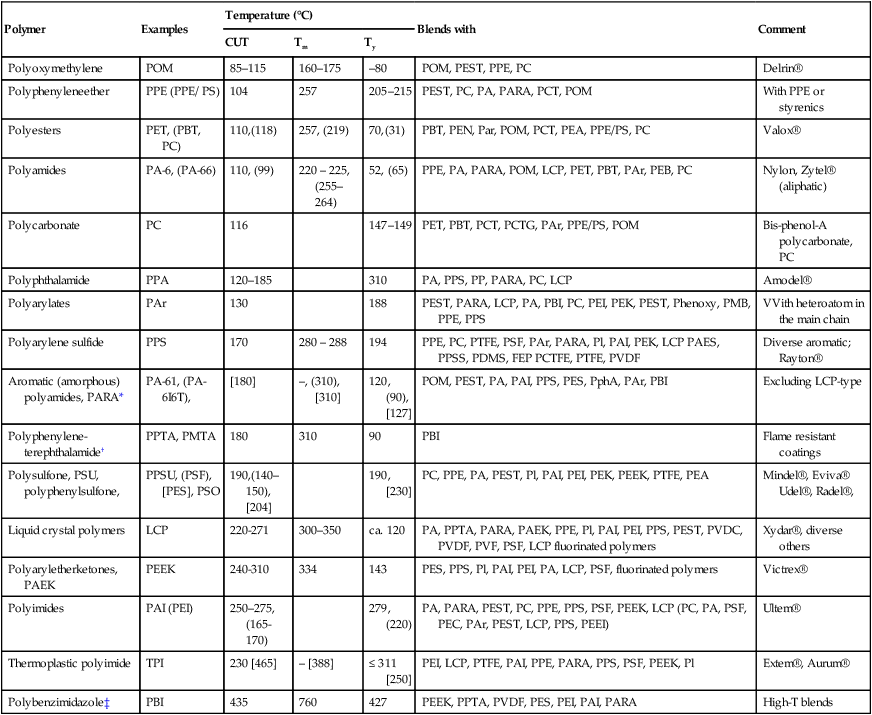
*PA-6I, poly(hexamethylene isophthalamide);
†PPTA, poly(p-phenylene terephtalate) and PMTA, poly (m-phenylene tere-phthalate);
‡PBI, poly[2,2′-(m-phenylene)-5,5′ bis-benzimidazol].
3.2 High temperature polymer blends (HTPBs) for membrane applications
During the last 30 years or so membrane applications have seen a significant growth in diverse fields of application. For example, they are used for:
• water, ultrapure water and wastewater purification; 2–5
• microfiltration, ultrafiltration and nanofiltration;
• membrane bioreactors for wastewater;
• food, biotechnology and chemical applications; 6,7
• tissue engineering, biopharmaceutical separations, hemodialysis;
• purification of juice, saccharides, beer and wine, condiments, oil, gluten, etc.;
• vapor and gas separation, for example in the petroleum industry (H2, CO2, CH4, H2S, SO2, NOX, He, H2O, hydrocarbons and others); 8–11
• use as contactors and reactors; 12
Evidently, not all these membrane applications require HTPBs. Water purification by ultra and nanofiltration (UF, NF) does make use of HTPBs. According to the American Membrane Technology Association (AMTA), the pressure in these operations ranges from 0.1 to 63 MPa, operating tem-perature is 120–180 °C and the membrane must survive the temperature drop to –40 °C. In consequence, hollow or spirally wound fibers, cartridges, and tubular membranes are prepared, for example from cellulose acetate (CA), semi-aromatic co- polyamide (CPARA), polysulfone (PSF) or PVDF. They are used in multi-layered arrangements with blends, which provide desirable gradients of morphologies.
The need for HTPs or HTPBs is often for chemical (e.g., preventing of swelling or oxidation) and mechanical performance. For example, in the petroleum industry dual-layer hollow fiber membranes are used for separation of H2/CO2 and CO2/CH4 gases. These are prepared from solutions of 1:1 PIB/PI blend (e.g: poly[2,2’-(1,3-phenylene)-5,5’-bibenzimidazole] and poly[3,3’4,4’-benzophenone-tetra-carboxylic-di-anhydride-co-5(6)-amino-1-(4’-amino-phenyl-1,3-tri-methyl-indane)]).17,18 The spun hollow fibers are coated by a solution of silicone rubber. The membranes had the desired microstructure. Membrane selectivity of 11.11 and 41.81 was obtained for H2/CO2 and CO2/CH4, respectively. Furthermore, the new membranes showed good resistance toward CO2-induced plasticization. Camacho-Zuniga et al. developed PSF copolymers based on an equimolar mixture of the rigid/compact naphthalene moiety having Tg = 230 °C, stable to 400 °C (10 wt% loss in air) and positron annihilation lifetime spectroscopy (PALS) determined free volume cavity diameters from 9.4 to 13.9 nm. Good gas permeability and selectivity were reported for H2/CH4, O2/N2, and CO2/CH4.19 The membranes were characterized for the morphology using a scanning electron and a field emission microscope, SEM and FEM, respectively. The permeation performance of the hollow fibers was analyzed using the variable-pressure constant-volume method at 35 °C and pressure of 1.0 and 0.35 MPa for H2/CO2 and CO2/CH4, respectively.20
The greatest challenge for high temperature membrane technology is in fuel 13,14 and solar 15,16 cell applications. The general information may be found in the cited reviews – more details are presented in Sections 3.3 and 3.5, respectively.
3.3 Fuel cell (FC) membrane applications
There are several types of fuel cells (FCs), where a fuel is transformed into electricity: 21
• PEM-FC (polymer exchange membrane fuel cell) ;
• DM-FC (direct methanol fuel cell);
• PA-FC (phosphoric acid fuel cell);
Most FCs are designed for H2. A hydrogen-powered FC (HP-FC) typically consists of two electrodes and a PEM separator. DM-FCs are comparable to a HP-FC in regards to operating temperature, but are not as efficient. The fuel is supplied as a 1 mol solution, for enhanced efficiency fed to the cell at high temperatures and pressure. Methanol crossover (≤ 50% diffuses through PEM without converting to H2) decreases efficiency. Also, the DM-FCs require a relatively large amount of platinum to act as a catalyst, which makes these fuel cells expensive. There are also attempts to produce FCs fed by hydrocarbons (e.g., natural gas direct carbon fuel cell, NGDC-FC) converting it to H2O and CO2.22,23 NGDC-FC combines methane (CH4) decomposition with the fuel cell to produce H2 and electricity. The system is suitable for automotive use, with CH4 pumps made available at fuel filling stations.
For this chapter, PEMs and DMs, with solid polymer electrolyte membranes, are of interest. Because of different types of fuels (mainly hydrogen or methanol, H2 or MeOH, respectively) even in this category the materials and construction vary broadly. For example, while for portable applications the PEM will operate at T < 80 °C, for automotive and stationary applications the T goes to 130 °C and 180 °C, respectively. 24 For good conductivity of solid PEMs, the presence of water is essential. However, since as T increases keeping water in the PEM gets more difficult, there is a need for reducing the water content to at least 25% without upsetting PEM performance.25 The H2 technology remains expensive; in 2006, General Motors estimated that for a FC system to have an equivalent cost to a combustion engine, the FC power plant (PEM + catalyst + fabrication) would need to cost < 10$/kW and last 10 years; by 2009 the cost of an 80-kW automotive PEM/H2 system was $61/kW.26,27
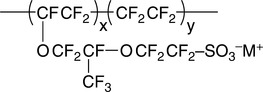
The most popular PEM used in fuel cells is Nafion®, a sulfonated (thus ionomer) tetrafluoroethylene-based fluoro polymer-copolymer (Fig. 3.1). Nafion® is a proton conductor with good chemical, thermal and mechanical stability. However, it is expensive and its performance deteriorates at the operating range for fuel cells, T > 80 °C. The search for a Nafion® replacement is limited by three criteria:
1. the material must be stable at high temperatures;
2. it may be acidified (sulfonated or phosphonated);
3. it may be fluorinated or blended with fluorinated polymers.
Since blends offer a wider spectrum of performances than individual polymers, the search invariably involves HTPBs. In particular, the adopted strategy is using ionomers for electrical conduction and HTP for strength.
Attractive blends for PEMs with high proton conductivity have been made from sulfonated PES, PSU, polyetherketone (PEK), PEEK or poly(2,6-dimethyl 1,4-phenylene ether) (PPE) blended with polybenzimidazole (PBI) or polyetherimide (PEI).28,29 To preserve the desired PEM performance, the blends are often crosslinked by radiation, chemical reaction of ionic interactions. For long-term PEM applications it is important that membranes’ resistance to mechanical, chemical and thermal degradation is maximized. Accelerated aging tests should follow several membrane functionalities, for example conductivity, membrane integrity and permeability.30 The tests should also identify a possible cross-correlation of effects, namely stress on thermal and/or chemical degradation.
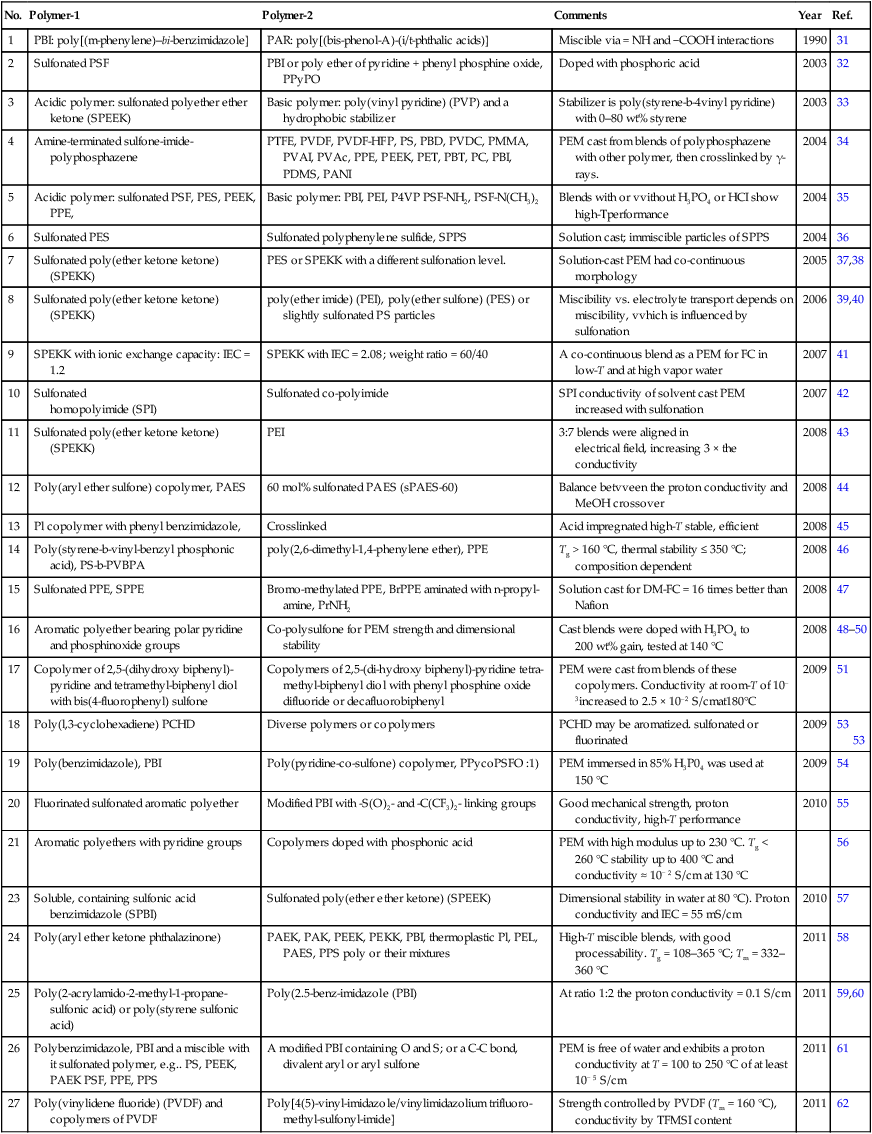
However, PEMs are also being made from polymer blends other than sulfonated polymers; examples are listed in Table 3.2. Since the FC operates at T > 150 °C (for increased catalyst activity and reduced CO and other impurities), the PEM polymer must be thermally stable, resistant to oxidation, have good mechanical properties and high proton conductivity after doping with acid. 31–62
Table 3.2
Some polymer blends used for PEM
| No. | Polymer-1 | Polymer-2 | Comments | Year | Ref. |
| 1 | PBI: poly[(m-phenylene)–bi-benzimidazole] | PAR: poly[(bis-phenol-A)-(i/t-phthalic acids)] | Miscible via = NH and −COOH interactions | 1990 | 31 |
| 2 | Sulfonated PSF | PBI or poly ether of pyridine + phenyl phosphine oxide, PPyPO | Doped with phosphoric acid | 2003 | 32 |
| 3 | Acidic polymer: sulfonated polyether ether ketone (SPEEK) | Basic polymer: poly(vinyl pyridine) (PVP) and a hydrophobic stabilizer | Stabilizer is poly(styrene-b-4vinyl pyridine) with 0–80 wt% styrene | 2003 | 33 |
| 4 | Amine-terminated sulfone-imide-polyphosphazene | PTFE, PVDF, PVDF-HFP, PS, PBD, PVDC, PMMA, PVAI, PVAc, PPE, PEEK, PET, PBT, PC, PBI, PDMS, PANI | PEM cast from blends of polyphosphazene with other polymer, then crosslinked by γ-rays. | 2004 | 34 |
| 5 | Acidic polymer: sulfonated PSF, PES, PEEK, PPE, | Basic polymer: PBI, PEI, P4VP PSF-NH2, PSF-N(CH3)2 | Blends with or vvithout H3PO4 or HCI show high-Tperformance | 2004 | 35 |
| 6 | Sulfonated PES | Sulfonated polyphenylene sulfide, SPPS | Solution cast; immiscible particles of SPPS | 2004 | 36 |
| 7 | Sulfonated poly(ether ketone ketone) (SPEKK) | PES or SPEKK with a different sulfonation level. | Solution-cast PEM had co-continuous morphology | 2005 | 37,38 |
| 8 | Sulfonated poly(ether ketone ketone) (SPEKK) | poly(ether imide) (PEI), poly(ether sulfone) (PES) or slightly sulfonated PS particles | Miscibility vs. electrolyte transport depends on miscibility, vvhich is influenced by sulfonation | 2006 | 39,40 |
| 9 | SPEKK with ionic exchange capacity: IEC = 1.2 | SPEKK with IEC = 2.08; weight ratio = 60/40 | A co-continuous blend as a PEM for FC in low-T and at high vapor water | 2007 | 41 |
| 10 | Sulfonated homopolyimide (SPI) |
Sulfonated co-polyimide | SPI conductivity of solvent cast PEM increased with sulfonation | 2007 | 42 |
| 11 | Sulfonated poly(ether ketone ketone) (SPEKK) | PEI | 3:7 blends were aligned in electrical field, increasing 3 × the conductivity |
2008 | 43 |
| 12 | Poly(aryl ether sulfone) copolymer, PAES | 60 mol% sulfonated PAES (sPAES-60) | Balance betvveen the proton conductivity and MeOH crossover | 2008 | 44 |
| 13 | Pl copolymer with phenyl benzimidazole, | Crosslinked | Acid impregnated high-T stable, efficient | 2008 | 45 |
| 14 | Poly(styrene-b-vinyl-benzyl phosphonic acid), PS-b-PVBPA | poly(2,6-dimethyl-1,4-phenylene ether), PPE | Tg > 160 °C, thermal stability ≤ 350 °C; composition dependent | 2008 | 46 |
| 15 | Sulfonated PPE, SPPE | Bromo-methylated PPE, BrPPE aminated with n-propyl-amine, PrNH2 | Solution cast for DM-FC = 16 times better than Nafion | 2008 | 47 |
| 16 | Aromatic polyether bearing polar pyridine and phosphinoxide groups | Co-polysulfone for PEM strength and dimensional stability | Cast blends were doped with H3PO4 to 200 wt% gain, tested at 140 °C | 2008 | 48–50 |
| 17 | Copolymer of 2,5-(dihydroxy biphenyl)-pyridine and tetramethyl-biphenyl diol with bis(4-fluorophenyl) sulfone | Copolymers of 2,5-(di-hydroxy biphenyl)-pyridine tetra-methyl-biphenyl diol with phenyl phosphine oxide difluoride or decafluorobiphenyl | PEM were cast from blends of these copolymers. Conductivity at room-T of 10–3increased to 2.5 × 10⁻² S/cmat180°C | 2009 | 51 |
| 18 | Poly(l,3-cyclohexadiene) PCHD | Diverse polymers or copolymers | PCHD may be aromatized. sulfonated or fluorinated | 2009 | 53 53 |
| 19 | Poly(benzimidazole), PBI | Poly(pyridine-co-sulfone) copolymer, PPycoPSFO :1) | PEM immersed in 85% H3P04 was used at 150 °C | 2009 | 54 |
| 20 | Fluorinated sulfonated aromatic polyether | Modified PBI with -S(O)2- and -C(CF3)2- linking groups | Good mechanical strength, proton conductivity, high-T performance | 2010 | 55 |
| 21 | Aromatic polyethers with pyridine groups | Copolymers doped with phosphonic acid | PEM with high modulus up to 230 °C. Tg < 260 °C stability up to 400 °C and conductivity ≈ 10− 2 S/cm at 130 °C | 56 | |
| 23 | Soluble, containing sulfonic acid benzimidazole (SPBI) | Sulfonated poly(ether ether ketone) (SPEEK) | Dimensional stability in water at 80 °C). Proton conductivity and IEC = 55 mS/cm | 2010 | 57 |
| 24 | Poly(aryl ether ketone phthalazinone) | PAEK, PAK, PEEK, PEKK, PBI, thermoplastic Pl, PEL, PAES, PPS poly or their mixtures | High-T miscible blends, with good processability. Tg = 108–365 °C; Tm = 332–360 °C | 2011 | 58 |
| 25 | Poly(2-acrylamido-2-methyl-1-propane-sulfonic acid) or poly(styrene sulfonic acid) | Poly(2.5-benz-imidazole (PBI) | At ratio 1:2 the proton conductivity = 0.1 S/cm | 2011 | 59,60 |
| 26 | Polybenzimidazole, PBI and a miscible with it sulfonated polymer, e.g.. PS, PEEK, PAEK PSF, PPE, PPS | A modified PBI containing O and S; or a C-C bond, divalent aryl or aryl sulfone | PEM is free of water and exhibits a proton conductivity at T = 100 to 250 °C of at least 10− 5 S/cm | 2011 | 61 |
| 27 | Poly(vinylidene fluoride) (PVDF) and copolymers of PVDF | Poly[4(5)-vinyl-imidazole/vinylimidazolium trifluoro-methyl-sulfonyl-imide] | Strength controlled by PVDF (Tm = 160 °C), conductivity by TFMSI content | 2011 | 62 |
3.4 Characterization of HTPBs for FC applications
Characterization methods may be segregated into three categories:
1. characterization of individual blend components;
2. characterization of polymer blends;
3. characterization for specific polymer blend application (namely, that of fuel or solar cell, of electrically conductive and used in aerospace).
There are a number of detailed descriptions of the fundamentals and characterization test procedures. 63,64
3.4.1 Characterization of individual polymer components
Standard characterization methods are applicable to most polymers. However, as polymerization conditions are pushed toward high temperature and pressure, the side reactions may lead to contaminants on both sides – the low molecular weight fragments and partially crosslinked fraction. Thus, these three parts may require separate characterization.
Polymer conformation/configuration and interactions may be determined using the following standard methods.
• FT-IR spectroscopy over a wavelength range 550–4000 cm− 1 with attenu-ated total ref ection (ATR) module. Prior to measurements, the samples ought to be well dried (e.g., vacuum, T = 80 °C). Thin, cast f lms or KBr pellets may be used. It is noteworthy that IR spectroscopy detects functional or polar bonds, e.g., C=O, O-H, etc.
• Since Raman spectroscopy sees carbon allotropes and polarizable carbon bonds (e.g., C-C, C=C, etc.) it offers complementary information to FT-IR. The Raman wavelengths of interest are 500–2000 cm− 1. For example, membrane interaction with H3PO4 was analyzed following the shift of the imidazole and pyridine groups at 1539 and 1592 cm− 1, respectively. The spectra were recorded using the near-infrared spectroscopy (NIR) excitation at 1064 nm.54
• The solution 1 H and 13C nuclear magnetic resonance (NMR) spectra are recorded at frequencies of 250 and 62.9 MHz, respectively, with tetra-methyl silane, tri-methylsilyl (TMS), as internal reference. Before analysis, sulfonated compounds are to be converted to the sodium sulfonate form.65 The solid state NMR spectroscopy with the magic angle spinning at frequency 1–35 kHz, magic angle spinning NMR (MAS NMR), is often performed on dilute or rare nuclei (e.g., 13C, 15 N, 29Si, 31P) at an appropriate Larmor frequency ω = 200–850 MHz (the Larmor frequency is a product of the magnetic field strength, Bo, and the characteristic for each nuclei gyro-magnetic ratio, γ: ω = γBo). Spectra may be referenced to TMS (1H) or phosphor (31P). High resolution 1H MAS NMR provides information on hydrogen bonding and proton mobility. Since the latter on the one hand determines the proton conduction and on the other in solid state polyelectrolyte’s proton motion is connected with chain dynamics, knowledge of the latter is essential for understanding the PEM transport mechanism.
• Size exclusion chromatography (SEC) requires dissolution of polymers in a good solvent at T that ascertains full miscibility. The system consists of a pump, a multi-angle laser light scattering detector (with 18 detection angles), a refractive index detector and an in-line viscometer. The flow rate is about 1.0 mL/min. The SEC columns are calibrated with a mono-dispersed polymer (e.g., polystyrene (PS)) of well-known molar mass, plotting molecular weight (MW) vs. elution volume. Comparing the test results to the calibration data provides full information about MW and molecular weight distribution (MWD) . However, since the standard SEC operates at T ≤ 135 °C it may not be useful for some HTP The alternatives are the high temperature scattering and solution viscosity measurements. In the latter case, for better precision the intrinsic viscosity, [η], should be determined using a thermostated viscometer. 66 Alternatively, for comparisons, the inherent viscosity, ηinh [In (η/η0)]/c, may be determined using a single solution at a single temperature (e.g., 0.5 g/dL solutions in 96% H2SO4 at 30 °C).
• Thermogravimetric analysis (TGA) may be carried in air or under N2, either as a dynamic temperature scan (e.g., 40–700 °C at a rate of 10 K/min) or as an isothermal performed at constant temperature vs. time (e.g., at T = 350 °C, for t = 90 min); the conditions depend on the tested polymer or blend.
• Differential scanning calorimetry (DSC) is being used for studying the vitrification, Tg, melting, Tm, and crystallization, Tc, transitions. The measurements are usually performed under N2 at T = −80 to 340 °C at a heating rate of q = 5−20 K/min in cycles consisting of 1st heating-cooling 2nd heating scans.
• The pyrolysis-gas chromatography-mass spectrometry, GC-MS, measurements are performed using a pyrolyzer and gas chromatograph coupled to mass-selective detector. The ~ 100 mg sample is placed in a quartz sample tube, preheated at 140 °C to remove the volatiles and then rapidly heated to the selected pyrolysis temperature, Tpyr = 600–1000 °C The volatile fragments are separated by gas chromatography (GC) and identif ed by MS.
• Melt rheology offers a spectrum of information about the polymer (or blend), its thermal stability, shear sensitivity, the mechanism of degradation (e.g., chain scission vs. branching and crosslinking), processability, etc. The preferred method of testing is dynamic between cone-and-plate or parallel plates. 67
3.4.2 Testing polymer blends
The following standard methods may be used.
• For polymer blends the key is the knowledge of miscibility.68–70 Since miscibility and its type depend on many variables, the most desirable thing is to generate a phase diagram reflecting the range of variables within which the blend will be prepared, processed and used, for example all components of the blend including compatibilizers, stabilizers, additives, concentration, temperature, pressure, etc. As an alternative, one may determine the miscibility of a single composition under a single set of conditions. In this case, the residual stresses, time scale for their dissipation and invariable blend coarsening must be taken into account. Blends have three phases: miscible, immiscible and the metastable meso-phase between them (excepting the critical point). The domain size in miscible system: d ≤ 2 nm.
• For the use of HTPBs in FCs the films morphology is highly pertinent. The morphology depends on the thermodynamic interactions (the phase diagram), the stress field during forming, the coalescence/coarsening time and conditions, as well as the post-treatment (e.g., extraction of one phase). Depending on the domain size, different microscopic methods are used, namely optical (OM), SEM, AFM or transmission electron microscopy (TEM).
• Owing to the wide range of magnification, × = 10–500,000, the most commonly used in FC research and technology is SEM.71 To avoid electrostatic charge at the surface, specimens should be coated with, for example, Au/Pt layer and electrically grounded. Coating is done by low vacuum sputtering, high vacuum evaporation or by solution coating. In some cases it may be necessary to improve Au/polymer adhesion by treatment with di-thiol solution. Recently new SEMs labeled as environmental, low-vacuum, high-pressure, or variable-pressure were developed. The higher pressure minimizes outgassing from volatile samples and diminishes charging the nonconductive samples.
3.4.3 Testing polymer blends for specifiic applications
The following standard methods may be used.72
• The titration of acid functions of the polymeric membrane is performed after immersing it for 24 h in a 2 M NaCl aqueous solution. The mixture is titrated with a 0.05 M NaOH aq. solution to pH = 7.0. To test an ionic polymer for its alkalinity the blend is titrated with HCl.
• The gas permeability through the hollow fiber single cell is performed by placing the test cell in a pressure vessel at a controlled temperature. The permeation rates of pertinent gases (e.g., He, CO2,O2, N2) are measured at ambient pressure and temperature using a soap optidigital flowmeter. The pressure difference across the hollow fiber should be kept constant at 0.5 MPa. The permeability is calculated using the relation pi = Qi /[75nπdoutΔP], where Qi (mL/s) is the f ow rate of gas i, n is the number of hollow fibers in the cell, dout (cm) is the fiber outer diameter, L (cm) is the fiber length, ΔP (MPa) is the pressure difference across the membrane. The separation factor relative to N2 is written as αi = pi/pN2.73,74 For binary gas pairs O2/N2, CO2/CH4, H2/N2, etc., the gas separation by polymeric membranes shows a tradeoff between permeability and selectivity. According to Robeson, empirically there is a relation between the gas separation factor and permeability of the more permeable gas log(αA/B) = a0–a1 log(pA), where ai are empirical parameters for the given pair.75–77
• Flat, 70 μm thick membranes obtained from a solution of PBI with poly(pyridine-co-sulfone), were immersed in 85% H3PO4 until gaining 180–200 wt%. The membrane (surface area = 960 mm2) was mounted in a test cell equipped with a quadrupole mass spectrometer for monitoring of the outlet. Different gases were flown through the anode chamber of the cell at a rate of 80 mL/min, while Ar was flown through the cathode chamber at 10 mL/min. Outlets of these chambers were connected to a quadrupole mass spectrometer, so the gas composition from both outlets was recorded. Testing provided information on the amount of gas that permeated at T = 130–170 °C through the HTPB membrane, separating anode from cathode chamber.54,78
• Methanol (MeOH) permeability at 30 °C was determined following the electrochemical monitoring method. Accordingly, the membrane was clamped between the two compartments of the test cell, both magnetically stirred. The required volume of aqueous MeOH and KOH solution was added to compartment ‘A’ containing a Pt-mesh counter electrode (CE). An equal volume of KOH aqueous solution was added to compartment ‘B’, containing a smooth Pt-working and Hg/HgO reference electrodes. The cell potential was recorded every 30 min at a rate of 50 mV/s between 0.2 and 1 V. The height of the MeOH oxidation peak was assumed to be proportional to the amount of MeOH permeated through the membrane. Gas chromatographic analysis was also carried out. 79
• The MeOH permeability was determined by calculating its flux through the membrane placed into a glass cell in a double bath at constant tem-perature.44 One bath was filled with 5 wt% MeOH aqueous solution, and the other with water. The MeOH concentration was calculated from the refractive index. Sampling was done for 5 h every 10 min. As a first approximation the MeOH permeability is proportional to the rate of concentration change.
• Membrane water uptake (WU) may be defined as the amount of water absorbed by it while the specimen is stored in a container at constant temperature and relative humidity (RH) until equilibrium. The type of bonding responsible for the membrane hygroscopicity may be determined by 1H-MAS-NMR. The weight-based water sorption is expressed as
• The ultimate WU may be determined for membranes from which excess sulfuric or phosphoric acid is removed by storing it in H2O for 24 h. Next, WU is measured by immersing several PEM pieces (around 0.1 g) in deionized water at 20 °C or 25 °C for 24 h. Next, each specimen is wiped with tissue paper and weighed. The water uptake is calculated from Equation [3.1] as the average weight ratio of absorbed water on the dry sample weight. The dimensional stability should also be calculated. The amount of free and bound water in PEM may be determined in DSC by scanning the specimens from –50 to + 50 °C at 1 °C/min. The amount of free water is calculated from the area under the melting peak at 0 °C and the heat of fusion ΔH(H2O) = 334 J/g. Bound water is expressed as the difference between WU W and the free water content. The PEM water uptake may also be determined using TGA, heating the specimen from –30 °C to 900 °C at a rate q = 10 °C/min.59,60
• The PEM ion-exchange capacity (IEC) is defined as the number of milli-equivalents (meq) of acidic ions per 1 g of the dry polymer. IEC is determined by titration. First, dry PEM specimen (around 0.1 g) in an acid-form is immersed in 50 mL 2 M aq. NaCl or KCl for 48 h. Next, three 10 mL aliquots are removed and titrated with 0.01 M NaOH to a methyl red endpoint. The IEC is calculated as an average of three tests. Alternatively, instead of NaOH a very dilute aq. Na2CO3 solution may be used. Good PEM has IEC ≈ 1 meq/g and the equilibrium water swelling B ≥ 119%, both calculated on PEM dry weight.
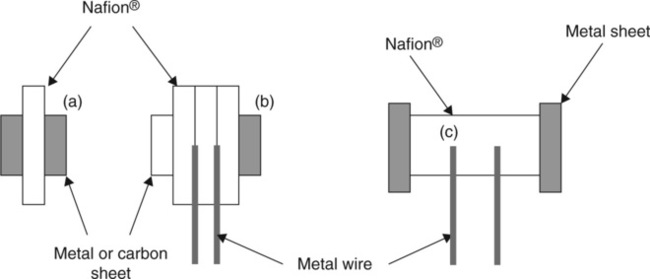
• Proton conductivities of fully hydrated membranes (24 h at ambient temperature in double deionized H2O) may be measured using two- or four-probe electrochemical impedance spectroscopy (EIS) at frequency 0.1–10 MHz with AC amplitude of 5 or 10 mV (Fig. 3.2).44,80,81 For good membrane-electrode contact the PEM is placed between two Hg or Pt electrodes in a sealed conductivity cell, thermostated at the desired T for about 5 h before measurements. It is advisable to perform the measurements with dry membranes from 20 up to 100 °C in 10 °C steps with wet membranes. Each sample should be measured 10 times and the average value of the impedance, R, used for calculating the proton conductivity: σ = d/RS (S/cm), where d is the membrane thickness, thus the distance between the electrodes. The results are sensitive to the specimen immersion depth, quality of deionized water, and electrode/membrane contact. Usually, the ionic conductivity correlates with the degree of sulfonation.38,64,82,83
• Proton conductivity is proportional to the number of charges (n) per unit volume and the ion mobility in an electric field (μ): σ = n/n. The proton conductivity was measured by dielectric spectroscopy in a two-electrode geometry using an SI 1260 impedance/gain-phase analyzer in the frequency range of 10− 1−10− 6 Hz. The humidity of air during data acquisition was set by mixing dry nitrogen with humidity saturated nitrogen. The relative humidity (RH) was measured using a Sensiron SHT15 sensor. For dry-condition proton conductivity measurements the samples were dried at 50 °C under vacuum for four days prior to the test. Completely dry N2 was used to flush the samples during the measurements. The samples for conductivity measurements were pressed to tablets and contacted by E-tek® and stainless steel electrodes. Proton conductivities were evaluated from both Cole-Cole and Bode plots. All curves have a specific frequency region in which AC conductivity is frequency independent (a plateau). The extrapolation of the plateau to ω = 0 provides DC conductivity. The precision of this method was checked by comparison of the results with values obtained via Cole-Cole plot. The data obtained by these approaches were in good agreement.
• The temperature dependence of the conductivity in polymer electrolytes (σ) may indicate the conduction mechanism, for example the Arrhenius type: ln σ = ln σo − Ea/RT (Ea is the activation energy, R is the gas constant, and σo is a pre-exponential factor). 84 In systems that obey the Arrhenius dependence the ‘thermally activated’ ions have sufficient energy to over-come the Ea energy barrier, i.e., thus this behavior is mainly observed at high T.85 At lower temperatures the Vogel-Fulcher-Tamman-Hesse (VFTH) equation applies: ln σ = Ao + A1/(T–To) (where Ao is a pre-exponential factor, A1 is a constant, T is the temperature of measurement and To ≈ Tg−50 is the reference temperature). However, in the case of proton conduction, T-dependence is complicated by the temperature-dependent dissociation that generates ‘activated’ protons able to overcome the energy barriers for conduction. Experimentally, the PEM conductivity when scanned from 20 °C to 150 °C was higher than when scanning in the opposite direction from 150 °C to 20 °C, possibly because of the reduction of residual water and self-condensation of the phosphonic acid groups. The proton conductivities of dry PEM followed the Arrhenius equation. However, in a fuel cell PEM contains a variable quantity of water produced at the cathode; thus membrane conductivities at different RH should be known. In general, at constant temperature the proton conductivity follows the relation: ln σ ≅ B0 + B1(RH), where Bi are parameters. The data plotted as σ vs. WU (not RH!) reach a plateau at high water content.
• Thermal analyses (e.g., TGA, differential thermal analysis (DTA), DSC) of the HTPB membranes follow the same procedure as that for HTP, discussed earlier. Evidently, the presence of two polymers may be affected by trans-reaction, by the unexpected effects of one set of additives on the other polymer set, etc. Also, at higher concentration of acidic groups they may convert into anhydrides.
• The accelerated membrane degradation tests include: Fenton test, thermal degradation test, potential load cycling, and relative humidity cycling. The Fenton’s test determines PEM chemical resistance. Thus, 20 ppm FeSO4 is dissolved in H2O2, the membranes are immersed in the solution at 80 °C for 6 h. Next, the PEM is washed with H2O, dried under vacuum at 60 °C for 3 h, and weighed. The PEM resistance to oxidation is judged by the absence of weight loss and increased brittleness. 86
• Morphology is of key importance for the performance of polymer alloys and blends (PAB). Diverse microscopic and spectroscopic methods have been used. Optical microscopy (OM) and polarized optical microscopy images are important for highly polydispersed morphologies. These should be measured using a heating plate and environmental chamber with dry N2. Scanning electron microscopy (SEM) and field emission SEM are versatile sources of micrographs in a wide range of magnification. For example, SEM offers informative images of the PEM surface and cross sections (sputtering with Au/Pd may be required). The transmission electron microscopy (TEM) images require labor-intensive specimen preparation, including preparation of carbon replicas, but it may be the best choice for high resolution, nanoscale imaging. The atomic force microscopy (AFM) expands its applicability from microscopy to the nanoscale mechanical and viscoelastic tester. The acoustic microscopy (AM) has been known for over 30 years and it found new application in polymer blends. AM uses phase-contrast ultrasonics (e.g., 1.2 GHz frequency) for detecting variation of polymer rigidity (e.g., the presence of voids between polypropylene (PP) spherulites); thus in principle it may provide direct information on the strength of the interphase between the polymeric components.87
3.5 Solar cell (SC) applications
Solar cells (SCs) or photovoltaic (PV) devices convert sunlight into electricity. A. Edmond Becquerel is credited with the discovery of the PV effect in 1839. However, the phenomenon remained of little practical interest until 1954, when a photocell based on high purity crystalline silicon p–n junction increased the eff ciency of solar energy-to-electricity conversion to 4.5–6.0%.88 Figure 3.3 displays the historical increases of PV efficiency based on inorganic or organic material. The data are for different con-structions and materials, for example the inorganic cells are based on Si, Ge, GaInP or GaInAs. The increase of efficiency is spectacular – from 0.5% in 1942 to 40.8 % in 2008, and 42.43% in 2010.89–91 The organic PVs comprise dye-sensitized,92,93 low molecular weight or polymeric organics as well as inorganic/organic hybrids.94 Green et al. published lists of the independently confirmed efficiencies for SCs separated into individual categories.95
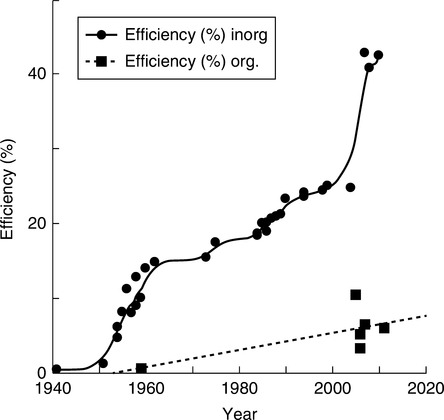
There are fundamental differences between the inorganic SC and the organic SC (OSC). In the former, the charge carriers (electrons and holes) are not tightly bound to each other, and once separated from each other by electric field they travel to the respective electrodes. In OSCs the electrons and holes form strongly bound excitons, which dissociate at electrode interfaces or within the interphase between organic donor and acceptor. Furthermore, in OSCs the majority of carriers exist in different phases and their movements create the current.96 The difference in the mechanism of charge generation is the fundamental reason for the difference in their level of efficiency, dramatically evident from the data in Fig. 3.3.
Polymeric solar cells (PSCs) are a type of OSC. They are being intensely studied as alternatives to inorganic SCs, replacing expensive raw materials and the costly, high temperature and high vacuum manufacturing technology. Considering the well-established large-scale polymer processability, it is expected that PSCs will be more economic, especially on large-scale production. Furthermore, PSCs offer toughness, pliability, flexibility and light weight. These advantages over the crystalline systems counterbalance the low efficiency and photo-degradability, the latter solvable by proper SC design and stabilization.97 Evidently, the needs for energy production in space and on the ground, for large-scale electricity production and supplying of electronic devices, are quite different and it is most likely that the current development will end with solar cells of different types being optimized for different needs.
From the view of construction, there are four types of photovoltaic solar cells:
Single layer cells are those where a 40 to 200 nm thick layer of organic electronic material is deposited between the two metallic conductors, in which transparent indium tin oxide (ITO) is the hole collector and a layer of AI, Mg or Ca is an electron collector. For example, poly(9,9′-dioctylfluorene-co-benzothiadiazole) (F8BT), poly(9,9′-dioctylfluorene-co-bis-N,N′-(4-butyl-phenyl)-bis-N,N′ -phenyl-1,4-phenylenediamine) (PFB), and their blends were used as PV with the power conversion efficiency, PCE = 0.1–0.5%.98
Bi-layer cells are those with the two photo active semiconducting components placed one over another, for example a conjugated polymer as electron donor (polyphenylenevinylene) and an acceptor (red emitting polyf uorene) with PCE = 1.5%.99,100
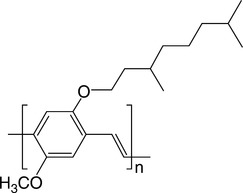
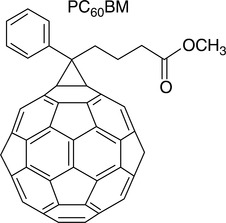
Bulk heterojunction (BHJ) cells have blended donor and acceptor forming large interphase. These solar cells are mostly made of poly-conjugated polymer (donor) and a fullerene derivative (acceptor). They have several advantages over single- and bi-layered cells, namely a thick active layer, a large interphase area created by an interpenetrating and co-continuous morphology, as well as relative ease of processing. All these translate into improved efficiency. Thus, the multilayered structure is composed of ITO / the anode buffer blend of poly(3,4-alkenedioxy-thiophenes):poly(styrene sulfonate) (PEDOT:PSS)/the active blend layer of poly[2-methyl, 5-(3′,7′-dimethyloctyloxy dimethyl-octyloxy)-p-phenylene vinylene]: [(6,6′)-phenyl C61-butyric acid methyl ester] (PMDMOPPV:PC60 BM) and LiF/AL gave PCE = 2.5%.142 (see Figs 3.4 and 3.5).
The phase segregation in BHJ systems is of critical importance, but difficult to determine (nm scale and a gradient in the thickness direction). The best method is the use of AFM and TEM on cross-sectioned specimens. Recently Venkataraman et al . discussed a variety of molecular architectures for the packing of π-conjugated organic molecules to structures relevant for PV devices. The aim has been to optimize and balance the charge transfer interactions and packing interactions in PV through nanoscale segregated morphologies for efficient charge separation and transport.101
Creation of reproducible morphology of immiscible blends is notoriously difficult. The task is simpler when the system comprises a block copolymer (BCP).69 Accordingly, instead of blending a conjugated polymer with fullerene derivative, one may start with such a polymer having grafted fullerene side groups. Now, the equilibrium morphology depends on the copolymer composition and, if reproducibly cast and annealed, it should form reproducible morphology. Recently Topham et al . reviewed the application methods of block copolymers in photovoltaic devices.102 The copolymers are expected to overcome the two principal weaknesses of OSCs, namely the lack of long-term stability and poor efficiency. Considering the multi-parameter inf u-ences on efficiency of BCP devices, optimization may be long and difficult (the current maximum value of BCE-based OSCs is PCE = 1.7%).
Other solutions may also lead to self-assembly of well-designed morphologies. For example, building liquid crystals with attractive-repulsive oligochain ends creates such a possibility.103 Park et al. used not synthetic, but an engineering approach to the problem by controlling ‘evaporation of solvent through a surface of encapsulating and induced alignment (ESSENCIAL)’. The key is the use of a vapor-permeable cover layer, which allows for solvent evaporation while protecting the PV surface, but still allowing for the shear flow under application of pressure. The process (applicable to a roll-to-roll processing) leads to an optimized morphology, more uniform distribution of components and control of crystallinity.104
Getachew et al. recently published an interesting new BHJ composition.105 The authors reported that PSC blends perform better when a fullerene-derivative (PC60BM acceptor) is blended with a 1:1 mixture of two thiophene-based polymers, D1 and D2, having the same conjugated backbone but different types and volume fraction of alkoxy side chains on the phenylene-ethynylene unit (Fig. 3.6).
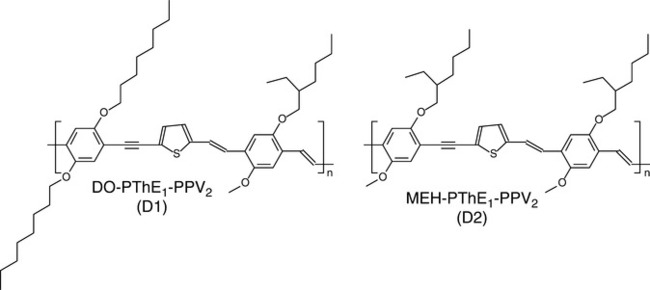
The blend enhanced charge carrier mobility, which improved the ternary blend photovoltaic performance in comparison to binary blends of D1 or D2 with PC60BM. The AFM showed that the improvement is related to finer morphology in the ternary system of the active layer.
Kimber et al. carried out the first simulation of bi-continuous structures (e.g., disordered blend, gyroid and vertical rods) for PSCs. The morphology influences device performance as the interface between the electron and hole transporting phases divides the volume into two disjoint subvolumes. The simulated I–V characteristics that disordered blends have lower performance than gyroids, but the morphology of vertical rods is the best.106
Tandem or multi-junction cells are built with two or more subcells (absorbing in different wavelength) arranged in stacks. From the point of view of electrical performance they may be considered connected in series, with the voltage given by the sum of subcell voltages and the current limited by theminimal of the constituent subcells, i.e. open circuit voltage: ![]() and short circuit current: Isc = min(Isci). The invention of multi-junction structures was responsible for the spectacular jump of efficiency in Fig. 3.3. For example, working with the US National Renewable Energy Laboratory (NREL), Spire Semiconductor announced in October 2010 a record PCE = 42.43% for a triple-junction metamorphic solar cell. The tandem stack had a mismatched InGaAs cell epitaxially grown on the back-side of a lightly doped, n-type GaAs wafer, which was flipped, before GaAs and InGaP cells were grown on the opposite wafer surface.107 The psychological barrier of 50% efficiency is projected to fall within the next 10 years, assuming advancement of the current cell technology and sunlight concentrators.108
and short circuit current: Isc = min(Isci). The invention of multi-junction structures was responsible for the spectacular jump of efficiency in Fig. 3.3. For example, working with the US National Renewable Energy Laboratory (NREL), Spire Semiconductor announced in October 2010 a record PCE = 42.43% for a triple-junction metamorphic solar cell. The tandem stack had a mismatched InGaAs cell epitaxially grown on the back-side of a lightly doped, n-type GaAs wafer, which was flipped, before GaAs and InGaP cells were grown on the opposite wafer surface.107 The psychological barrier of 50% efficiency is projected to fall within the next 10 years, assuming advancement of the current cell technology and sunlight concentrators.108
By contrast with the crystalline semiconductors, the efficiency of tandem OSCs is much lower. For example, tandem cells made from a combination of a poly(3-hexylthiophene-2,5-diyl):[6,6]-phenyl-C61-butyric acid methyl ester and a Cu-phthalocyanine:fullerene subcells gave PCE = 4.6%, i.e., approximately a sum of efficiencies of individual subcells.109
The OSCs are built using electron donor and acceptor PV or thin-film p-n semiconductors, which may be deposited on other polymers for solar cell applications.110,111 In most PSCs the polymers are conjugated with delocalized π-electrons, which makes them conductive, and for the PV applications they absorb light delocalizing the molecular orbitals. The process depends on the wavelength π–π* transition. In most PSCs the anode (transparent in full range of visible light) is the brittle and expensive indium tin oxide (ITO), which along with the glass substrate may be replaced by, e.g., poly(3,4-ethyl-ene-di-oxythiophene)/poly(styrene-sulfonate) (PEDOT/PSS). The efficiencies of these cells on glass and plastic substrates are comparable to those of ITO-based devices, but in bending test ITO breaks after a few cycles while the all-polymer cell shows no effect of bending after hundreds of cycles.112
Currently (see Fig. 3.3) the efficiency of the best organic SC is about 10%. The evolution of the PV techn ology may be divided into three ‘generations’:113
• The first generation was based upon thick Si-wafers, which could be etched, texturing the surface and enhancing absorption of photons. Efficiency of the laboratory-scale devices approached the theoretical limit for single junction PV of 31%.
• The second generation focused on the low cost thin film devices with low efficiency, inorganic or organic PV. The former were based on thin-films of amorphous, microcrystalline or polycrystalline Si, CdTe, and copper-indium-gallium di-selenide [Cu(In,Ga)Se2, or CIGS]. Organic PVs include those based on dyes, liquid crystals, conjugated polymers, organic glasses, etc., which show p-type or n-type semiconducting properties.
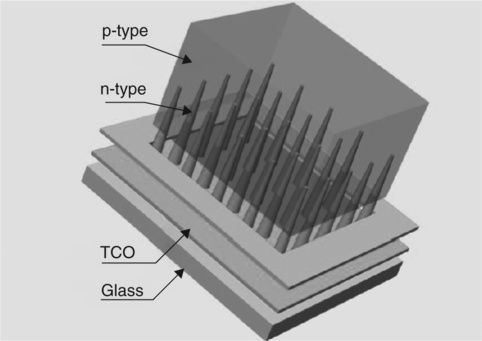
• The third generation with shaped nano-particles and quantum dots (QD) boosts the efficiency (so far only in inorganic SCs) by about 80% and may have a similar effect in PSCs. The attempt is preventing energy loss as heat (thermalization) of the photoexcited electron–hole pair and their loss (caused by the transparency to photons with energy less than the semiconductor band gap). The two effects limit the theoretical conversion efficiency of a solar cell to about 44%; without them the limit would be around 94%. Utilization of the quantum dot approach may provide a significant improvement of PV efficiency and thus better economy.114 Another approach taken at the Oak Ridge National Laboratory is the formation of n-type ZnO nanocones penetrating by around 100 nm into the p-type poly-crystalline (PX) CdTe matrix (absorber and hole trans-porter) on transparent conductive ZnO (electric field generator and electron transporter) and glass substrate (see Fig. 3.7).115 The nanocone type SC has 3.2% efficiency (without optimization), while the singlelayer, planar ZnO-PX CdTe cell has PCE = 1.8%. This circa 80% higher SC efficiency was achieved in spite of smaller area and reduced light absorption.
Since the 1950s, organic solar cells (OSCs) have been constructed using organic dyes and molecules with semiconducting properties (e.g., methylene blue, anthracene), biological molecules active in photosynthesis (e.g., chlorophylls, carotenes) and then in the 1980s, the conjugated, conductive polymers [e.g., polyacetylene (PACE), polyaniline (PANI), polysulfur nitride (SN)x]. The conversion efficiencies of around 0.1% increased ten-fold when bi-layered design was introduced, and then by additional factor of five by blending the electron donor with the acceptor, creating the bulk heterojunction. By the year 2008 the power conversion efficiency of dye-sensitized solar cells (DSSCs) under standard test conditions was PCE = 11.3%.116
Several books and reviews on organic and polymeric solar cells (OSCs and PSCs) are available.16,117–122 The use of polymers for PV applications leads to longer shelf/operating lifetimes and larger dielectric constants than other organic materials. The use of conjugated polymers as a p-type semiconductor and a derivative of the fullerene C60 as n-type material dominates bi-layer and BHJ devices with PCE = 7.4 and 8.3%.123,124 A recent patent describes an organic light emitting diode-PSC device in the form of a multi-layered sandwich. 125 The BHJ-type polymer layers are 50 to 200 nm thick and made of, for example, poly(3-hexylthiophene)/[6,6]-phenyl C61-butyric acid methyl ester (P3HT/PCBM). Other polymers may be used as the donors, for example, poly[2-methoxy-5-(3,7-dimethyloctyloxy)-1,4-phenylene vinylene] (PMDMO-PPV), or poly(2-methoxy-5-(2′-ethyl-hexyloxy)-1,4-phenylene vinylene) (PMEH-PPV). Besides PC60BM, [6,6]-phenyl C71-butyric acid methyl ester (PC70BM), or single-walled carbon nanotubes (SWNT) may be used as the acceptor. The two new derivatives of C70-fullerene: (1) phenyl-C71-propionic acid propyl ester (PC70PP) and (2) phenyl-C71-propionic acid butyl ester (PC70PB), are expected to increase efficiency of this type of PSC. Their blends with PMDMOPPV or P3HT as a donor polymer showed better miscibility and performance (e.g., 10% higher short circuit current density).126 Recent articles describe efficient PSCs based on modified P3HT or a new broad band gap donor-acceptor conjugated copolymer with 2-alkylthiophene-sub-stituted benzodithiophene (BDT) donor segment and a thiazolo[5,4-d] thiazole (TTZ) acceptor unit (PBDTTTZ).127,128
For the PSC to become competitive with the inorganic SC their PCE should increase to over 10% and lifetime to over 1 year.16 The great advantages of OSCs or PSCs are their weight, flexibility and ease of processing, either from solution or film extrusion and printing. Because of the desired conjugation, planarity of the polymeric chains and slenderness of their layers, they are readily attacked by O2 and humidity. Some years back, when these problems started affecting longevity and performance of the conducting ‘polymer wires’, the solution was a co-extrusion coating with a barrier polymer. This method, as well as an increase of the polymer oxidation potential, is being explored for PSCs. Furthermore, there is a continuous development of the electron donor and acceptor materials (including the self-assembly systems) that engender specific and stable morphology.129 In 2008 Konarka Technologies started production of polymer-fullerene SCs with the GW/y capacity, initially for laptop-recharging briefcases, tents, umbrellas, and as semi-transparent window tinting; the future for PSCs looks bright (no pun intended).
3.6 Characterization of HTPBs for polymeric solar cells (PSCs)
As was the case for the fuel cells, the characterization methods for PSCs may be divided into the three categories:
Evidently, the methods for characterization of polymers and their blends do not vary much with their intended applications, excepting tests for specific critical properties for the envisioned purposes. In the case of PSCs the most important is the ability to convert light into electricity and vice versa, which very much depends on the construction and molecular as well as domain morphologies. Thus, in this section the characterization of SCs will be outlined.
The process of conversion of light into electricity by an OSC follows these steps.
• Absorption of a photon by active layer creating excitons, i.e., electricallyneutral electron-hole pairs.
• Diffusion of excitons to the donor/acceptor interface where they separate into charge carriers: electrons excited to the lowest unoccupied molecular orbital (LUMO) leaving holes in the highest occupied molecular orbital (HOMO). The HOMO-to-LUMO energy difference is known as the band gap < 4.8 eV.130
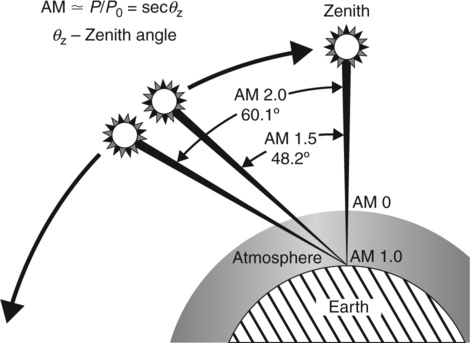
The SC is characterized by its current–voltage dependence measured under standard solar simulator (CEI/IEC 904-3) as global air mass 1.5 (AM 1.5G) with the power density of 1000 W/m 2 corresponding to spectral intensity distribution for wavelength 250–2500 nm and at an incident angle of 48.2° (Fig. 3.8).131 The intensity of the illumination should be verified before the measurements using a calibrated silicon diode with known spectral response. Several PV parameters should be defined. 132
• Open circuit voltage (Voc) – The maximum voltage across a PV cell in sunlight when no current is flowing.
• Short circuit current (Isc) – The current that flows through an illuminated solar cell when there is no external resistance, thus when the electrodes are short-circuited.
• Power (Pin, Pe) – The incidental power of solar radiation, and electrical power generated by the PV cell, respectively.
• Maximum power point (Impp, Vmpp ) – The point on the I−V curve where the maximum power is produced: ![]() (see Fig. 3.9).
(see Fig. 3.9).
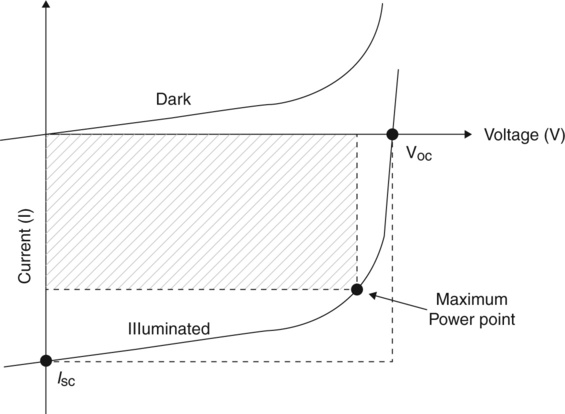
• Fill factor (FF) – The ratio of a photovoltaic cell’s actual maximum power output to its theoretical power output. FF depends on the fraction of charge carriers reaching the electrodes compared to those that recombined, thus on τμ, where τ is the lifetime and μ the mobility.
• Power conversion efficiency (PCE or ηPCE) – The ratio of power output to power input.
• External quantum efficiency (EQE) – The percentage of photons hitting the photoreactive surface that produce an electron–hole pair in photo-sensitive devices – a measure of the device’s electrical sensitivity to light, thus:
with e = 4.80320427(12)×10– 10 statcoulomb being the elementary charge.
Depending on the PV design, location of the EQE maximum ranges from λ = 400 to 1000 nm.
These quantities are interrelated, namely
For accurate PV measurements one uses a solar simulator with a light spectrum similar to that of AM 1.5G and a calibrated reference cell to set the intensity. The SC measurement is divided into two steps: (a) the determination of the solar simulator spectral mismatch factor, M; and (b) measurement of the I–V curve of the solar cell referenced to standard test conditions (STC). The match between the simulator and the AM1.5G reference spectra [ES(λ) and ER(λ), respectively] is not perfect. Furthermore, while for crystalline Si SCs, M = 1.00 ± 0.02 (stable calibrated reference cells are available), for OSCs suitable and stable reference cells do not exist – in this case M = 0.9 was reported.133
The maximum available current and voltage (Impp, Vmpp) of a p-n junction device is given by the quasi Fermi levels of n -doped and p-doped semicon-ductor energy levels. In OSCs, Voc varies linearly with the HOMO level of the donor and the LUMO level of the acceptor. The Isc is given by the density of absorbed photons per unit volume (n), the elementary charge (e), the device-dependent mobility (μ), and the electric field (E): Isc = neμE. Tests are carried out either under vacuum, in Ar or N2, under AM 1.5G of white light irradiation by a Xe-lamp solar simulator.
The current–voltage (I–V) dependence of PV may be measured using any programmable instrument, capable of measuring I and V simultaneously such as, for example, a Keithley Source-Meter with the ability to measure voltage: 10 μV to 110 V and current: 10 fA to 100 mA.134–136 The incident photon-to-current conversion efficiency can be measured with Stanford research systems (SRS) lock-in amplifier coupled with monochromator under dark and white light source, in which light intensity was calibrated at each wavelength, using a standard Si PV cell. Other light sources have also been used, such as tungsten-halogen with UV and IR filtered out or a quartz-halogen. 137,138 The measured Isc values of PSCs need to be corrected to the values corresponding to the AM 1.5G reference. This is done by adjusting the solar simulator in such a way that: Isc = Isc,ref/M. Next, PCE, FF and other power conversion parameters may be calculated from Equation [3.3].133,139,140
Quantum efficiency spectra (EQE vs. λ) are measured using a lock-in amplifier for Isc from short-circuited devices illuminated by chopped light from a tungsten-halogen lamp filtered by a monochromator. The incident power is determined using a calibrated photodiode, with typical power densities of L = 0.1–1 mWcm− 2 and quantum efficiency EQE(λ) = 1240Isc/λL. The internal quantum efficiency (IQE) was determined from the amount of light absorbed by the blend via the ultraviolet-visible (UV-vis) measurements of the film on fused silica.138
It has been noted that the Voc of PV containing thiophene-based polymers linearly increases with the onset of oxidation potential (OOP), proportional to the HOMO position of the donor polymer. 141,138 The OOP was determined electrochemically by cyclic voltammetry (CV). The experiments were carried out on thin films at room temperature (RT) in a glove box under dry Ar using a computer-controlled potentiostat with Pt-foils electrodes and Ag/ AgCl coated, calibrated reference electrode (RE). The OOP was taken as the position where the oxidation current started deviating from the baseline. The accuracy of the measurement was confirmed using the electrochemical voltage spectroscopy (EVS).
The full range of microscopes has been used for characterization of PV morphologies. AFM is used for studying the morphology of polymer blends, surface of films cast from solutions with various solvents, as well as the blend structures at cross section.98,142 After determining with AFM thickness of the film active layer and the surface morphology, the absorption spectra was measured using a UV-vis spectrophotometer. The tests were done under N2.138,143–145
TEM has been used extensively for studying morphology and its evolution in polymer blends, including those employed in PV devices. Variation of polymer concentration, type of solvent, annealing, aging, etc., all affect the morphology and hence performance. TEM has an additional advantage as it allows performing selectedarea electron diffraction (SAED). As an example, MDMO-PPV films prepared with 20–90 wt% PCBM were observed in TEM bright-field mode. SAED analysis showed that observed clusters consisted of PCBM nano-crystals with random crystallographic orientations. The TEM observations and acquisition of SAED patterns were conducted in a TEM operated at 80 kV Annealing MDMO-PPV above its Tg accelerated the phase segregation and in the formation of large PCBM single crystals, thus indicating that the thermal stability may be the limiting factor of these SCs.146
SEM scans the specimen surface with a high-energy electron beam. The microstructures of the deposited PAB films are studied in SEM as film surface and microtomed cross sections. For enhancing the contrast between PAB phases, partial dissolution (by solvent vapor) or erosion (by plasma treatment) may be needed. Furthermore, for preventing accumulation of the static electricity on the specimen surface, a thin layer of Au/Pt may be deposited. The specimens are placed on a platinized silicon wafer holder with a conductive adhesive copper tape. The modern SEM has high resolution, revealing details less than 1 nm in size. With a large depth of field it gives a characteristic 3D appearance of the surface structure. 147
UV-vis refers to absorption spectroscopy in the ultraviolet-visible spectral region. The absorption in the visible range directly affects the perceived color of the chemicals involved. The UV-vis spectra are measured using spin casted films, or dilute polymer solutions. Films are more representative for the active layer behavior in SCs, while solutions are more reliable when comparing the different polymers or blends. For example, the film deposited on ITO substrate may be dissolved in a suitable solvent (e.g., in chloroform at concentration of 25 μg/mL, in 10 mm quartz cell) and either directly used in a spectrometer, or spin casted on glass slides, vacuum dried and measured at the wavelength 280 to 900 nm at a rate of 300 nm/min.135
FT-IR with the attenuated total reflectance (ATR) is an analytical technique used for identifying mainly organic materials. ATR projects a wave into a specimen through a Ge, Si, ZnSe or diamond crystal. Thus the sample may be analyzed directly, without dissolving, or grounding with KBr.148 The FT-IR/ATR system measures the absorption of various infrared light wave-lengths by the material, identifying specific molecular dynamic elements and structures. The method is used primarily by synthetic chemists for identif cation of reaction products, although 1H and 13C NMR is often used as the principal method (see below).
NMR 1H and 13C spectra were measured for identification of the structure of a new bi-indene C70-derivative (BC70MA; an acceptor) for PSCs with poly(3-hexylthiophene) (P3HT; a donor). Chemical shifts were reported in ppm relative to the singlet of CDCl3 at 7.26 and 77 ppm for 1H NMR and 13C NMR, respectively149,150 Woody et al. used FT-IR and 1 H NMR for determining the end groups of the donor-acceptor-donor (DAD) tri-block copolymers.151
XPS (X-ray photoelectron spectroscopy or ESCA = electron spectroscopy for chemical analysis) has been frequently used for the determination of local surface composition of a PV blend to the depth of < 10 nm.104,152
X-ray diffraction (XRD) has been used for investigation of crystallinity in materials. The X-ray source may be any that generates X-rays, for example, synchrotron, cyclotron, X-ray tube with a monochromatic Cu-Kα1 radiation, diffractometer and a programmable scanning capability with speed of around 1°/min. These instruments may be used for determining interlayer spacing within a crystalline material (polymers, carbon nanotubes, or minerals) and phase content of powders and coatings.153,154
SAXS (small-angle X-ray scattering) may be performed at a synchrotron facility. Powder specimens are loaded into glass capillaries and inserted into aluminum cassettes which had a 1.5 mm hole with ± 15° angular range. The cassettes are inserted into a thermostatic stage mounted in a vacuum chamber and centered on the beam-line with the incident beam energy of 8 or 16 keV (λ = 1.55 or 0.775 Å, respectively). Two-dimensional SAXS images are recorded around 1.2 m from the sample at T ≤ 250 ± 0.1 °C.150
TGA is used for determining volatiles content and/or thermal stability of materials, by monitoring the weight loss on heating (see Section 3.4.1).
SEC (previously gel permeation chromatography, GPC). The molecular weight and its polydispersity in polymers or copolymers are determined in SEC with Styragel or PSS SDV chromatographic columns, a gradient pump, automated sample injector and suitable detectors (e.g., UV/vis set to 250 nm, multi-angle laser light scattering, MALLS, at λ = 658 nm, refractive index, solution viscosity, and others). Traditionally the instrument is calibrated with anionic, narrow MWD PS standards.135 For example, SEC and 1H NMR spectroscopy were used for identifying the tri-block DAD copolymer structure.151 Absolute molecular weights were determined by light scattering with dn/dc values calculated using the RI detector and assuming 100% mass recovery of the injected sample.150
3.7 Aerospace applications
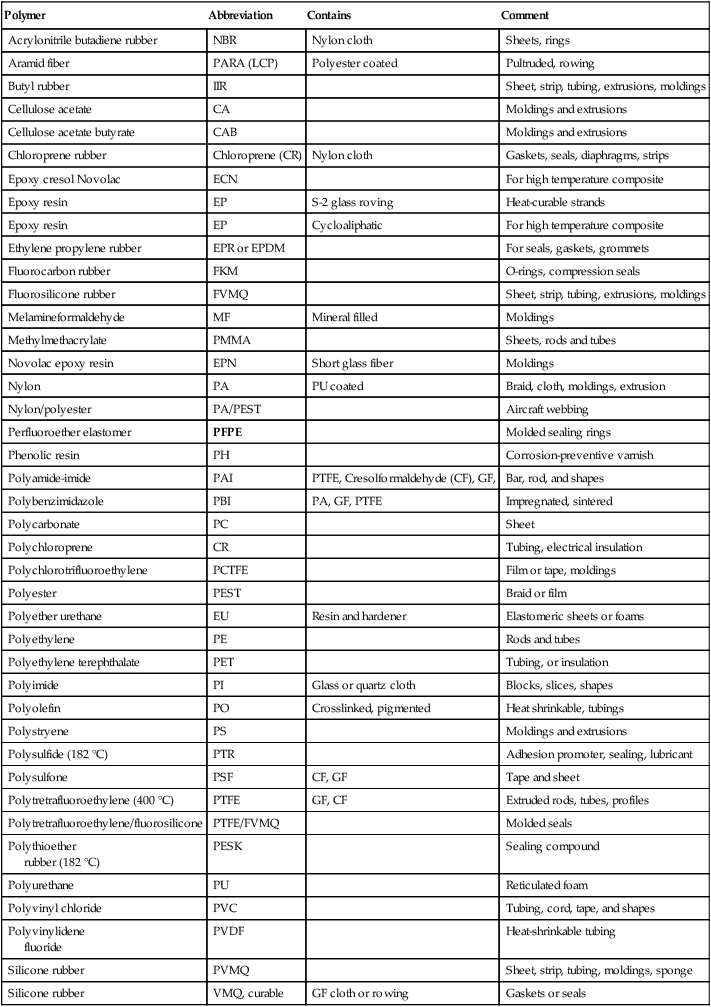
Several books and reviews discussing the high temperature materials used in construction of aerospace vehicles are available.155–157 The Society of Aerospace and Automotive Engineers (SAE) develops standards for materials, parts and construction of powered vehicles. Currently there are 434 active standards.158 Table 3.3 provides an extracted list of examined polymers, their blends and composites. Evidently, these commercial materials are to be used not only in aerospace applications. However, many of the standards deal with high performance polymeric systems, for example, fluorosilicone thermoset elastomer with a range of operating temperatures from –85 °C to + 230 °C, or high temperature engineering and specialty resins, blends and composites with glass or carbon fibers, etc.
Table 3.3
Summary of SAE polymers and blends standards (HTPs are in bold)163
| Polymer | Abbreviation | Contains | Comment |
| Acrylonitrile butadiene rubber | NBR | Nylon cloth | Sheets, rings |
| Aramid fiber | PARA (LCP) | Polyester coated | Pultruded, rowing |
| Butyl rubber | IIR | Sheet, strip, tubing, extrusions, moldings | |
| Cellulose acetate | CA | Moldings and extrusions | |
| Cellulose acetate butyrate | CAB | Moldings and extrusions | |
| Chloroprene rubber | Chloroprene (CR) | Nylon cloth | Gaskets, seals, diaphragms, strips |
| Epoxy cresol Novolac | ECN | For high temperature composite | |
| Epoxy resin | EP | S-2 glass roving | Heat-curable strands |
| Epoxy resin | EP | Cycloaliphatic | For high temperature composite |
| Ethylene propylene rubber | EPR or EPDM | For seals, gaskets, grommets | |
| Fluorocarbon rubber | FKM | O-rings, compression seals | |
| Fluorosilicone rubber | FVMQ | Sheet, strip, tubing, extrusions, moldings | |
| Melamineformaldehyde | MF | Mineral filled | Moldings |
| Methylmethacrylate | PMMA | Sheets, rods and tubes | |
| Novolac epoxy resin | EPN | Short glass fiber | Moldings |
| Nylon | PA | PU coated | Braid, cloth, moldings, extrusion |
| Nylon/polyester | PA/PEST | Aircraft webbing | |
| Perfluoroether elastomer | PFPE | Molded sealing rings | |
| Phenolic resin | PH | Corrosion-preventive varnish | |
| Polyamide-imide | PAI | PTFE, Cresolformaldehyde (CF), GF, | Bar, rod, and shapes |
| Polybenzimidazole | PBI | PA, GF, PTFE | Impregnated, sintered |
| Polycarbonate | PC | Sheet | |
| Polychloroprene | CR | Tubing, electrical insulation | |
| Polychlorotrifluoroethylene | PCTFE | Film or tape, moldings | |
| Polyester | PEST | Braid or film | |
| Polyether urethane | EU | Resin and hardener | Elastomeric sheets or foams |
| Polyethylene | PE | Rods and tubes | |
| Polyethylene terephthalate | PET | Tubing, or insulation | |
| Polyimide | PI | Glass or quartz cloth | Blocks, slices, shapes |
| Polyolefin | PO | Crosslinked, pigmented | Heat shrinkable, tubings |
| Polystryene | PS | Moldings and extrusions | |
| Polysulfide (182 °C) | PTR | Adhesion promoter, sealing, lubricant | |
| Polysulfone | PSF | CF, GF | Tape and sheet |
| Polytretrafluoroethylene (400 °C) | PTFE | GF, CF | Extruded rods, tubes, profiles |
| Polytretrafluoroethylene/fluorosilicone | PTFE/FVMQ | Molded seals | |
| Polythioether rubber (182 °C) |
PESK | Sealing compound | |
| Polyurethane | PU | Reticulated foam | |
| Polyvinyl chloride | PVC | Tubing, cord, tape, and shapes | |
| Polyvinylidene fluoride |
PVDF | Heat-shrinkable tubing | |
| Silicone rubber | PVMQ | Sheet, strip, tubing, moldings, sponge | |
| Silicone rubber | VMQ, curable | GF cloth or rowing | Gaskets or seals |
3.7.1 HTPBs in the Solar Impulse aircraft
In 2003 Piccard and Borschberg from the École Polytechnique Fédérale de Lausanne (EPFL) initiated construction of the Solar Impulse – a fixed-wing aircraft that will circle the world on solar power.159,160 The prototype, Solar Impulse HB-SIA, successfully passed all the tests. The advanced polymers used in its construction are listed in Table 3.4.161
Table 3.4
Material used in construction of Solar Impulse HB-SIA
| Chemical name | Trade name |
| Aromatic polyamide, PARA | Ixef |
| Carbon fibers, CF | Low density |
| Perfluoropolyethers, PFPE | Fomblin |
| Poly(ethylene-co-chloro tri-fluoro ethylene), ECTFE | Halar |
| Polyamide-imide, PAI | Torlon |
| Polycarbonate, PC | Macrolon |
| Polyetheretherketone, PEEK | Keta Spire |
| Polyphenylene sulfone, PPSU | Radel |
| Polyphthalamide, PPA | Amodel |
| Polyvinylidene fluoride, PVDF | Solef |
| Self-reinforced polyphenylene ether, SRP | Primo-Spire |
3.7.2 HTPBs in the IKAROS (Interplanetary Kite-craft Accelerated by Radiation of the Sun) spacecraft
The Japan Aerospace Agency (JAXA) experimental solar-sail spacecraft, IKAROS, was launched on 21 May 2010. Seven months later it passed Venus at a distance of about 80 800 km, successfully completing the planned mission. As a reward, JAXA extended the mission to March 2012.162 The spacecraft is in the form of a 14×14 m square sail, made of a 7.5 μm thick sheet of PI. Embedded in the sail, an array of amorphous silicon SCs provides the needed electrical power, while a liquid crystal device (LCD) controls the attitude by sunlight absorption/ref ection.163,164 One of the reasons for the mission’s extraordinary success was the performance of the materials, especially the new PI ultra-thin film. Development of PI for the gossamer spacecrafts was described by Iwata et al. in 2009.165 For the standard PI the high radiation resistance was in conflict with the thermoplasticity. In the new macromolecules, the authors incorporated non-symmetrical di-anhydrides and highly flexible aromatic ether units, which assured that the new PI are highly stretchable and resistant to radiation. For testing the material designed for deep space, the radiation durability was tested with proton beams under high vacuum.
3.7.3 HTPBs in the NASA polymeric spherical electrostatic shield
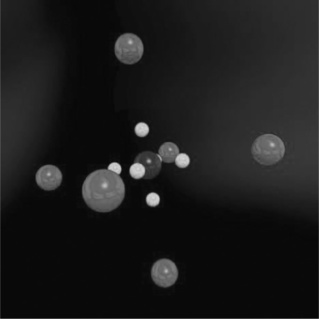
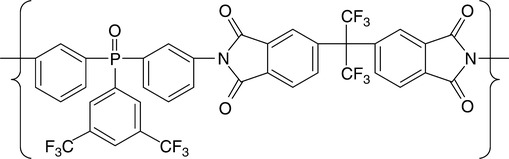
For several decades NASA evaluated diverse electrostatic shielding systems for spacecraft radiation protection.166 The present passive shielding uses PE and is being employed on the International Space Station (ISS). The active shielding would generate the opposite charges, for example, positive to repel protons and negative to affect the low energy electrons. Thus the concept led to the design of three charged spheres surrounding the spacecraft. To avoid the huge penalty of the extra mass, the final step collapsed the spherical shields into charged spacecraft and six positively charged spheres (kept at + 300 MV) and six negatively charged spheres (–300 MV) strategically placed around the spacecraft, in a pattern resembling a classic quadrupole (see Fig. 3.10). The keys to project success are the materials, configuration, power supply, and effectiveness compared to the passive shields. The polymer must be resistant to atomic oxygen (AO) and radiation (UV, VUV, γ, cosmic, galactic), as well as having suitable thermal, dielectric and mechanical properties. The polymers considered for the shielding spheres are listed in Table 3.5. The proposed conductive spheres would have four layers: TiO2-filled PI, liquid crystal polymer (LCP) fabric, PI and a thin layer of Au on the interior. Figure 3.11 shows the structure of TOR-NC, a fluorinated, triphenyl phosphine oxide based PBI.
Table 3.5
Room temperature DC dielectric and ultimate tensile strengths
| Material | Source | Dielectric strength (kV/mm) | Tensile strength (MPa) | ||
| 1 | Kapton® HN | PI | DuPont | 303 | 231 |
| 2 | Kapton® FN1 | PI | DuPont | 272 | 207 |
| 3 | Upilex® | PI film | UBE | 272 | 362 |
| 4 | Apical® | PI film | Kaneka | 320 | 303 |
| 5 | LaRC™ CP1 | PI | SRS Technologies | ND | 112 |
| 6 | LaRC™ CP2 | PI | SRS Technologies | ND | 131 |
| 7 | Ultem™ | PEI | GE | 33 | 127 |
| 8 | TOR-LM | PAEBI* | Triton Systems | 127 | 104 |
| 9 | TOR-NC | PAEBI-F† | Triton Systems | 190 | 114 |
| 10 | Mylar® | PET | DuPont Teijin | 433 | 216 (Molecular dynamics calculation (MD)) |
| 11 | Teflon® | PTFE | DuPont | 18 9 | 31 |
| 12 | FEP Teflon® | FEP | DuPont | 53 | 23 |
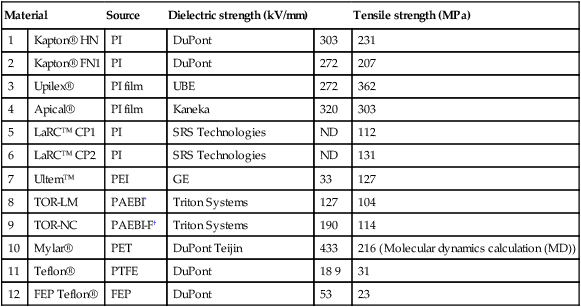
*TOR = Triton oxygen resistant, TOR-LM = low modulus co-poly(arylene ether benzimidazole);
†TOR-NC is a fluorinated, triphenyl phosphine oxide based PBI.
Trans-polyoctenamer rubber (TOR)-LM, TOR-NC, Upilex, the PI used in IKAROS, and several other polymers have been specifically designed for space.167–171 Similarly, blends and filled thermoplastics or thermosets have been designed for such use, for example, blends of poly(vinylidene fluoride)/polyaniline (PVDF/PANI),172 or polyether ether ketone/polysulfone (PEEK/PSU),173 or polyimide/epoxy (PI/EP),174 or self-lubricating MoS2-filled PEEK.175 In many cases the name hides the multi-ingredient nature of the polymer known by its trade name. In short, for most aerospace applications a combination of materials from Tables 3.3 to 3.5 is used – the choice depending on the function, expected lifetime and cost.
3.8 Characterization of HTPBs for aerospace applications
Aerospace materials are being tested for diverse purposes, for example, in research and development, for quality control, failure analysis, material certif cation, system design. The tests include analytical (chemical) and physical (mechanical, electrical, thermal, optical, and rheological) measurements as well as evaluation of flammability, physical and chemical (weathering).176 Furthermore, these materials require tests that offer an insight into their behavior in the hostile environment of a low Earth orbit (LEO) as well as in deep space, namely, vacuum, radiation, large temperature differences and a combination of these factors. The high power lasers have found numerous uses for testing the spacecraft materials.177
LEO is def ned as being at 160–2000 km above the Earth’s surface (thus where the ISS and a majority of artificial satellites orbit the Earth). Objects in LEO are exposed to vacuum, UV and low density of atmospheric gases that on the one hand engender drag and on the other affect the stability of the polymeric components; for example, AO transforms PI surface into micrometer-sized roughness, known as a carpet shape.178 Recently, 39 polymers were exposed to AO erosion for 3.95 years on an ISS surface (some samples for 5.8 years). The AO erosion was calculated from the weight loss and density, following the ASTM E 2089–00. Additional erosion tests performed on the ground are also described. As shown in Table 3.6, the fluorinated polymers resisted the AO erosion best, while the polymers with a large quantity of oxygen the worst; polyimides (PI) such as Kapton® H performed rather poorly
Table 3.6
Atomic oxygen erosion yield 178
| Material (abbreviation) | Erosion yield, 10–24 (mL/atom) |
| Crystalline, white polyvinyl fluoride (White PVF) | 0.101 |
| Polytetrafluoroethylene (PTFE Teflon) | 0.142 |
| Perfluoroalkoxy copolymer resin (PFA) | 0.173 |
| Amorphous fluoro polymer (AF) | 0.198 |
| Fluorinated ethylene propylene (FEP Teflon) | 0.200 |
| Pyrolytic graphite (PG) | 0.415 |
| Poly-(p -phenylene terephthalamide) (Kevlar, PPDT) | 0.628 |
| Chlorotrifluoroethylene (Kel-f, CTFE) | 0.831 |
| Polybutylene terephthalate (PBT) | 0.911 |
| Polyimide (biphenyl tetracarboxylic acid dianhydride, BPDA) (Uplex S) | 0.922 |
| Tetrafluorethylene-ethylene copolymer (Tefzel, ETFE) | 0.961 |
| Acrylonitrile butadiene styrene (ABS) | 1.09 |
| Polyvinylidene fluoride (Kynar, PVDF) | 1.29 |
| Poly(p-phenylene-2,6-benzobisoxazole) (Zylon, polybutyleneoxide (PBO)) | 1.36 |
| Polyacrylonitrile (PAN) | 1.41 |
| Polyphenylene isophthalate (Nomex, PPPA) | 1.41 |
| Polyurethane (PU) | 1.56 |
| Ethylene-chlorotrifluoroethylene (Halar, ECTFE) | 1.79 |
| Polyamide 66 or nylon 66 (PA 66) | 1.80 |
| Polyamide (PI) | 1.91 |
| Polyethylene oxide (PEO) | 1.93 |
| Polybenzimidazole (PBI) | 2.21 |
| Polypropylene (PP) | 2.68 |
| Polyimide (PMDA) (Kapton HN, PI) | 2.81 |
| Polysulfone (PSU) | 2.94 |
| Polyetheretherketone (PEEK) | 2.99 |
| Polyimide (PMDA) (Kapton H, PI) | 3.00 |
| Polyethylene terephthalate (Mylar, PET) | 3.01 |
| High temperature polymide resin (PMR 15, PI) | 3.02 |
| Polyvinyl fluoride (Clear Tedlar, PVF) | 3.19 |
| Polyetherimide (PEI) | 3.31 |
| Polyamide 6 (PA 6) | 3.51 |
| Polyethylene (PE) | 3.74 |
| Polystyrene (PS) | 3.74 |
| Epoxy (Hysol EA 956, EP) | 4.21 |
| Polycarbonate (PC) | 4.29 |
| Cellulose acetate (CA) | 5.05 |
| Polymethylmethacrylate (PMMA) | 5.60 |
| Allyl di-glycol carbonate (CR-39, ADC) | 6.80 |
| Polyoxymethylene; acetal (Delrin, POM) | 9.14 |
Miyazaki et al. examined a commercial (from Nippon Steel Chem.) polysiloxane-block-polyimide for its resistance to on-the-ground-performed AO erosion, based on the laser detonation system, which simulated a three month exposure on orbit at an altitude of 400 km. The erosion was compared to that of Kapton® H. The mass change measurement, cross-sectional TEM observation, and XPS analysis were performed. Results show that exposed to AO the block copolymer forms on its surface a self-organized layer of SiO2 with a self-healing capability. As a consequence, the mass loss of the block copolymer was < 1/100 of that measured for Kapton® H, i.e., performing at least three times better than the best polymer of Table 3.6, the TiO2-filled polyvinyl fluoride (PVF). It is noteworthy that the PVF with inorganic pigment had the AO erosion yield 32 times smaller than its neat, transparent PVF variety; after testing the ‘white PVF’ white powder was visible on the specimen surface.179 These two observations resemble recent communication by Fuse et al., in which the authors reported that incorporation of ≤ 2 wt% organoclay reduced the partial discharge erosion (PDE) depth of PP by about 50%.180 Apparently, the initial vaporization of PP increased the clay concentration on the surface to a level that prevented further erosion. Interestingly, the initial rate of erosion linearly decreased with clay concentration (reduction by a factor of about nine for 6 wt% clay), but the final effect was virtually independent of the clay content.181 A similar mechanism was also postulated for the flammability reduction of polymers after incorporation of clay.182
The AO erosion was found to be accelerated by radiation and vacuum ultraviolet (VUV) in LEO.183 The ground-based experimental results were obtained using a hyperthermal AO beam generated by laser detonation. The combined effects of AO and VUV are important for fundamental and engineering points of view. The VUV-sensitive PMMA and fluorinated EPR (FEP) showed no synergistic effects.184 In this case, the erosion effect was the sum of the AO and VUV effects. However, a year later Yuan et al. reported negative synergism of PMMA exposed to AO and VUV.185 Miyazaki and his colleagues165,171,186 also studied the AO and VUV erosion in LEO. The polysiloxane-b-polyimide film was exposed separately to an AO beam and a VUV beam at the JAXA Space Center in Tsukuba. Owing to formation of a protective SiO2 layer, AO erosion was small. The VUV irradiation caused a worrisome specimen discoloration, but insignificant mass loss.
The authors provided detailed information on the test facility and method of testing at the JAXA test facility.
• The AO irradiation was performed using the laser detonation facility with fluence equivalent to three months exposure on 400 km altitude simulating ISS conditions. As an internal reference Kapton H was applied.
• The UV irradiation tests were performed using a 5 kW Xe short arc lamp with a dichroic mirror with intensity 10×solar constant. The air pressure was reduced to P ~ 1.3×10− 3 Pa. The tests were carried out at wavelengths 0.2–0.4 μm, room temperature (RT) or T ~ 100 °C, for 150 equivalent sun days (ESD). There was insignifcant reduction of mechanical performance of irradiated PI evaluated near Tg . Alternatively, a deuterium (D2) lamp with MgF2 window may be used with wavelengths 0.112–0.400 μm. The specimen was mounted 30 cm from the sample and 15° from the surface normal, giving the output power of 350 μWcm− 2. A spectrometer was coupled to the vacuum chamber to perform in situ the infrared reflection-absorption spectroscopy (IRRAS). The p-polarized IR beam was directed onto the liquid-nitrogen-cooled mercury cadmium telluride (MCT) detector.185
• The surface of the irradiated films was observed in an AFM with silicon nitride tips at RT. The AFM imaged 10×10 μm areas from several spots of each specimen. The images were analyzed plotting the pixel heights vs. the lateral dimensions. The surface roughness was computed as the number and weight averages.
• The proton irradiation tests were carried out in a Tandem accelerator under vacuum (P < 2.6×10⁻⁴ Pa) with the energy of 2.6 MeV; an irradiation dose of 63 MGy reduced the elongation at break of PI by around 50 % of initial value.
• A Cockcroft-Walton accelerator was used for the electron irradiation under vacuum (P < 7.9×10⁻⁶ Pa) with accelerating potential of 200–500 kV. After the dose of 20 MGy, the decrease of elongation at break was comparable to that of proton irradiation.
• Spacecrafts in orbit are irradiated by electrons from space, which accumulate on the satellite surface. The differential charging of the external dielectrics may be as high as several kV, causing discharges and anomalies. The conductivity of space-used materials should be known for the modeling of satellite charging, but suitable methods have not been developed. A procedure was proposed for charging grounded dielectrics with one electron beam and measuring the charge decay with another.187 Once the charge decay rate is determined, the material conductivity may be calculated. The procedure is versatile for simulating space conditions (dose rate, total dose, potential, material aging, etc.).
• Mechanical testing was performed on epoxy resin toughened by incorporation of up to 17 vol% of PEI.188 The dynamic mechanical tests were carried out in DMTA at 10 Hz, in a single cantilever bending mode at T = −80 to 300 °C. The flexural properties at 23 °C were carried out using the supporting span of 48 mm (ASTM D7907; specimens: 60×10×3 mm).
• Fracture mechanics measurements were made according to ASTM E3998 at 23 °C in three-point bending at a crosshead speed of 1.3 mm/min, on sharply notched rectangular bars. Fractured surfaces were Au/Pl coated and examined in SEM. 188
• Fracture toughness was determined according to ASTM E-399 using ![]() inch compact-tension epoxy specimens toughened with dispersed LCP whiskers. 189 The latter were obtained by blending the LCP [poly(ethylene terephthalate-co-p-oxybenzoate), PET/PHB60] with Ardel-D100 (polyester of bisphenol-A and a mixture of tere-and isophthalic acids), dissolving the blend in Epon 825, curing it and causing crystallization of LCP into high aspect ratio fibrillar crystals.
inch compact-tension epoxy specimens toughened with dispersed LCP whiskers. 189 The latter were obtained by blending the LCP [poly(ethylene terephthalate-co-p-oxybenzoate), PET/PHB60] with Ardel-D100 (polyester of bisphenol-A and a mixture of tere-and isophthalic acids), dissolving the blend in Epon 825, curing it and causing crystallization of LCP into high aspect ratio fibrillar crystals.
• ASTM D5868 – 01(2008) Lap Shear Adhesion (LSA) test for fiber reinforced plastic (FRP) bonding was used for evaluating the surface modification of PBI (service temperature: –260 to + 400 °C) by exposing it to high-energy radiation and low-pressure plasma. The treatment increased LSA 20-fold.170 The surface energy of PBI was measured by the contact angle method.
• Small angle neutron scattering (SANS) studies in Grenoble used a cold source of neutrons of wavelength 1 nm at high flux.168 The curing samples, housed in a hot stage holder, permit observation of the morphology evolution. Plots of scattering intensity vs. the scattering vector, Q, offer an insight into the sample’s morphology. For example, a peak in the dependence indicates a regular structure, an interpenetrating polymer network (IPN), or a co-continuous morphology, such as formed during the spinodal decomposition (SD). The authors found significant enhancement of epoxy toughness when the disordered morphology of dispersed polyether sulfone (PES) changed into the SD-type.
• For the identification of space effects on polymers, numerous standard tests must be used, namely spectroscopy, thermal analysis, dielectric and conductivity measurements, mechanical and viscoelastic property determination, etc. In the late 1990s NASA decided to substitute polyurethane coatings (having carcinogenic) with another one.189,190 The 18 alternative candidates were subjected to 34 standard test procedures (Table 3.7). In the following report the number of candidates fell to eight, from which the best with the lowest cost-to-performance ratio will have to be selected.191 This procedure illustrates how involved the polymeric testing for space application is, even if the test procedures are quite standard.
Table 3.7
Recommended test procedures for replacement aliphatic PU coatings 192
| Screening tests for alternatives to aliphatic isocyanate urethane coatings | Common tests for alternatives to aliphatic isocyanate urethane coatings |
| Pot Life (Viscosity); ASTM D 1200 | Removability; ASTM G 155 |
| Ease of Application; SSPC-PA-2 | Repairability; ASTM D 523, 2244 and 3359 |
| Surface Appearance; ASTM D 523 and 2244 | Abrasion Resistance; ASTM D 4060 |
| Dry-To-Touch (Sanding); none | Gravelometer; ASTM D 3170 |
| Accelerated Storage Stability; ASTM D 1849 | Fungus Resistance; ASTM D 3359 and MIL-STD-810 F |
| Cure Time (MEK Solvent Rub); ASTM D 4752 | Accelerated Weathering; ASTM D 523, D 2244 and G 155 |
| Solvent (Acetone) Rub; ASTM D 4752 | Mandrel Bend Flexibility; ASTM D 522 |
| Cleanability; MIL-PRF-83282D and 85285 | 18-Month Marine Environment; ASTM D 610, 714 and 523 |
| X-Cut Adhesion by Wet Tape; ASTM D 3359 and FED-STD-141 | Cyclic Corrosion Resistance; GM 4465 P and 9540 P |
| Tensile (Pull-Off) Adhesion; ASTM D 4541 | Hypergol Compatibility; KSC MTB-175–88 |
| Knife Test; FED-STD-141 | LOX Compatibility; ASTM D 2512 and NASA-STD-6001 |
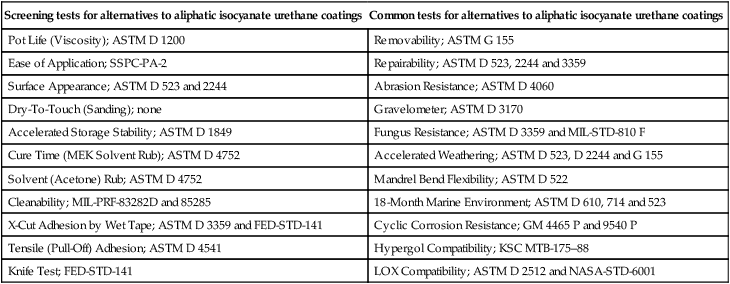
Notes : KSC, Kennedy Space Center; LOX, liquid oxygen tanks.
3.9 Summary
This chapter has described the application of HTPBs in fuel and solar cells as well as in aerospace. The three categories of HTP constitute but a small portion of the total polymer production, namely commodity, engineering, specialty and ultra categories, 95.29, 4.5, 0.2 and 0.01 wt%, respectively. By adjusting the molecular parameters and incorporating suitable additives, the commercial polymers may be formulated for a variety of other applications.
A very special category of characterization methods involves the use of HTPBs in highly demanding engineering applications such as, for example, structured membranes for gas or liquid separation at high temperature, T, and pressure, P, the fuel cell membranes and active layers in solar cells. Even more demanding are the aerospace applications, where the polymers may be exposed to wide T and P variations, hard radiation and erosion by atomic oxygen. As discussed, evaluation of the material performance for these applications requires elaborate specific test instrumentation and methods, often developed and maintained by a national organization.
The use of polymers and their blends in such areas as membrane applications is in a relatively early stage, it is expensive, and lacking efficiency and durability. In particular, for fuel cells there are intense efforts for replacing expensive Pt catalysts and polymeric per-fluoro sulfonic acid (Naf on®). Highly promising developments of these materials have been announced.193–195 Other work has focused on expanded use of PAB in electronic (e.g., as organic transistors) and optoelectronic (photovoltaics, LED) applications, as conductive material (plastic wires), bio-materials and others.196,197 Nano-particle technology is expanding to fuel and solar cell membranes. As in other fields, replacement of nano-size spheres by rods and plates offers significant improvement at low concentration.197,198 In addition, nanoparticles influence crystallization of the semicrystalline polymer in its vicinity.199 Layered clay nanoparticles, layered graphene, carbon nanotubes, metallic or metal oxide nanoparticles are used industrially. Hopefully, collaboration between the ceramic and polymer industries will yield a new family of synthetic, high temperature resistant nanoparticles with affinity to specific polymers that will eliminate the need for intercalation or compatibilization.153,200,201