
Chapter 10. Deploying, Provisioning, and Managing HyperFlex
This chapter covers the following key topics:
 Installation Phase: Explains the different steps in the HyperFlex installer process.
- HyperFlex Workload Profiler: Covers the workload profiler to extract storage and user stats.
- HyperFlex Sizer: Describes some of the tools used for planning and sizing a HyperFlex cluster to provision resources accordingly.
- Management, Provisioning, and Monitoring: Describes the different management products for managing, provisioning, and monitoring the HyperFlex cluster and nodes, including Cisco HyperFlex Connect HTML5 GUI, VMware vSphere plug-in, and Cisco Intersight Cloud management platform.
The Cisco HyperFlex Data Platform (HXDP) has simple management interfaces that allow easy provisioning, deployment, and monitoring of the HyperFlex (HX) cluster [1], [2]. Let’s start with an overview of the installation of the system and then move into the management, provisioning, and monitoring.
Installation Phase
The following gives you a simplified rundown of the steps needed to get up and running. This is by no means an installation guide, and you are better off looking at the latest releases of Cisco documents, such as the installation guide for the Cisco HXDP Installation Guide [3]. This is just to give you a high-level view of the process.
The first step, of course, is the actual physical installation and cabling of the system when you connect the servers to the fabric interconnects (FIs).
Unless you are a new user with the appropriate software stack on your hardware, the initial step is to upgrade to the appropriate firmware on the FIs. This includes the UCS Manager (UCSM) firmware and firmware on your HX nodes if they are being reused.
A direct connection to the FI allows you to access the setup mode. From there, you enter your admin password, IP address for the FI, IP address for the cluster, default gateway, domain name system (DNS), and other initial configuration parameters. A connection to the second FI allows you to add the FI to the same cluster.
In a new HX installation, your nodes have the hypervisor already installed from the factory. If you have wiped your nodes or need to reuse them for some reason, you can download the Cisco version of your specific hypervisor and install it on each node before proceeding. Only do this if necessary and if you have nodes that have HX product IDs (PIDS) from the factory.
That basically concludes the hardware setup. The next step is to run the HXDP installer [3]. Before you run the installer, download and complete the HX Preinstallation Checklist [3]. This is a document that helps you gather and record all of the appropriate information for a successful installation. It is a critical step in a successful build.
The installer installs and configures the HX cluster. It also adds a plug-in to vCenter for ESXi-based installs. The installer runs on any ESXi host that can access the cluster network, including VMware Workstation or Fusion. Once the HXDP Open Virtual Appliance (OVA) runs, and credentials are entered, the installer walks you through the configuration process. Enter all the values you collected in the preinstallation checklist. This includes virtual local area network (VLAN) names and IDs, IPs, passwords, and services (DNS, Network Time Protocol [NTP], and so on). The process normally takes about half an hour.
The process goes through different stages, from UCSM validation to USCM configuration, hypervisor configuration, deployment validation, deployment, creation validation, and cluster creation.
The validations phase ensures that your firmware is correct and that you have compatible hardware. The UCSM configuration builds an inventory of the available connected HX servers. The installer starts configuring the FI and builds an HX service profile for the nodes. This includes configuring the following:
- Quality of service (QoS) policies
- MAC address pools and VLANs
- Boot policy
- BIOS policy
The hypervisor configuration phase installs an appropriate plug-in for ESXi—set static IP addresses—and builds the required vSwitches. These settings are checked for availability in the deployment validation phase before proceeding. The deployment phase then installs the HX Control VMs on each node. Once this is complete, the configuration is checked again to make sure all IPs are available and responding and that name resolution is working.
Once the deployment phase is complete, a final check is conducted. If everything passes, the cluster is created, the storage pool built, and the distributed cluster services activated. You are presented with a cluster summary screen when all this is done. From here, launch directly into HX Connect and begin provisioning storage for your VMs from the HXDP storage pool.
HyperFlex Workload Profiler
The HX workload profiler extracts storage usage and performance statistics from an existing running cluster. The data collected from the workload profiler is used to size the needs of the cluster. The profiler is installed as an OVA on an ESXi host and connects to vCenter. A collection period, such as 30 days, can be set to obtain a good view of the stats. It shows what the output of the profiler looks like with detailed information about read and write percentages, throughput, input/output operations per second (IOPS), and latency that is collected for a period of time.
HyperFlex Sizer
The HX sizer helps the administrator properly size the compute and storage resources of a cluster according to the workload. The input data of the sizer is taken from user input about the needs of the workloads or taken from the workload profiler. Performance data is imported from the HX workload profiler using a comma-separated file. Depending on the workload, the sizer determines the number and the type of nodes needed in the cluster and the compute and storage needs per node. The sizer accommodates for replication inside the cluster (called the replication factor; it is used for data protection) and the availability of self-encrypting drives (SEDs) or Non-Volatile Memory Express (NVMe) storage. The sizer displays the different workloads running on the cluster and the estimates for what is needed as far as CPU, memory, storage, and IOPS. The sizer tool provides the user with guidelines, but the user is to apply best judgment when configuring the nodes on the cluster.
Management Provisioning and Monitoring
Cisco offers multiple platforms in support of the management, provisioning, and monitoring of the HXDP. This allows HX to be managed on-premise or from the cloud using software as a service (SaaS). The different platforms are as follows:
- Cisco HyperFlex Connect HTML5 Management
- VMware vSphere management plug-in
- Cisco Intersight
Cisco HyperFlex Connect HTML5 Management
Cisco developed an HTML5 Management web interface to manage, provision, and monitor all aspects of the HX cluster. The user can monitor the health of the cluster, manage resources, create datastores, and manage the scalability aspects of the cluster. HyperFlex Connect is accessible via the cluster IP address. Accessing the interface is done via a local username/password or preferably via the vCenter single sign-on (SSO) for enhanced security. The role-based access control (RBAC) aspect of HyperFlex Connect allows for administrative roles for full read and modify of the configuration or read-only roles for the purpose of monitoring.
Let’s examine the main components of the interface.
Dashboard
The dashboard displays different information, such as the following:
- Operational status of the cluster
- Resiliency health in terms of failure tolerance
- Storage capacity
- Storage usage and free space
- Storage optimization stats
- Number of nodes and individual node health
- Cluster IOPS
- Throughput and latency
Figure 10-1 shows the Dashboard view of HyperFlex Connect.
Monitor
The Monitor view of Cisco HyperFlex Connect offers information about alarms, events, and activity logs. Cluster alarms are viewed, acknowledged, and reset. Event logs are viewed, filtered, and exported. Activity logs such as for ReadyClones are viewed and monitored.
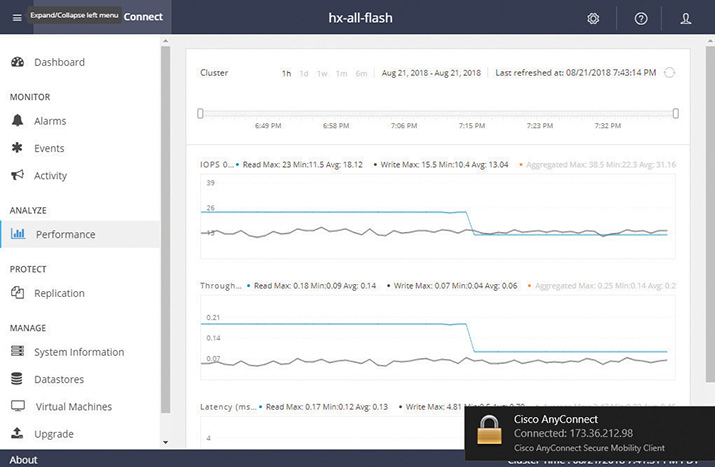
Analyze
The Analyze view displays the cluster performance charts over a period of one hour or can be customized for different intervals. Information about IOPS, throughput, and latency is displayed per node or per datastore depending on the selected view. This is shown in Figure 10-2.
Figure 10-1 Cisco HyperFlex Connect
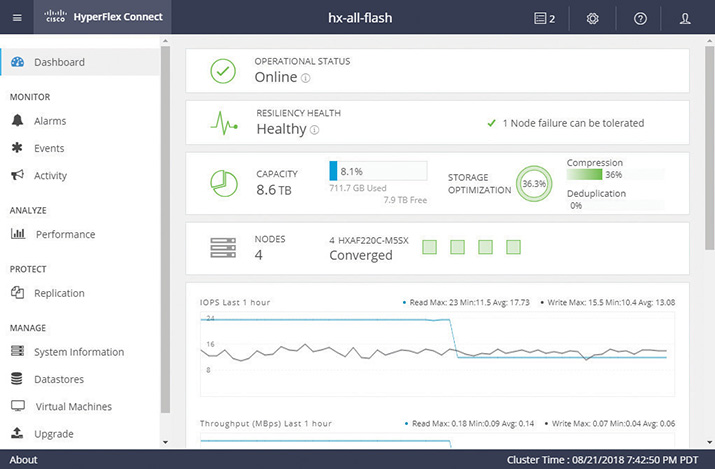
Figure 10-2 Analyze View of Cisco HyperFlex Connect
Protect
The Protect view is used to manage the data protection features such as VM replication and data-at-rest encryption. These functions were described in Chapter 9, “Cisco HyperFlex.”
Manage
The Manage view contains multiple elements for managing the cluster, including these:
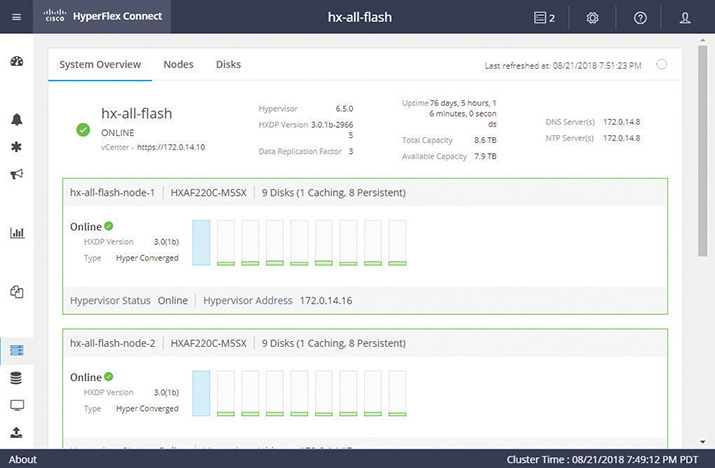
- System Information: This presents a view of the cluster configuration, including views of the individual nodes and disks. The view shows software revisions, hosts, uptime, and more. The nodes are placed in maintenance mode, and support bundles are created and shared with the Cisco Technical Assistance Center (TAC) for support.
Placing an HX node into maintenance mode through the system information individual node view, or through the HX maintenance mode of the vSphere web client, allows a node’s controller a graceful shutdown. During this process, any primary copies on the node in maintenance mode are assumed by promoted secondary copies on the other nodes.
- Datastores: Allows the management of datastores, including creating, resizing, mounting, unmounting, and deleting.
- Virtual Machines: This view shows the VMs that are present in the cluster and allows for cloning, snapshots, and VM protection via replication.
- Upgrade: Allows the upgrade of the HXDP software and Cisco Unified Computing System (UCS) firmware.
- Web CLI: A web-based interface that allows system configuration via the use of command-line interface (CLI) commands.
The Manage view is seen in Figure 10-3.
Figure 10-3 Manage View of Cisco HyperFlex Connect
VMware vSphere Management Plug-In
Administration of HX daily operation in a VMware environment is done via vCenter. This allows you to provision and monitor virtual machines and storage. The storage provisioning of the HX datastore is done via a vSphere management plug-in. The portal shows simple views to manage the HX storage, such as the Summary, Monitor, and Management tabs.
Summary Tab
This tab shows summary information of the system, including capacity, status, and performance. The Capacity view shows usable capacity, used capacity, and free capacity. It also shows provisioned and overprovisioned capacity along with storage optimization gains through always-on deduplication and compression. The Status view shows system health information such as online or offline cluster status, number of hosts and controllers and their status, the replication factor used for data protection, and so on. The Performance view gives information about IOPS, throughput, and latency.
The Summary tab is seen in Figure 10-4.
Figure 10-4 vSphere Web Client Summary Tab
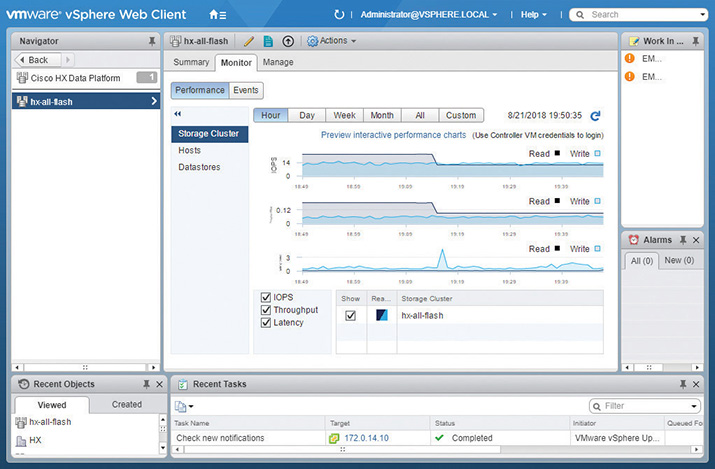
Monitor Tab
The Monitor tab drills down into the details of every component. It shows information at the cluster level, host level, and datastore level. The Cluster Performance view, as an example, shows aggregate cluster IOPS, throughput, and latency numbers displayed side by side. The user can customize the intervals that give the history of these parameters over a certain time period, such as hour, day, week, or month. These parameters also show at the granularity of a host or a data store. The Events view in the Monitor tab displays the different cluster events and alerts and correlates with vCenter. Examples of such events are cluster health status and policy compliance status. vCenter notifies a user that a critical event or alarm occurred. The alerts are also seen from the Alerts view of vCenter.
Manage Tab
The Cluster view in the Manage tab displays system hardware at the individual node level and shows the individual hardware system components, including the physical disks. The Datastore view in the Manage tab allows the management of the individual datastores, such as creating, mounting, unmounting, and editing the datastore. Editing a datastore is as simple as clicking on the datastore and changing the name or the capacity of the datastore. Thin provisioning is built into the system, giving the ability to overprovision a datastore. For example, you may have only 10 TB available, but you can create a datastore that is 100 TB in size. Make sure you don’t overprovision and then run out of usable capacity.
Cisco Intersight
Cisco Intersight [4] (originally called Starship) complements the existing Cisco management platforms such as UCSM and Cisco HyperFlex Connect by providing a cloud-based management platform with embedded analytics for UCS and HX. In other words, Cisco Intersight is a SaaS offering that runs in the cloud and is capable of overseeing the management, configuration, provisioning, inventory, and status of the whole network of UCS-based blade and rack servers, HX nodes, and HX Edge nodes. It gives a single pane of glass that administrators use to enforce a uniform set of policies and automation across the whole UCS and HX network.
Figure 10-5 shows the conceptual view of Cisco Intersight.
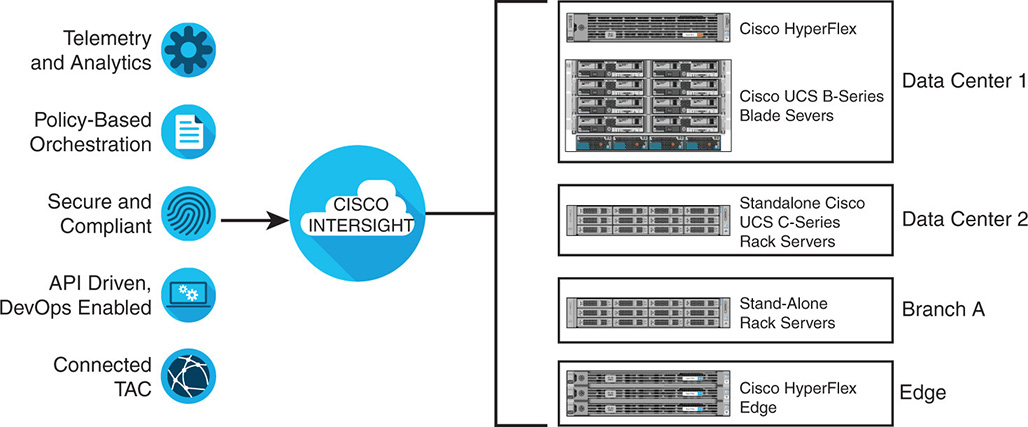
As noted, Cisco Intersight puts under the same umbrella the management and analytics of a whole suite of platforms, including these:
- HX platforms in data centers
- HX Edge in remote offices
- Cisco UCS C-series rack servers
- Cisco UCS B-series blade servers
- Cisco UCS S-series server
The advantages of Cisco Intersight follow:
- Unified management: Cisco Intersight allows administrators to manage all of their UCS and HX platforms from the cloud and without the need to have direct local access into these systems. This is a major advantage for large enterprises with national and international data centers as well as many widespread small offices.
- Unified policies: One of the main advantages of UCS manager is the ability to create service templates and profiles to be applied to a multitude of servers in a cluster. Now the same concept can be extended beyond a single data center and be adopted enterprise wide. Because Cisco Intersight has visibility into the whole network, applying the same policies via the templates and profiles is done uniformly network wide.
- Inventory information and status: The status and health of every node is seen and collected network wide. The user can collect inventory about the servers, firmware revisions, FIs, and more. The user can employ a search engine to find any node based on node names or tags. All events and alarms are seen from a single location.
- Telemetry and analytics: Cisco Intersight collects telemetry data from the UCS and HX nodes. Examples of such data are node serial numbers, software versions, firmware, IP addresses, and other valuable data. This data is collected and fed to the Intersight recommendation engine, which identifies and notifies the user of any potential issues that might exist in the user information.
- Integration with TAC: As the telemetry information is collected, it can be fed directly to Cisco TAC, which quickly reacts to the data without much user intervention. Rather than the TAC asking the user to debug, collect, and send information, all of the information is already gathered and ready to be processed.
Claiming the Nodes
Cisco has the Intersight cloud portal deployed on www.intersight.com. Customers with a valid login can use the portal and start managing their HX and UCS nodes depending on the Intersight service they have.
To have a node managed under Cisco Intersight, you must claim it. This is done via device connectors, which are software modules that are embedded into the management controllers of the devices. For Intersight to claim a node, it needs the node’s device ID and claim code. You can only obtain such information by accessing the actual device with administrator access. There are two steps in getting the device ID and claim code:
For the node to reach the Intersight portal, it needs IP connectivity. This is established by setting up default gateways on the node or optional https proxy server information, such as IP address and port.
From the Cisco HX Connect UI, the administrator accesses the cloud management menu, which provides the connection menu to Intersight. Upon connecting to the Intersight portal, and if the connection status is “claimed,” the device displays its claim code.
Once the information is entered in the Intersight portal, the device is claimed and comes under the Intersight umbrella, where it is managed. Figure 10-6 shows a device connector, where a device was claimed and is showing its device ID.
Figure 10-6 View of Device Connector from Cisco HyperFlex Connect
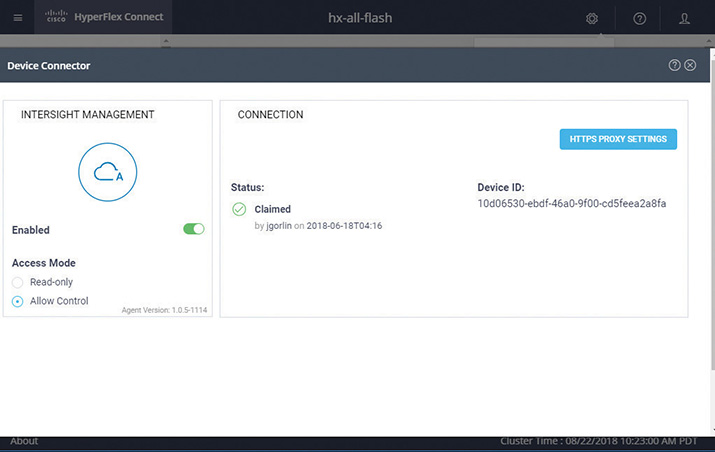
Figure 10-7 shows the Cisco Intersight high-level view, with information about all devices that are claimed.
Figure 10-7 Cisco Intersight Portal View
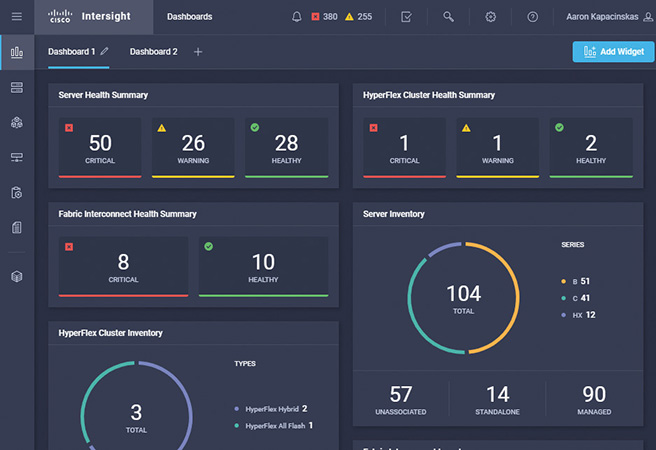
The top-left menu allows drill-down access to the following:
- Dashboard menu (displayed in the figure): Notice information such as server health, HX cluster health, FI health and inventory, information about HX cluster storage, and so on.
- Server menu: Shows details of UCS-managed B and C series servers attached to FIs or standalone. The user can search for servers and see details such as server health, configuration, and tags. The user also can launch Cisco UCSM.
- HyperFlex cluster menu: Shows detailed information on all HX clusters, including cluster name, software revision, hypervisor revision, storage capacity, storage utilization, storage optimization, number of nodes, and so on. By accessing individual clusters, other management tools can be cross-launched. For example, Cisco HX Connect can be launched for a cluster, and it would show the same menus as if the administrator is running Cisco HX Connect locally on the cluster.
- Fabric Interconnect menu: Shows information about all FIs, including UCSMs that are running, IP address, FI model, expansion modules, ports used, ports available, firmware versions, and more.
- Service profile: This is similar to the UCSM profile, which allows the user to define the configuration of an HX cluster, define new profiles, or take the profiles of existing clusters and “clone” them to produce a copy of profiles. Those copies can then be modified to accommodate the required configuration of the new HX cluster setup. Hundreds of clones can be created, for example, to duplicate a profile for remote offices that have similar configurations. Figure 10-8 shows a service profile cluster configuration menu for HX.
Figure 10-8 Intersight Service Profile for HX
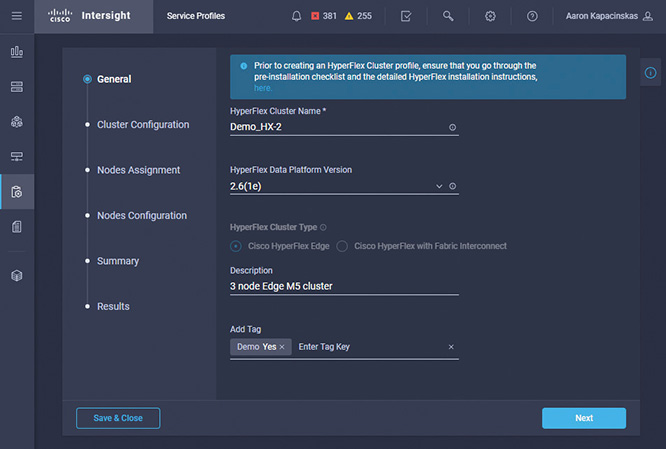
Different parameters can be configured, which include the following:
- Security
- DNS
- NTP and time zone
- vCenter
- Storage configuration
- Auto support
- IP and hostname
- Network configuration
- HX storage network
Each of the configurations is attached to a specific policy, so you can modify it easily. If, for example, you need to change the VLAN in the network configuration, detach the relative cluster-network-policy, change the VLAN information, and create a new policy with the new VLAN. Like UCSM, the profile and templates can be created offline even if the node is not available. Later, you can assign these templates to an active node.
- Policy menu: The policy menu allows Intersight to configure system policies.
- Device menu: This shows a consolidated view of all devices with connection status, device ID, type, IP, and the ability to add, delete, or launch specific devices. The Intersight portal allows the user to go to any device and launch UCSM, which allows the exact UCS capabilities that the administrator would have accessing UCSM locally. The administrator can access service templates and profiles and perform any other UCSM capability.
The top-right part of the Dashboard allows access to alarms, the search engine, settings, the user account, the Help menu, and more.
- Alarms menu: The Alarms menu shows a consolidated view of all alarms from UCS servers, standalone servers, HX clusters, and FIs.
- Search engine: Allows the search for any UCS or HX component by name or ID. It is a global index search across all menus. You can, for example, search for any alarm that a device generates.
- Settings menu: Manages users’ access and permissions, information about performed actions, historical changes made to the system, active sessions, and view status.
- Help menu: Provides walkthrough assistance for any of the functionality in Intersight. It also allows the user to submit feedback that goes back to the development team.
- User menu: Shows specific details about the user account, such Cisco ID and Cisco Intersight account ID. It allows customization of theme colors, language settings, and other things. It also allows the user to log in and out of Intersight.
Looking Ahead
This chapter covered the tools and software products HX uses to easily install and manage the platform. Being able to configure and roll out applications in about 30 minutes is a big shift from the traditional SAN model, where similar tasks took weeks. The ability to perform configuration from the cloud via Cisco Intersight gives HX a clear advantage in creating uniform configuration, management, and monitoring for wide-scale deployments.
Chapter 11, “HyperFlex Workload Optimization and Efficiency,” covers additional products that complement the HX platform in workload optimization. Software products include Cisco Tetration for traffic workflow visibility, Cisco Workload Optimization Manager (CWOM) for optimizing the resources inside the cluster, and Cisco AppDynamics for monitoring application performance to meet business metrics and finding root cause analysis of performance issues down to the code level.
References
[1] https://www.cisco.com/c/en/us/td/docs/unified_computing/ucs/UCS_CVDs/hyperflex_25_vsi.html
[2] https://www.cisco.com/c/en/us/products/hyperconverged-infrastructure/hyperflex-management.html
[3] https://www.cisco.com/c/en/us/support/hyperconverged-systems/hyperflex-hx-data-platform-software/products-installation-guides-list.html
[4] https://www.cisco.com/c/en/us/products/collateral/servers-unified-computing/intersight/datasheet-c78-739433.html