

Live Data Collection
Live data is collected in nearly every incident response investigation we perform. The main purpose of the collection is to preserve volatile evidence that will further the investigation. In practice, we also collect any additional information that we can collect quickly, such as log files and file listings. We do this so that we can begin answering investigative questions without performing a more lengthy drive duplication. In many situations, performing a live data collection and analysis will help you get answers quickly so you can reduce the risk of data loss or other negative consequences of an incident. The results should also help you decide if a full drive duplication is necessary.
Live data collection is not without risk, however. An important consideration is to minimize changes to the system made due to the collection process. If you do not use an automated process, you may cause excessive and unnecessary changes to the system—possibly disrupting business, destroying evidence, or alerting an attacker to your presence. In some cases, performing a live data collection may cause a system to crash. You must be well prepared and diligent when performing live data collections.
In this chapter we cover a number of topics to help you perform effective live data collections and reduce the potential risks. We explain the intent of live data collection, when it’s appropriate to perform a collection, and the data that is typically collected. We also cover how to perform a live data collection, or “live response” (LR), on common operating systems in use today. For additional good reading, see Request for Comments (RFC) 3227, “Guidelines for Evidence Collection and Archiving.”
GO GET IT ON THE WEB
The decisions you make regarding when and how to respond to a system will have a direct impact on the integrity of evidence you collect, the conclusions you will be able to make, and the admissibility of your findings in legal processes. The results of your decisions can have a great impact on your organization. We hope you will be conscious of these responsibilities as you plan for and perform live data collections. |
WHEN TO PERFORM A LIVE RESPONSE
We most frequently perform live responses, also called LRs, during an intrusion investigation; however, it may be prudent to do so during other types of investigations. You have five important factors to consider when deciding if a live response is appropriate in your current situation:
1. Is there reason to believe volatile data contains information critical to the investigation that is not present elsewhere?
3. Is the number of affected systems large, making it infeasible to perform forensic duplications on all of them?
4. Is there risk that forensic duplications will take an excessive amount of time, or potentially fail?
5. Are there legal or other considerations that make it wise to preserve as much data as possible?
There are also some potential downsides to performing a live response. The process may cause the system to crash or even destroy evidence. Be sure to evaluate the following questions to determine if the risk of performing the live response is too great:
• Have you tested the live response process on a similar system?
• Is the system particularly sensitive to performance issues?
• If the system crashes, what would the impact be?
• Have you communicated with all stakeholders and received their approval? In some cases, written approvals may be prudent.
We are often asked about the concerns of making changes to a system, and the implications of performing a live data collection from a forensic integrity perspective. There are folks who are purists, in a way, who believe that absolutely no action should be taken on a system that can affect its current state. In IR situations, that perspective results in a process deadlock. There are no processes that allow a responder to interact with a computer system without making changes to it. The moment you press a key on a keyboard, make a network connection, insert a USB drive, or run a program, you are modifying the system. Shutting a system down causes many changes during the shutdown process, as well as destroys volatile data such as memory. Removing the power source would avoid changes from a shutdown process, but still destroys volatile data and may leave nonvolatile data in a corrupted state because caches are not flushed properly.
Because making changes is unavoidable, the most important concept is to minimize changes to the system and document what you do. Also, keep in mind that the approach of inaction is generally not acceptable. Evidence that is crucial to the investigation may be lost at any time. All things being equal, you should implement your response protocol immediately upon suspecting a system of compromise.
SELECTING A LIVE RESPONSE TOOL
When the previous edition of this book was written, the primary option for a live response tool was creating a homegrown solution, such as a Microsoft DOS batch script that ran a series of commands. Today, there are a number of options—from full commercial products, to open source and other free solutions, to more elaborate homegrown scripts that run a collection of individual programs or use system APIs to collect information. Your organization will need to decide what makes the most sense to implement. As techniques in live response and our understanding of computer forensics evolve, you will also need to continuously evaluate if the tools and procedures you are using are appropriate.
At the company we work for, our preferred live response toolkit has evolved over time. Originally, we created and maintained a batch script (or a BASH script on Unix and BSD platforms) to run individual tools. Although that solution provided greater control over the process, it also took time for someone to maintain. Then we moved to a Perl-based script that was able to collect more information natively, which reduced some of the maintenance burden. Today, we’ve mostly gone away from maintaining custom scripts. There are a number of live response solutions, both free and commercial, that provide the functionality we need. The solutions we commonly use are presented later in this chapter. However, your needs may be different, so we encourage you to evaluate potential live response solutions on your own. We recommend that you consider the following factors when evaluating solutions:
• Is the tool generally accepted in the forensic community? In Chapter 3, we talked about some of the requirements for admissibility of evidence in court. In general, the tools and procedures you use throughout an investigation should strive to meet these requirements. Acceptability involves considerations in many areas, including logging, chain of custody, cryptographic checksums, and sound procedures and algorithms. If the tools you decide to use are not generally recognized and accepted in the forensic community for the purposes you are using them for, you will increase the risk that your results will be disputed.
• Does the solution address the common operating systems in your environment? Microsoft Windows might be one of the more popular operating systems, but many environments have a mixture of Windows, Unix, Apple, and others. What happens when one of those systems is compromised? You should have live response tools that address all of the common operating systems that are used in your environment. And for tools that execute operating system commands as part of the solution, they should use trusted copies that are part of the toolkit versus using the file on the potentially compromised system.
• Does the solution collect data that is important to have, based on your environment? Understanding what data is important will help you choose a proper solution for your organization. You should collect data that is the most likely to help answer common questions and provide leads. Part of what you collect should be based on the software and configuration of the systems in your environment. For example, it may be useful to collect log files from security or other software programs. In most cases, though, the bulk of live response data will come from sources the operating system creates.
• How long does a collection take? A goal of performing a live response is to get answers quickly. Therefore, the live response collection should not take a long time to complete. We like to have a process that completes in less than one hour for a single system, on average.
• Is the collection configurable? In some environments, we find that collecting certain pieces of information are problematic. In other cases, we need to collect additional data that is not part of a standard live response process. It’s important for the collection tool to be configurable, so you can add or remove items to collect.
• Is the output easily reviewed and understood? A GUI interface is nice, but we also like to have access to the raw data so we can perform custom analysis using scripts or other tools. Some live response tools produce raw output in formats that are difficult to deal with. Unstructured data is generally not acceptable, unless the content is very short. Structured data is much more acceptable, because there are many tools to deal with viewing, sorting, and filtering those formats (CSV, TSV, XML, and others). Sometimes, even structured data can be a problem, especially when the content is not properly documented. In those cases, you may find it difficult to parse or, more importantly, interpret the data.
WHAT TO COLLECT
In most cases, we collect information from two general categories. The first category is data that describes the current running state of the system, such as network connections and running processes. This data, typically the contents of system memory, provides information that helps to answer questions about what is happening now. The second category is information that is less volatile and provides a snapshot of important information that can answer questions about what happened in the past—for example, a file listing, system logs, or other operating system or application specific data. During an investigation, the questions that are important are usually about what happened in the past, since detection is almost always delayed. Therefore, when performing live data collection, we tend to give more priority to data that will tell us what happened in the past. Depending on the situation, however, you may need to change the priorities.
Throughout an investigation, we continuously evaluate what to collect based on how effectively that data helps us quickly answer investigative questions. In addition to the normal evidence preservation concerns, you must also consider the circumstances of the ongoing incident. For example, if the incident consists of a mass malware infection, there may be no justification to perform an extensive data collection. However, if you learn that an attacker is executing malware that is only loaded in memory, it may be very important to capture the entire contents of memory.
We have found that some organizations have subscribed to particular collection protocols with no logical justification whatsoever—such as always collecting the entire contents of system memory or performing forensic duplications for every affected system. In some of those cases, the organization fell victim to marketing propaganda or the flawed advice of individuals who have established themselves as “experts.” You should not collect data that you don’t use effectively or understand. We believe you should establish your collection protocols based on demonstrated ability to use the data you collect to quickly determine the impact of the incident. Remember, installing malware is not the attacker’s goal, rather it’s a means to an end or one of the first steps in reaching their ultimate objective. You must follow leads and attempt to determine what the attacker is trying to accomplish.
Although every operating system has a set of unique sources of evidence, there are many areas common to nearly all operating systems. Some data is an inherent part of the operating system, and some data comes from sources such as logging. It is important to realize that operating system settings can greatly affect the available evidence, in turn affecting what questions you can answer. Your organization should work toward having the maximum amount of data available that is reasonable to achieve. At a minimum, the live response tool you choose should be capable of collecting the following common live response data from a system:
• The system time and date, including the time zone
• Operating system version information
• General system information, such as memory capacity, hard drives, and mounted file systems
• List of services and programs configured to automatically start on boot-up, such as web servers, databases, multimedia applications, and e-mail programs
• List of tasks scheduled to automatically run at given times or intervals
• List of local user accounts and group membership
• Network interface details, including IP and MAC addresses
• Routing table, ARP table, and DNS cache
• Network connections, including associated processes
• Currently loaded drivers or modules
• Files and other open handles
• System configuration data
• User login history, including user name, source, and duration
• Standard system log data
• List of installed software
• Appropriate application log data—web browser history, antivirus logs, and so on
• Full file system listing, including the appropriate timestamps for the file system
You may have noticed something missing from that list—system memory. Memory is a unique data source that requires specialized tools to collect and interpret. For reasons mentioned earlier in this section, we do not normally consider memory collection a standard part of a live response collection. However, there are times that the contents of memory will be very critical to an investigation. Later in this chapter, we cover memory collection in separate sections for Windows, Linux, BSD, and Apple OS X.
COLLECTION BEST PRACTICES
As with most tools, it’s very important to learn the correct way to use them. Live response tools are no exception—even though they may be quite streamlined. For example, how do you run the tool? Where is the output stored? Is there a way to detect if the output has been modified? Is there a chain of custody? In this section we discuss best practices for performing a live response collection.
One of the most important things we suggest you do is prepare. Before running a live response on a real suspect system, practice on a test system. Run through the procedure multiple times, and on more than one system. Get familiar with how long the process takes and how large the output normally is. Create simulated problems for you to work through—such as broken USB ports, a nonfunctional network card, and a locked screen.
When you perform a collection, you want to minimize the time you spend interacting with the system, as well as minimize the number of changes you make—either directly or indirectly. You also need to remember that the suspect system may be infected with malware. Any media you connect may be subsequently infected, and any credentials you use may be compromised. We’ve come up with a number of considerations that will help you establish a good process:
• Document exactly what you do and when you do it. You’ll need to note the difference between the actual time and system time. Don’t forget to include time zone in your notes.
• Treat the suspect computer as “hot”—do not interact with it unless you have a plan. Get on and off the system as quickly as possible.
• Use tools that minimize the impact on the target system. Avoid GUI-based collection tools; instead, use tools that have a minimal memory profile and that do not make unnecessary or excessive changes to the target system.
• Use tools that keep a log and compute cryptographic checksums of their output as the output is created (not after the fact).
• Fully automate the collection process, perhaps eliminating the requirement for a human to interact with the suspect computer.
• Do your best to collect data in order of volatility.
• Treat the data you collect as evidence—be sure to follow your data preservation procedures, including the creation of an evidence tag and chain of custody. Don’t forget to compute an MD5 checksum of the evidence.
• Consider files on media you connect to the suspect computer as lost to the attacker. For example, do not keep indicators, documents, reports, notes, or anything else on the media from which the live response will be run.
• Consider any credentials you use as compromised. It’s a good idea to use an account other than your primary account, and change the password frequently or use a two-factor or one-time password solution.
• Do not take actions that will cause unnecessary modifications to the suspect computer unless there is no other option, such as copying the live response kit to the system or storing the output there. Doing so may destroy valuable evidence. Use removable media, a network share, or other remote media options.
• Do not use the suspect computer to perform analysis. This causes unnecessary changes to the system, potentially destroying evidence and making it harder to discern attacker activity from responder activity. You also do not know what state the system is in—it could be providing incorrect results.
As you read through those considerations, you may have thought, “Wow, who would ever do that?” or “That seems so obvious.” Throughout our careers, we’ve seen some very poor response protocols implemented as standard process. At a number of companies, the standard procedure was to copy the live response toolkit to the affected system, and save the collected data back to that same system. In some of those cases, the data collected included a full memory dump that wrote gigabytes of data to the main system drive. At other organizations, the standard process was to remotely log in using a domain administrator account, and run a program such as netstat or Task Manager to attempt to find out what was going on. And some people still subscribe to the idea that pulling the power is the best way to properly preserve evidence because anything else you do modifies the hard drive. If your organization regularly uses any of the approaches just mentioned, you are likely not following best practice and should look into revising your procedures.
On a more positive note, we’ve seen a number of organizations come up with great ways of performing live responses. One organization came up with a particular collection process we thought was noteworthy. The organization set up a network share on a dedicated file server with two folders. The server was not part of any domain, and the share was made accessible with throwaway credentials that were not used for anything else within the organization. The first folder on the share was made read-only and contains the LR toolkit. The second folder was writable and is where the output from the live response was placed. The responder then follows this process:
1. Browse to the share (or map a drive letter) from the suspect system.
2. Run the live response program directly from the share and specify the output folder on the share as the location to write data. Ideally, a subfolder would be created using a unique identifier such as an evidence tag number.
3. Once the collection is complete, the responder returns to their desk and moves the live response data from the temporary share location to a separate server that permanently houses live response data and has appropriate access controls.
Of course, more controls could be put in place to make the process even more secure, including establishing an air-gap for your evidence server and enabling logging and auditing to keep an eye on access. The procedure itself could also be optimized to further minimize human error and increase consistency, such as automatically creating and using the appropriate output folder. |
This method minimizes changes to the suspect system and provides a convenient way for any IT savvy person in their organization (not just incident responders) to perform a live response. This is just one of many clever methods your organization can implement to collect live responses in an efficient and acceptable manner.
When you run a live response, you will also have to deal with access restrictions. The user account you run the toolkit as may affect your ability to successfully collect the proper data. In the Unix world, this means you will have to run the collection as the user “root,” probably through the use of a command such as sudo. In Microsoft Windows, you must also run the collection with an account that has administrative privileges on the system. Starting with Microsoft Windows Vista and continuing to Windows 7, Microsoft introduced a concept called User Access Control (UAC). Most updated toolkits will automatically deal with UAC, but you may have to use the Run as Administrator option, even if the current user has administrative privileges.
Sometimes you will encounter a system that you cannot connect removable media to. It may be due to hardware failure, system configuration, or some other circumstance. You should prepare for this ahead of time, and work through how to perform a live response without being able to connect portable media to a system. Come up with options for running your toolkit and storing the output. Common options for running the toolkit include CD-ROM, DVD, and a network share (SMB/CIFS or NFS). Some alternate solutions for storing output are a network share and an encrypted network streaming tool such as cryptcat or stunnel to send output directly to another system. Thinking through this ahead of time, and testing alternate solutions, will provide you with options when things start going wrong or other challenges come up.
Another live response challenge is encountering systems that you have no automated live response toolkit for, and one is not readily available. On many occasions, we’ve responded to systems that were believed to be a certain operating system version, only to find out they were something different. In those cases, we spend a brief amount of time investigating if we can update or change an existing toolkit. If we can’t, then we normally resort to a manual live response. We create a checklist based on the automated steps taken by a live response toolkit for a similar operating system. We research command-line options to get the checklist right, and then test, if possible, on known clean systems. Performing a manual live response on a system you are less familiar with carries increased risk. You must consider that risk against what you hope to gain, and decide if it’s wise to proceed with a live response.
In the following two major sections, we cover live response options for the most common categories of operating systems: Microsoft Windows and Unix-based operating systems, including Apple OS X.
Automation
You may have noticed that we’ve mentioned automation a number of times now. You may be thinking about why that is so important. We already know automation decreases human error as well as makes processes consistent and faster. But in the context of incident response, it can also help prevent the bad guys from gathering intelligence about how you respond to incidents. For example, we once had the opportunity to respond to an incident involving the financial officer of a well-known U.S. federal agency. We responded by performing a live response, then shutting down the system and collecting an image of the hard drive. During an examination of the hard drive, we discovered the system had a keylogger installed. The keylogger was configured to regularly send captured data to an external site. Because the system was denied Internet access while we performed the live response, we found that the keystrokes related to the live response were still on the system. Needless to say, it was an interesting experience to see your own keystrokes in a log file. The point of this story is that if you manually interact with a system, you never know who is looking over your shoulder—physically or virtually. And if someone does get to see you, they may learn things about you and your processes that they can take advantage of. We’re not suggesting that you be wildly paranoid, but rather, as a wise colleague of ours once said, “The best thing to do is to not be stupid.”
You have three main options to perform live response collections on Windows-based systems: use a prebuilt toolkit, create your own, or use a hybrid of the two. We suggest you look into a prebuilt kit, because the organizations that make them probably have more time than you do to make sure they meet the standards of the forensic community. If those solutions don’t meet your needs or are too expensive, or if you are just feeling adventurous, you may want to consider building your own kit. Although the process of creating a live response toolkit is certainly educational, and perhaps even a little fun, when your time becomes limited you will begin to neglect the toolkit. Perhaps a hybrid toolkit would be a better option to creating a toolkit from scratch. Also, remember to keep some of the live response tool-selection criteria in mind while you go through the process—you don’t want to create something that is not acceptable as a live data collection kit.
Prebuilt Toolkits
As we did our research for this book, we found that the offerings for a good live response toolkit were very weak. If we were king for a day, we’d have the computer security community develop better live response toolkits. After researching a dozen solutions, we found a single commercial (but free) tool that was acceptable based on our standards: Redline from Mandiant. This was the only tool that collected the majority of the data points required and allowed us to conform to most of the collection best practices outlined earlier in this chapter.
Some of you may wonder why we did not include an open source toolkit. We have no issues with open source tools or methods. In fact, many are far superior to commercial offerings for specific areas. The answer is that we found the open source solutions we reviewed were unacceptable as live response toolkits; they did not meet the forensic or live response tool criteria mentioned throughout this book. Many were sorely outdated or required extensive work to bring them to an acceptable state.
Mandiant Redline
Mandiant’s Redline is a GUI tool that can both collect and analyze live response data. To collect data, Redline creates what is called a “collector”—a set of command-line batch scripts and binaries that you can place on removable media and run on each system of interest. The analysis is then performed in the GUI interface back on your system. Although Redline can also analyze the data, we will cover that capability in Chapter 12.
GO GET IT ON THE WEB
According to Mandiant’s website, Redline officially supports Windows XP, Windows Vista, and Windows 7 (both 32 bit and 64 bit). We also found that it runs just fine on Server 2003 and 2008. The comprehensive collector is quite extensive: Redline collects information from 25 different categories, including all of the common live response data defined earlier in this chapter. The information gathered provides an incident responder with data that can be very useful for answering many investigative questions, but may be a bit overwhelming. You can tweak what’s collected if you don’t need as much information, or are looking to optimize the time it takes to perform a collection.
Remember to avoid installing the Redline MSI package on a system you are investigating! You should install Redline on your normal work computer, or another system that is not affected by the incident. You will then create the Redline collector on your system. The only step you should take on a suspect system is to run the stand-alone Redline collector batch script, which will automatically save the data to the same location you run the script from. |
Once you have Redline installed on your system, go ahead and launch the tool using the Windows start menu. You will see two high-level categories of actions you can take: Collect Data and Analyze Data, as shown in Figure 7-1.

Click the option Create Comprehensive Collector. Then browse to the location you would like to save the collector, as shown in Figure 7-2. We recommend saving the collector to a directory on removable media, such as a thumb drive or external USB drive.
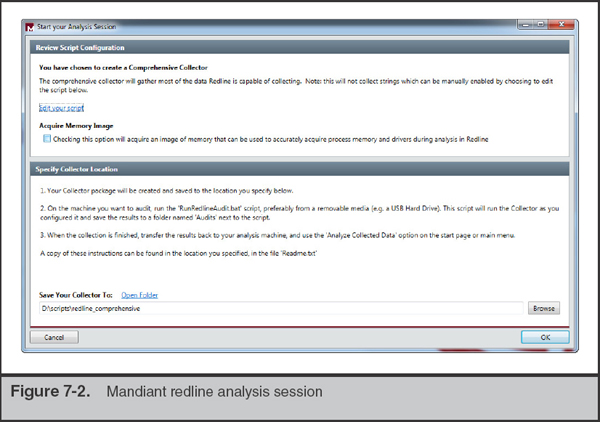
Before you save the collector, you can view and tweak the collection parameters by clicking the Edit Your Script link. The comprehensive defaults are set to collect more data versus less, so you may want to turn some items off, depending on the situation. For example, sometimes Windows domain controllers have massive event logs that cause collection problems or delays. In that case, you would deselect Event Logs from the System tab while editing the script.
Once you have your collector saved, running it is simple. Use Windows Explorer to browse to the directory and then double-click on the file named RunRedlineAudit.bat. If the script needs UAC or administrative privileges, it will automatically prompt you for access. A DOS window will open and the collection will proceed. It’s normal to see many informational and warning messages throughout the process. Once the window closes, the collection is complete.
There is one shortcoming with Redline, in that it does not keep a basic log of what it did and it does not compute MD5 checksums of the data it creates. Although the incident responder can make a wrapper script to run the Redline collector and record that information, we prefer to see that feature built in to live response tools.
Do It Yourself
While we were searching for prebuilt live response toolkits to review, we found many inquiries on blogs, forums, e-mail lists, and other places from people who were also looking for toolkits. In many cases, the answer they got was to consider creating one from scratch. We recognize that many organizations may choose to go this route (we used to maintain a Microsoft Windows live response toolkit up until just recently). Therefore, we’ll share some of our experiences with maintaining a toolkit, including pointers on how to design the framework and what tools might be acceptable options as part of the kit.
The first decision you will need to make is what operating system versions you will support. Some tools only work on certain operating systems, some command-line options might be different, and the locations of files or directories change between versions of Windows. Keep in mind that most versions of Microsoft Windows come in two main releases, 32-bit and 64-bit, and that some tools, commands, and file locations may be different between them. You should consider building test systems for each operating system you intend to support—physical machines if you have extras, or virtual machines if you don’t. We recommend focusing on the most common operating systems in your environment, because each one you choose to support is additional work—both one-time and ongoing. Not only do you need to research how to collect the data you want from each operating system, each time you update the toolkit you will need to re-run it on each system to ensure things work as expected. We also recommend keeping in regular communication with your IT department so you know what’s coming on the horizon.
After you’ve decided what operating systems to support, you will need to find tools that collect the information you want. Some tools may be built into the operating system, some may be free third-party tools, and others may be paid commercial tools. The following tables contain all of the common areas we mentioned earlier as well as some acceptable options that are readily available. Links are not provided for every tool because some links change very frequently. We recommend using a popular search engine to find any tools without links—they are extremely popular and are easily found.
The first table lists built-in Windows commands that you can use to collect a number of critical areas, including network connections, system information, and the system date and time. When building your kit, be sure to copy these files from a clean Windows system. Also include the command processor (cmd.exe) from a clean system. This is commonly referred to as building a kit with “trusted binaries.”
Data Collected |
Command(s) |
System date and time |
date and time |
Time zone |
systeminfo |
Installed software |
|
General system |
|
information |
|
OS version |
|
Uptime |
|
File system information |
|
User accounts |
net user |
Groups |
net group |
Network interfaces |
ipconfg/all |
Routing table |
route print |
ARP table |
arp -a |
DNS cache |
ipconfig/displaydns |
Network connections |
netstat -abn |
The next table lists a number of free tools that provide information not easily obtained through built-in Windows commands. Areas include persistence items, loaded drivers, and a comprehensive file system listing.
Data Collected |
Tool Name |
Network connections |
DiamondCS openports (www.softpedia.com) |
List of services and tasks |
Microsoft autoruns |
Loaded drivers |
NirSoft DriverView |
Open files and handles |
NirSoft OpenedFilesView |
Running processes |
Microsoft pslist |
Registry (config data) |
Microsoft logparser |
Event logs (login history) |
Microsoft logparser |
File system listing |
Microsoft logparser |
LR output checksum computation |
PC-Tools.net md5sums or hashutils (code.kliu.org/misc/hashutils) |
We consider these areas the most common you would want to collect. There are many other data points you could also capture, including prefetch information, system restore point information, browser history, and so on. Exactly what you choose to collect is based on your needs to get answers quickly, balanced with the impact the collection has on the system.
Some of the third-party tools are GUI based, which you normally want to avoid using in a live response toolkit. Not only is a GUI application more heavyweight (creates more runtime artifacts), it is also harder to use in an automated fashion. Luckily, most of the tools we mentioned have a command-line option to instruct the tool not to run in GUI mode, and simply output the results to a text file. For example, NirSoft’s OpenedFilesView can be run with the/stext option. In general, command-line options tend to change over time, so as you build your kit you should research the current options and choose them accordingly. We also renamed the files of the tools we used, commonly prefixing them with “t_”. We did this so that we could clearly tell what artifacts were created by our tools versus someone else’s. Optionally, you can also use a trusted copy of the command prompt and operating system commands as part of the live response kit for each operating system you support.
Finally, you must decide what scripting language to use to automate the process. There are many options, including MS-DOS batch, VBScript, Perl, Python, and other interpreted languages. Because we prefer a lower footprint, we chose to use DOS batch for our old live response kit. Other options might be easier to work with or provide additional capabilities, but DOS batch has all the features we needed to automate the collection process. DOS batch also has no third-party dependencies—you can run a batch script on any Windows-based system. As you are creating your script, be sure to add code that will record an appropriate amount of logging and compute a checksum of the collected data. Be careful with file and directory names—especially when they are long or contain spaces or special characters. You may have to code special handlers to deal with those situations.
Before you put your shiny new live response toolkit into action, be sure to perform some extensive testing. Build a test environment that consists of virtual and/or physical hardware. The test environment should closely resemble your production environment in terms of operating systems, applications, and configuration. Run the collection multiple times and ensure things work as you expect. Randomly choose a handful of operational systems in your environment and then run test collections at the appropriate time. Not only should you check the accuracy of the data collected, but you should also pay attention while the collection is running and watch closely for errors or other unexpected results.
Memory Collection
Memory collection in Microsoft Windows used to be a very delicate process, but newer tools seem to have made the collection much more reliable. When we performed our research, we found at least six acceptable collection tools that were freely available. Four of those tools can capture the entire contents of main memory. Three can capture memory for an individual process, which is useful when you are only interested in memory from one or more running processes.
The following table lists well-known tools that are capable of performing a complete dump of memory. We recommend that you become familiar with multiple tools. With the exception of Mantech MDD, they run on any modern version of Microsoft Windows, including Windows XP, Vista, Windows 7, and Server 2003. Windows Vista and 7 require signed drivers, and the memory driver for Mantech MDD version 1.3 was not signed.
Tool |
Website |
AccessData FTK Imager Lite |
|
Mantech MDD |
|
Mandiant Memoryze |
|
Moonsols Windows Memory Toolkit |
In the following two sections, we cover the two tools that we use the most often for Windows memory imaging: Mandiant’s Memoryze and AccessData’s FTK Imager Lite.
Mandiant Memoryze The tool we most commonly use to dump the full content of memory is Mandiant’s Memoryze, which comes packaged as an MSI. You have two options for using the software, and both should only be performed on a safe computer, meaning a computer that is free of malware, not compromised, and that you typically use for investigative work:
Remember not to perform these actions on a computer that is part of the investigation! Specifically, do not download or install Memoryze, or any other software, on a system that is under investigation. In some rare cases, that might be your only option, but in general it’s poor form because you will cause unnecessary changes and possible loss of evidence or contamination on the system you are investigating. |
• The first option requires you to install the software on a safe computer, and copy the Memoryze files from the install directory to portable media. The installation folder is Program FilesMandiantMemoryze, or Program Files (x86) on 64-bit systems. Copy all of the files in that directory to a directory on portable media, and you are ready to image memory of a system.
• The second option is to open a Windows command prompt, change directory to where you downloaded the MSI package, and run msiexec/a MemoryzeSetup.msi/qb TARGETDIR=<portable_drive_and_folder>. Replace <portable_drive_and_folder> with the drive letter and folder on the USB thumb drive or other media you wish to install Memoryze to.
Once at the suspect system, connect the portable media, browse to the folder you placed Memoryze in, and run MemoryDD.bat. Don’t forget, if you are on a system with UAC or other access controls, you may have to open a special command prompt or log in as a different user. If you wish to store the output to a location other than the current directory, use the -output command-line option. When you run the batch file, a new window will appear with output similar to the following:

You may be concerned with some of the messages in this Memoryze output. It’s normal to receive some “Warnings.” However, if any messages indicate an “Error,” you might have a problem. |
The collection is complete when the Command Shell window closes. Before you consider the collection successful, you should check the size of the output file against the expected size of memory. Sometimes Memoryze and other memory collection tools have a problem with a particular system. If you cannot get Memoryze to create a file of the expected size, try another memory-imaging tool. Note that Memoryze also includes process address space that is swapped out (using virtual memory), so the resulting memory image file can be larger than the size of physical memory.
AccessData FTK Imager Lite The second most common tool we use to image memory in Windows is AccessData’s FTK Imager Lite, which is a GUI-based tool that can image both memory and hard drives. The “Lite” designation indicates the software does not require installation and will run directly from a folder. This is ideal for incident response, because you do not need to copy any files to the system you are investigating. The most convenient way to use FTK Imager Lite is to download and extract the ZIP file to portable media, such as an external USB hard drive. Then you can connect the drive to the system you are investigating and use Windows Explorer to browse to the drive letter assigned to the USB drive and double-click FTK Imager.exe. The FTK Imager main window is shown in Figure 7-3.

Under the File menu is the option Capture Memory. When you select this function, a window appears that allows you to select where to output the capture, and what you would like to name the file. As with any other live response process, we always recommend saving the output to external media or a network drive. If you’ve used an external USB drive to run FTK Imager, you can just output the memory capture back to that device. Be sure to name the file name something appropriate, such as the case and evidence tag number or the case and computer name. Always be sure the naming is unique—you might respond to the same system more than once. Once the capture starts, you will see a window similar to this:

When the process completes, FTK Imager will report a status of “Memory capture finished successfully.”
Sometimes you may only be interested in the memory for a specific process. In the next section, we look at how to dump the memory for individual processes in Windows.
Individual Process Dump
In some cases, gathering the process memory space for individual processes is all you need. For example, you may know that a specific piece of malware is running and you want its memory space only, or perhaps there is a system process that tends to keep artifacts of recent malicious network activity. Some tools we have commonly used to meet these requirements are listed in the following table.
Tool |
Website |
Mandiant Memoryze |
|
Microsoft userdump |
|
Microsoft procdump |
|
Ntsecurity.nu pmdump |
Again, of these tools, we most commonly use Mandiant’s Memoryze. In the same directory created during the previous section is a file named ProcessDD.bat. To capture the memory space of a specific process, run ProcessDD.bat and specify the numeric PID with the -pid command-line option. Memoryze will dump the contents of the process memory space, as well as the cached contents of any file the process had open at the time of the dump.
There are not many well-maintained, prebuilt, publicly available live response toolkits for Unix. The best open source toolkit we could find was called LINReS, made available by Network Intelligence India.
GO GET IT ON THE WEB
LINReS creator’s website www.niiconsulting.com/innovation/linres.html
LINReS downloads sourceforge.net/projects/linres
The toolkit primarily supports Red Hat Linux. However, you can use it as a model to construct toolkits for additional versions of Red Hat, or even for different flavors of Unix, such as FreeBSD, Solaris, and OS X. The LINReS framework isn’t very complicated, but you may need to brush up on your BASH scripting skills to get the most out of it.
Because of the limited up-to-date toolkits available, live data collections for Unix-based systems are still mostly a do-it-yourself exercise. The steps to create a Unix-based LR kit are much the same as a Windows-based kit: choose the operating systems you wish to support, identify third-party tools you may need, choose a scripting language to glue everything together, and test everything thoroughly. In the next section we cover the basics to get you going.
Live Response Toolkits
As with building your own Windows-based toolkit, the first decision you should make is what operating systems you will support. Unix-based operating systems are diverse, both between distributions and within them. From a user perspective, some distributions change little over time, and others seem to change significantly every few months. For each operating system you choose to support, you will have to maintain a sharp eye for new releases that are implemented within your environment. You will also have to consider both 32-bit and 64-bit versions of Unix-based operating systems. Just like with choosing which Windows-based system to support, be sure to focus on common Unix-based operating systems. With each version you choose, you are signing up for more work.
As computer security consultants, we respond to a large number of incidents that put us in front of many different versions of Unix-based systems. The overhead and time sensitivity of creating new Unix-based live response toolkits is so great that we created a series of tools that help create a new live response toolkit. The tools consist of Bourne shell scripts that walk through the live response process as well as identifying the correct binaries and all related libraries. We aren’t including the scripts here because they require constant maintenance, but they illustrate the increased effort involved with building and maintaining live response toolkits for many Unix-based systems. |
The next choice to make is what language to use for your live response script. The considerations for choosing a language are similar to Windows. There are numerous languages available in Unix-based operating systems—Perl, Python, Bourne shell, BASH, and others. We decided to go with a more recent but still reliable solution, the Bourne-again Shell (BASH), for the live response scripts we make at our company.
A number of websites can help get you going in the right direction. One website in particular, “The Apple Examiner,” is a useful resource for OS X. Because OS X is Unix based, the website may also provide you with ideas for live response techniques on Unix-based systems in general. When assembling your own kit, note that the system_profiler command in Apple OS X returns a large amount of useful information on the system and connected devices.
GO GET IT ON THE WEB
The Apple Examiner website www.appleexaminer.com
Ideas for what to collect under Apple OS X www.appleexaminer.com/MacsAndOS/Analysis/InitialDataGathering/InitialDataGathering.html
The following table lists the basic Unix-based categories of data you should consider collecting, along with a suggested tool or command. This table is deliberately generic and does not apply to all flavors of Unix due to differences in each operating system. However, it should be a good reference for you when creating or maintaining a Unix live response kit.
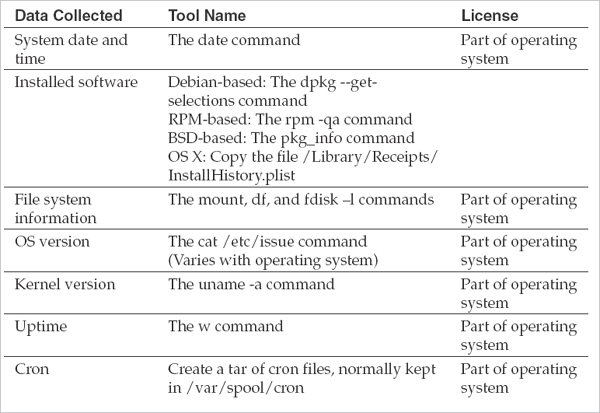

For each version of a Unix-based system you intend to support, you will have to do extensive testing to ensure everything works. We recommend retesting even minor version updates of the same distribution of operating system.
Memory Collection
Every version of Unix and BSD handles the memory device differently. Linux, as well as some other flavors, has also changed its security model to prevent traditional access. In the next few sections we cover a small number of common variants. If you should happen to be faced with an odd situation (IRIX or Solaris, for example), research the path to the memory device node and attempt to use dd. As we’ll discuss in the analysis chapter, analysis of the collected memory image is generally the larger problem with Unix or BSD memory images.
Collection from Linux Kernels
In earlier versions of Linux, you could simply use a common forensic disk-imaging tool, such as dd or DCFLdd, to capture the contents of memory through the/dev/mem device. However, security improvements in recent versions of the Linux kernel prevent direct access to memory devices, even when running as the root user. A special technique is required to gain access to memory. The most common solution is to use a loadable kernel module (LKM) that provides direct access to memory. The best free solution we’ve found is an open source tool called the Linux Memory Extractor, or LiME. The tool allows you to capture memory from a Linux-based operating system and save the image to either a local file or a remote location over a TCP connection.
GO GET IT ON THE WEB
Linux Memory Extractor website code.google.com/p/lime-forensics
The primary challenge to successfully using LiME is that because the tool is a loadable kernel module, it should be compiled for the exact version of the kernel that is running on the target system. Also, in version 1.1 (r14) of lime.c, there was no ability to include the generation of cryptographic checksums of the output. Be sure to compute and store a checksum, such as MD5, with the output you generate. We tested LiME on a number of popular Linux distributions, including Ubuntu, CentOS, Debian, and openSuSE. The kernel versions tested included 2.6.18, 2.6.32, and 3.1.10 (both 32 and 64 bit). In all cases, the tool compiled and worked without any issues. Documentation on the use of the tool is available in a PDF on the LiME website.
Because not everyone is familiar with compiling loadable kernel modules, let’s step through the process of capturing memory from the latest version of Ubuntu desktop available—version 12.04. The first step is to download LiME. Downloads are available at the following link.
GO GET IT ON THE WEB
Linux Memory Extractor downloads code.google.com/p/lime-forensics/downloads/list
The version 1.1 package is a standard Unix tarball. Extract the file with the tar xvf <filename> command, and then use make in the src folder to build LiME. Be sure to avoid performing these steps on the target system.
Once the make process completes, you should have a file with a .ko extension in your directory. The version number that is part of the file name will correspond to your kernel version. This is the compiled LiME Linux kernel module:
Be aware that some distributions of Linux do not have the required Linux kernel headers or source files installed by default. LiME requires them to be able to build properly. You will have to install the kernel headers and source if they are not present. Most modern Linux distributions make this easy through their package manager. A few Internet searches should quickly reveal what is necessary for your platform.
To continue, copy the resulting .ko file to removable media or some other external location where you plan to store the memory image of the target system. You would then go to the target system and mount or connect the media with the LiME module. You then load the LiME module, just like many other kernel loadable modules, with the insmod command. There is a required parameter named “path” that is used to specify what LiME should do with the memory capture output. There are two output methods: the first specifies the file name to save the memory image to, and the second instructs LiME to listen on a network port and wait for a connection to transfer the memory image to. There is a second required parameter named “format.” The default we use is the “lime” format, but others are available. These options are both fully covered in the LiME documentation.
Let’s cover the commands you would use in a couple of situations. In the first case, we’ve mounted an external USB drive to/media/usb. We’d like to store the memory image to the/media/usb/system1_memory directory. To accomplish this, you would execute the following command:
LiME v1.1 provides no console output unless there is a fatal error. The expected behavior is to return to the shell prompt after a few minutes.
The second use case is to instruct LiME to listen on a TCP network port for a connection and then transfer the memory capture. The following command instructs LiME to listen on TCP port 4444 for a connection:
On a system where you will store the image, you can use the netcat command to connect to port 4444 on the target system (in this case, 192.168.100.10) and redirect the memory capture to a file:
Netcat provides no console output unless there is a fatal error. The expected behavior is to return to the shell prompt after a few minutes. If you execute an “ls” on the output directory, the system1_memory.dump file should be present and of the expected size. Speaking of expected size, if you don’t know the size of memory on the system, you can execute the “free” command to display the total available memory:
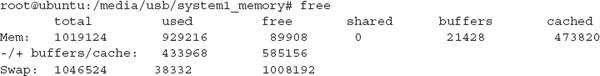
In this case, the free command shows there is a total of 1,019,124Kb (~1GB) of physical memory on the system, and the size of the output file should be consistent with the size of memory.
Collection from BSD-Based Kernels
You can perform memory acquisition in FreeBSD, NetBSD, or OpenBSD directly against the “/dev/mem” device with an imaging tool. Ideally, you should use a tool such as DC3dd or DCFLdd. Because those tools are not normally preinstalled on BSD, you will have to download or compile them (on a non-compromised system), then include them as part of your trusted response toolkit. See the chapter on forensic duplication for some tips on compiling DC3dd. The BDS “Ports” system may also have precompiled versions of DC3dd or DCFLdd available. DCFLdd is easily installed in FreeBSD by executing the following:
Be sure to install the target OS in a virtual machine or physical hardware, and compile and test there before moving to the actual target system. Once you have DCFLdd on your portable media or other appropriate location, the generic command to capture memory is:
However, there is one thing in particular to be aware of. In recent versions of the BSD operating systems, the/dev/mem device does not have an end of file (EOF)—so the dd command will run forever, or it may crash the system. To deal with that, you must limit the dd command with the “count” option to transfer the exact size of memory and stop. You can view the size of physical memory, in bytes, by executing the following command:
On some versions of BSD, you may need to query the hw.physmem64 object. This is normally the case if you see that the hw.sysmem value is negative. The output of the command shows the size of memory in bytes:
For performance reasons, it’s normally best to transfer data in chunks larger than one byte. Therefore, we recommend you divide the size by 4,096 bytes—the typical size of a page of memory—so you can transfer data in 4K blocks instead. In the case of the size of memory displayed previously, we would to transfer a total of 61,701 4K blocks (252,727,296 / 4,096 = 61,701). The following command carries out that transfer:
Of course, be sure to store the output to an appropriate location, and not back to the system you are capturing the memory from. A good option is an NFS share, an encrypted network channel with cryptcat or stunnel, or media attached via USB.
Collection from Apple OS X
Despite our extensive response experience, we have not yet encountered the requirement to perform a memory dump on an Apple OS X–based system. Considering Apple’s increasing popularity and market share, we did some research to find an acceptable memory capture tool. We found two tools we thought were acceptable: Memoryze for the Mac (from Mandiant) and the Mac Memory Reader (from ATC-NY).
Memoryze for the Mac The first tool we cover is Mandiant’s Memoryze for the Mac. Memoryze for the Mac version 1.1 both collects and performs analysis on memory from the following supported Apple OS X systems:
• Mac OS X Snow Leopard (10.6) 32/64 bit
• Mac OS X Lion (10.7) 32/64 bit
• Mac OS X Mountain Lion (10.8) 64 bit
GO GET IT ON THE WEB
Memoryze for the Mac www.mandiant.com/resources/download/mac-memoryze
As with any live data collection procedure, the first step is to place the tool on external media or other appropriate location that the target system can access. Then go to the target system, mount the media or share, and execute the tool, saving the memory file back to the same external location:

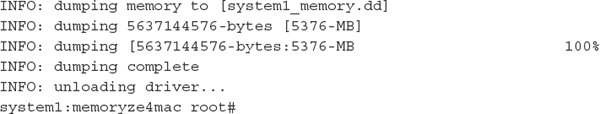
The main drawback with Mandiant’s Memoryze for the Mac 1.1 was that it did not have a built-in option to compute a cryptographic hash of the output.
Mac Memory Reader The second tool we found is the Mac Memory Reader, from ATC-NY. Mac Memory Reader only collects memory contents; ATC-NY provides separate tools for analysis. If you are part of a U.S. law enforcement organization, a number of their tools are free, so you should definitely check them out.
GO GET IT ON THE WEB
Mac Memory Reader cybermarshal.com/index.php/cyber-marshal-utilities/mac-memory-reader
Place MacMemoryReader on external media or other appropriate location that the target system can access. Then go to the target system, mount the media or share, and execute the tool, saving the memory file back to the same external location:
This command redirects the output of the command to a file named system1_memory. log, including an MD5 cryptographic checksum of the captured memory that was computed along the way. The default output format for the memory image is Mach-O. If you require a raw (DD) image, you can use the -P option on the command line.
Individual Process Dump
Just as with Windows systems, when you are looking at a Unix system, you may want to capture the memory space of just one process. In the good old days, all you had to do was dd/proc/<pid>/mem, where <pid> was the process ID of the process you wanted to dump. In most modern flavors of Unix, however, this is no longer possible for security reasons. You will have to use a tool, such as gcore, that is specifically made to access and dump the memory space of a process.
Gcore is part of gdb, the GNU debugger. Gcore is actually just a shell script that runs gdb, attaches to the specified pid, creates a core dump, and then detaches. More information, including source code, for the GNU debugger project is available at the following website.
GO GET IT ON THE WEB
GNU Debugger website www.gnu.org/software/gdb
If gcore and gdb are already installed on the system you are investigating, and you have no reason to doubt they are trusted files, you can dump the memory of a process by running this command:
This command dumps the memory for pid number 4327 into the file/mnt/usb/case12-tag001-pid4327-sysauthd.img. The naming convention here includes the case number, tag number, and the pid and process name as part of the file name. There are many acceptable naming conventions; this is just an example. Be sure to standardize on one as you document processes and procedures. This will help you to stay organized, especially if you are capturing memory from many processes.
In some cases, things may not be so simple. If gcore is not installed or you have reason to suspect that the attacker has tampered with the gcore script or the gdb binary or associated libraries, it will be a bit more difficult to use gcore. The most straightforward approach is to build a static gdb binary and copy the gcore script from a trusted source. This will require access to a clean operating system that is the same distribution and version as the system you are investigating. Our best advice would be to seek out the help of an expert to assist you through the process.
SO WHAT?
Live data collection preserves volatile data and helps you to get answers quickly. The old approach of “image everything,” although sometimes appropriate, is rarely effective. In extremely time-sensitive, critical situations, the proper use of live data collection techniques will make the difference between attackers stealing millions of dollars, or just causing a minor disruption in business. Your diligent preparation will allow for smooth and efficient live collection of data, and will help prevent a breach from becoming a disaster.
QUESTIONS
1. What investigative questions is a live data collection likely to help answer?
2. Should you perform a live data collection on each system you suspect is compromised? Explain your answer.
3. In what situations would collecting an image of memory be most useful to the investigation?
4. During an investigation, you identify a suspect system that runs an operating system you have not dealt with before. You are tasked with performing a live data collection. Explain how you should proceed to gather live data.
..................Content has been hidden....................
You can't read the all page of ebook, please click here login for view all page.