

Initial Development of Leads
As we noted in Chapter 2, leads are actionable items about stolen data, network indicators, identities of potential subjects, or issues that led to the compromise or security incident. In this chapter, we present the various methods of turning leads into actionable items and discuss methods for generating indicators and sweeping an environment to detect where malicious activity has occurred. Actionable items, or tasks, are the sole means for getting anything done in the course of an investigation. They can be indicators that you can use to sweep your entire enterprise, network traffic signatures, or merely serve as a resource if an employee needs to be interviewed.
Keep in mind that a lead or an indicator is simply a way to characterize some tangible element relevant to an investigation. It can be a search for something that you know exists (an artifact of malware or the contents of a user’s browser history) or something that you know is suspicious in aggregate (a sequence of user-related or kernel-related events). |
DEFINING LEADS OF VALUE
What is a valuable lead? We discussed in Chapter 2 that a good lead has three characteristics:
• The lead must be relevant.
• The lead must be actionable.
• The lead must have sufficient detail.
Sorting the good leads from the bad is important, especially when you have a limited team with limited time. The process of lead generation should be continuous. During most computer intrusion investigations, if you find that leads are becoming scarce, it is often due to the investigative methods rather than an actual lack of data. Depending on the state of the investigation, you may want to create an informal process to categorize and prioritize leads. This process is especially useful with new IR teams. We perform the following three operations on leads before allocating time or resources:
• Clarify the data.
• Verify the veracity of the lead.
• Determine the context of the lead.
When a potential lead is first derived from or generated by a source—be it a human or automated monitoring system—we attempt to gather additional data that will support the lead. For example, if a network intrusion detection device alert was generated that stated a connection was made to a known command-and-control server, we would begin a process to collect supporting data: identifying the internal origin of the connection if it wasn’t available in the alert due to NAT, inspecting the raw packets that generated the alert, and searching records of other connections made by that host, for example. This initial effort is limited in scope to information directly related to the potential lead. By examining the data supplied in the potential lead, we can move toward a more clear action.
The second operation we perform is an attempt to verify the type of lead. Is it complete? Is it a “brittle” lead that is based on methodology indicators or the presence of specific raw data? This process varies widely based on the data source, especially when humans are the ones who present a potential lead. To determine the veracity, you need to understand the observables used to generate the lead and understand the process used by the generator. If it is as simple as “the network monitor observes traffic for packets with data at offset x” and you know that the signature’s false positive rate is low, this is a simple check. If humans are involved and you can’t easily determine whether the person has indeed observed what they thought they did, the lead may not warrant your team’s immediate attention.
Finally, we determine the context of the lead. Is the system or human reporting information that has been misinterpreted as an effect of an otherwise expected issue? This happens far more often from human sources, but automated ones can provide equally misleading data if not configured correctly.
These three steps are not taken for every lead, because sources themselves can be vetted immediately during an investigation. Furthermore, the process is quite informal. These steps serve as a framework for teams that must determine whether leads are worth the time to pursue.
ACTING ON LEADS
Your team has a pile of good leads: a spreadsheet of potentially suspect IP addresses, a list of malicious files’ MD5 hashes, and a bit of intelligence that a system in your organization has been communicating to a command-and-control server over TCP/443. Now what?
We need to turn these leads into viable indicators, the kind that can detect the ongoing events as well as future attacks. You also want to be able to detect suspicious conditions that aren’t directly related to the information you currently have. After all, you know that something else must be occurring in order to allow those suspicious connections to be initiated. In this section we walk through an iterative process that occurs over the lifetime of the investigation.
We also cover more traditional leads—those that require humans to converse, a topic you probably weren’t expecting in a book on investigating computer crime.
As an IR professional, you have few choices of the tools you use to accomplish a task on an enterprise scale. As we discuss in Chapter 7, both Guidance Software and AccessData have Live Response plugins or versions that support the retrieval of data. Our company, Mandiant, also has a product and platform for enterprise IR as well as free tools one can use in smaller environments. System administrators can also perform a subset of functions presented using Microsoft System Center Configuration Manager (previously SMS). We can’t lie, however. We prefer our own tools here at Mandiant to the others for a number of solid technical reasons. As we present indicators, we will use the OpenIOC standard, but the elements can be easily adapted to your enterprise IR solution. |
Turning Leads into Indicators
Most of the leads that IR teams generate consist of detectable characteristics of malicious actions. They can be represented in two types of indicators. The first type, property-based indicators, describes a set of known observable characteristics of malicious software or actions—a registry key, an MD5 hash, or a mutex with a unique name, for example. Some leads are less specific, where a combination of characteristics can define a malicious or suspicious act—unexpected executable files in the /Windows/Help directory, for example. We call these methodology-based or anomaly-based indicators. These all can be turned into indicators that one can use with single-run or enterprise-wide live response to help determine the scope of an incident. Recall that we use indicators primarily for the scoping of an incident; discover once, search everywhere.
Leads can result in host-based indicators, network-based indicators, or a combination of both. Imagine the ability to take all of the intelligence you learn from reverse-engineering a remote access trojan and rapidly tasking your network and server teams with performing searches for existing data and monitoring for future events.
The Lifecycle of Indicator Generation
The lifecycle of indicator development starts with some amount of initial information, as one would expect. Any potential data source can feed this process. The most useful results come from high-fidelity sources such as a forensic examination or a quality malware analysis report. At times, the initial information consists solely of simple characteristics of a suspected attack. In any case, the team members responsible for the generation of indicators should follow a process before unleashing an indicator across the enterprise or importing it into the network security monitors, especially if the indicator is from an external source.
Indicator development is an iterative process where the target is to generate robust, sustainable signatures that can generate reliable information. This begins with the first pass at indicator generation. After you gather your initial data, you begin the Create/Edit (Indicator) stage, shown in Figure 5-1. That process embodies more than opening a text or XML editor and copying MD5 hashes in. You should have a good understanding of the indicator language and the processors in place. Oftentimes, the capabilities of a processing engine are well documented. It is usually the limitations and nuances you have to watch out for. An example of a potentially troublesome nuance of the Snort platform is the time required for a preprocessor to operate on the incoming data stream. A change in any number of variables (the packet arrival rate and the volume of fragmented packets, for example) can cause an otherwise well-functioning sensor to drop packets and miss data. Another example is the indexing engine used in several forensic analysis suites. In some cases, special characters are used as a word break or are simply ignored when a search index is built, leaving the analyst without the ability to perform a useful search should an indicator require special characters such as $ and @. An experienced analyst would understand the limitations and know how to mitigate their effect.

Once an indicator has been generated, it needs to be verified before it is put into circulation or use. In our indicator development lifecycle, the Verify stage is split into two methods: Data Relevant to Indicator and Data Common to Environment. Verification through both of these methods will ensure that the indicator is both accurate and precise for an intended purpose. We will discuss verification of indicators later in this chapter.
Information learned from the verification is fed back into the indicator for refinement. The cycle continues until the indicator is sufficiently formed, such that the investigators can use the indicator reliably. This process ensures that the indicator yields the expected results. At this point, it can be considered for deployment or dissemination, which is the Publish (Indicator) stage.
Let’s dig a bit deeper into the Edit and Verify steps from the lifecycle diagram. As your investigation proceeds, this cycle will repeat itself many times over, for numerous indicators. Without structure, it can be easy to create noisy indicators that generate a lot of extra work. Note that we gave an example of a possible limitation of a Snort signature; however, the process is equally applicable to host-based indicators. We’ll address both types.
Editing Host-based Indicators
Host-based indicators are the means by which we perform binary classification of an endpoint; the endpoint is either of interest in your investigation, or it is not. We create indicators by assembling a set of observables that describes a condition we know to be suspicious. Whether or not those observables result in the direct determination that a system is compromised depends on the quality of the members of that set.
A good host-based indicator is composed of a number of observables that are specific to a particular activity, yet general enough to apply to a derivative of the activity. It can be a difficult balance to achieve, particularly when the observable is based on a weak or incomplete lead. This can be best described through the following example.
The first scenario to examine is creating an IOC that is primarily based on properties of a file or artifacts created by its execution. For this exercise, we will examine a binary from the book Practical Malware Analysis (No Starch Press, 2012). We have chosen the binary file Lab03-02.dll from the Chapter 3 labs. You can download the full collection of lab binaries from the book’s website, listed next.
GO GET IT ON THE WEB
Given this binary, let’s look at a very simple indicator that will identify or describe the file. This indicator consists of a single, high-confidence check—the file’s MD5 hash. Over the next few pages, we’ll present indicators in pseudo-code rather than a structured IOC language. Here’s the first:
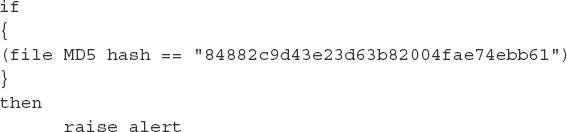
This indicator of compromise (IOC) has some very good attributes. The IOC is looking for a single, distinct property—the MD5 hash. This provides high confidence that if there is a match, we have found exactly what we are looking for. The false positive rate for an MD5 hash is very low—we would rarely, if ever, get a match on something that was not the file we were looking for. However, this IOC is also very limited. If a single bit is changed in the file we are looking for, this IOC will no longer match because the MD5 hash will be different. Because it’s easy for attackers to change file contents but still retain functionality—perhaps to change an embedded IP address, for example—this IOC will not be effective for very long. We’re not suggesting that using the MD5 hash is a bad idea. However, using only the MD5 hash in an IOC is less than ideal. We need to look for other attributes.
Windows executable (PE) files have a number of data structures that we can also examine and potentially use to our advantage in an IOC. For example, the PE header contains a compile timestamp. This is a date and time that the compiler inserts when the file is compiled. Sometimes attackers will compile a binary and then manually make changes to it afterward. In some cases, the compile timestamp is unique enough to search for by itself. However, we usually pair the timestamp with something else, such as the file’s size, to minimize the chances of a false positive. So let’s update our previous IOC to include these new conditions:

The IOC is still looking for the MD5 hash, but now we are also inspecting the compile-time stamp and the file size. If the attacker changes a few bits in the file, with this version of our IOC we have a better chance of catching it. But if the attacker adds or removes data from the binary, the size will not match and we will not find the file. Let’s look at improving the IOC even further.
If you analyze this binary, you’ll find that it can perform a number of actions on a system. For example, the binary can install a Windows service and may also connect to a site on the Internet. Both of those facts are good to know, because we can look for artifacts related to them. It’s important to realize that these items are not direct attributes of the file. They are artifacts created on a host when the binary is executed. In other words, we’re looking for the effects of executing a file versus looking for the file itself. It’s good to include these types of items in an IOC because the binary may no longer be present on the system, or file attributes the IOC is looking for may have changed. As we’ll talk about later in this chapter, it’s also important to understand the attack lifecycle so you can include any related artifacts in the IOC. For this scenario, we will just look for two additional items: the specific service name the binary creates and a DNS cache artifact related to the host name the malware connects to. The updated IOC is shown next:
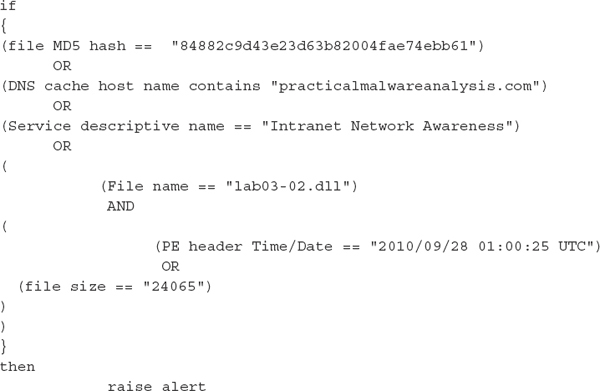
This IOC includes conditions that make it much better than what we started with. The IOC will work even after some changes to the binary, and the IOC can now find artifacts the binary creates on a host. Of course, we can make it even better if we spend more time reviewing all of the unique aspects of the binary and the artifacts it creates. Because that list could get very long, we normally seek a balance between too little and too much. Exactly where we fall normally depends on the available characteristics of the file and the details of the overall incident.
Another way to improve an IOC is to describe what the binary can do. This is normally done by examining the import table. In some cases the import table is not useful—this could be due to a packer or because the author coded the binary to manually import functions. Taking a look at our sample binary, we see a large number of imports. Any individual import is not unique enough—most malware uses functions common to many other types of software. What is unique, though, is that subsets of the functions are not commonly found together in a single binary. We need to construct an IOC with multiple indistinct or loosely attributable properties. The IOC shown here captures a relatively unique combination of the functions imported:
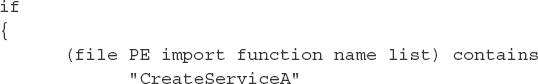

This IOC will find the binary based on the import function list. As long as that does not significantly change, the attacker could modify major portions of the code or change configuration options, and our IOC would still identify the binary. Now that we’ve walked through an example of creating an IOC that describes the attributes of a given file, let’s take a look at a different situation.
Many times we need to create IOCs that describe what an attacker does—because there is no associated malware. Therefore, let’s build an IOC that can be used to detect a typical sequence of actions that one may observe from an attacker. These IOCs are known as methodology-based indicators and may incorporate property-based indicators with information on artifacts left behind by an active attacker. A great example of an attack whose characteristics can be modeled as a methodology-based IOC is the sethc.exe replacement attack. No malware is used, because it consists of simple registry changes or the replacement of a single file. The sethc.exe application on the Windows platform is an accessibility enhancement that helps people with various disabilities use Windows. It is invoked by pressing SHIFT five times in rapid succession and can be launched prior to a successful logon. Attackers have used this function to launch a cmd.exe session running with System privileges.
There are two primary means of executing this attack. First, the trigger sequence (five keypresses) will launch any executable image that is located at c:windowssystem32sethc.exe. A simple replacement will do the trick. Second, one can add cmd.exe to the sethc executable’s debug handler in the registry because Windows does not check to ensure that the handler actually points to a debugger.
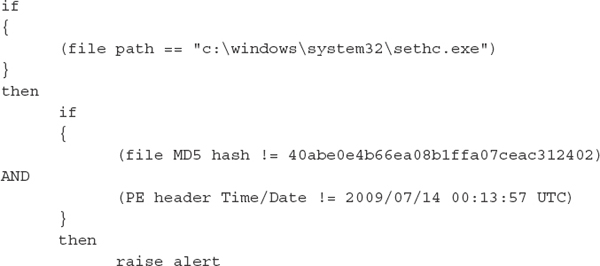
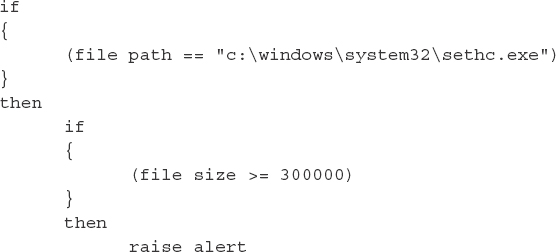
What indicators can we use to detect if a system is going to have some security problems related to sethc.exe? We can start with the file system and examine whether the sethc.exe binary isn’t what it is supposed to be. The expected MD5 hash for c:windowssystem32sethc.exe in Windows 7 SP0 is 40abe0e4b66ea08b1ffa07ceac312402. Using PEView, discussed in Chapter 15, we also know that the time/date stamp stored in the PE file header is 2009/07/14 00:13:57 UTC. If we can sweep every Windows 7 SP0 system and get an alert when the file in path c:windowssystem32sethc.exe does not have those two properties, it would be a great way to identify compromised systems.
A sample indicator in pseudo-code would be the following. Keep in mind that a matching engine would evaluate the pseudo-code on every node visited during a sweep. The first “if” statement evaluates when the process arrives at the file c:windowssystem32sethc.exe.
It is unlikely that your enterprise consists of solely Windows 7 SP0, however. You would need to know the versions and patch levels of every system you are sweeping and generate additional logic for each.

The indicator quickly becomes unmanageable. Either using the NOR operator or running a comparison against lookup tables is a more efficient way to implement this indicator. Unfortunately, most indicator languages don’t support the NOR operator and lookup tables. When we needed to implement this indicator, we had to step back and consider the other metadata available during a sweep. In our experience, the attackers always replaced the sethc binary with cmd.exe. Noting the difference in file sizes, we examined a representative sample of the environment and discovered that the file size of cmd.exe was always at least 10 percent larger than the largest sethc binary. Therefore, we drafted the following pseudo-code, known as the Sethc CMD Replacement indicator:
This indicator was simpler and executed more quickly because computing a hash was unnecessary. We knew that there was a possibility that somewhere in the environment sethc.exe may have been replaced with an application smaller than the threshold. We mitigate that risk by running additional sweeps using other semi-unique attributes.
To identify whether the image-specific debugger was used, you can search for the presence of related keys in the registry. The registry key used to link a command to sethc.exe’s image execution debugger is shown next. If this key has any value set, the system should be examined. Again, keep in mind that a matching engine would evaluate the pseudo-code on every node visited during a sweep. The first “if” statement evaluates when it arrives at the registry key shown. The following pseudo-code is known as the Sethc IS Debugger indicator:

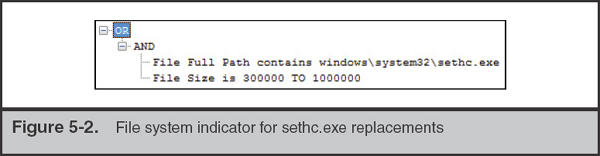
Let’s assemble the final two fragments of pseudo-code into indicators of compromise in the OpenIOC language. We want our system to alert if the conditions on the file system indicators are false or if the listed registry key exists. The file system indicator for anomalous sethc.exe binaries, discussed earlier as the Sethc CMD Replacement indicator, is shown in Figure 5-2. You may notice that the information in the OpenIOC-formatted indicator is a bit different from the pseudo-code previously presented. Recall the earlier discussion on knowing the limitations of the tools you are working with. There are two differences to note here. First is the partial path in the OpenIOC format. We want this to detect regardless of the volume, so we use the “contains” term on the file’s full path. The second is the use of a range rather than an inequality. This is a limitation of the query tool we used. The matching engine would not evaluate inequalities.
The OpenIOC version of the registry indicator, discussed as the Sethc IS Debugger indicator, is shown in Figure 5-3. Note that the registry path in the figure has been split to fit the width of the page.

Editing Network-Based Indicators
The purpose of a network-based indicator is similar to a host-based indicator: you are attempting to make a rapid determination of whether a particular session is relevant to your investigation. The properties and attributes you choose are dependent on the capabilities of the monitoring system you have in place. They also define the type of indicator you create. Most indicators are simple: “if a given set of bytes is present in the first n bytes of a session, raise an alert,” for example. These indicators may have a limited lifespan due to changes an attacker can make in their tools or procedures. How many network signatures have you seen for a remote access trojan such as Poison Ivy? Each malware author (or editor in this case) has the choice of many options when creating the PI payload that can make detection difficult. If an investigation runs for any significant length of time, you’ll likely be editing network signatures for the malware many times over.
In the previous section, we examined a malicious binary named lab03-02.dll. We were able to identify a DNS cache artifact (the DNS cache host name contains “practicalmalwareanalysis.com”) that could be used during a host sweep. Let’s continue that analysis to identify network signatures that can be used to identify the presence of that malware.
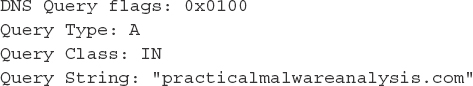
From what we have learned so far, it appears that the malicious binary looks up the host name practicalmalwareanalysis.com. A network monitor can easily detect this DNS lookup; however, if different versions of the malware were deployed, relying solely on the DNS lookup may be troublesome. We can also assume that the binary attempts to connect to this remote system, but in order to assemble a better indicator, we need to examine the binary in greater detail. We discuss network monitoring in a later chapter, but let’s assume you either have caught the network traffic on a live network or have performed enough malware analysis to observe the behavior shown next.
Monitoring UDP port 53 for the DNS standard query, whose primary fields are shown here, can catch the lookup request:
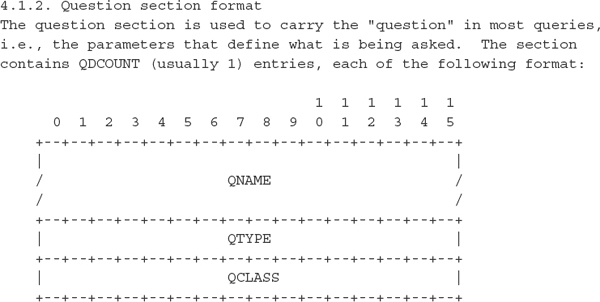
If we were to refer to page 27 of RFC 1035, “Domain Implementation and Specification,” we could build a signature for the data format used in the packet itself. The following text is the relevant excerpt from the RFC. It describes what we should expect to observe during a query.

GO GET IT ON THE WEB
Request for Comments (RFC) Repository at the Internet Engineering Task Force
The description for the QNAME portion of the query tells us that a simple string search for “practicalmalwareanalysis.com” would fail. The payload contains a null-terminated sequence of strings, each with a single octet reserved for the length of the string. We would expect the QNAME portion of this query to contain the following data:

Using the Snort manual, we can assemble a signature that will alert when the sensor observes this specific query:

This signature will alert when UDP traffic contains the content “|18|practicalmalw areanalysis|03|com|00|” using a case-insensitive search. This signature’s description is “Lab03-02.dll Malware: practicalmalwareanalysis.com,” but any lookup will trigger this alert. A notification threshold is included to minimize duplicate events.
It is fairly trivial for a malware author to change static host names such as this. There may even be additional domains or IP addresses that were not discovered during the malware triage that was performed. A better indicator can be built that identifies the actual communication between the malware and the external site. To get a capture of the packets sent and received between the malware and the remote site, we need to let the malware execute in a safe manner. This is a multistep process that we will outline here. You can find much more information about this process in the Chapter 15.
In an isolated environment, we took the following steps to get the malware to communicate. Note that more information on how to safely execute malware for analysis purposes can be found in Chapter 15.
1. Began monitoring the isolated network using tcpdump.
2. Loaded the library into a Windows XP “victim” system and called the method installA.
3. Waited until the malware performed a DNS lookup and verified that the first query was “practicalmalwareanalysis.com.”
4. Added the practicalmalwareanalysis.com domain into a phony DNS server, pointing the domain name to a Linux system running Apache, configured to log all requests.
5. Restarted the test by unloading and reloading the library and called the method installA.
6. Observed that the connection to the remote host contained a single GET request for /serve.html.
7. Stopped tcpdump and analyzed the packet and connection attempts in Wireshark.
The result, as shown in Figure 5-4, is that the malicious library requested the URI /serve.html. Additionally, the malware provided the user agent string user-ece3629572 to the web server. Upon first look, that user agent string is fairly unique. It may be tempting to use that as part of an indicator. Unfortunately, in this case, the malware author simply copied the machine name into that field in the packet. As a side note, you can use this field in your signature to help determine the source of the connection, regardless of whether a NAT or proxy is in place.

In this situation, we have a fairly weak indicator. The malicious library requests a URI that is likely to generate false positives. Nonetheless, it may be worthwhile to deploy the signature and observe how much traffic gets identified. The following Snort rule searches for the string “serve.html” in the normalized HTTP URI. The search is performed on established flows on the client-to-server communication.

To improve the detection of the malicious communication, you may want to create network signatures that identify the payload returned from the remote site. The malware we presented here receives an HTTP 404 error; however, the additional information returned by the server may be of interest. When the server replies with an actual file or an extended status/error message, that portion of the communication is far less likely to generate false positives.
This was a greatly simplified example of the development of a network-based lead. If you have Snort (or a Snort-compatible IDS) in place, you can find a large number of books and online resources that can help you generate efficient alerts.
GO GET IT ON THE WEB
Snort User’s Manual manual.snort.org
Snort IDS and IPS Toolkit, by Beale, Caswell, and Baker (Syngress Press, 2007)
Verification
Most of our investigations cover thousands of systems, and many have been over 100,000. Your organization may easily reach that number of endpoints. With that many endpoints to scan, one must be cognizant of the specificity of the indicators and the volume of data the results generate. Whether you use an enterprise-grade IR system, deploy System Center Configuration Manager, or deploy shell scripts, you need to run your indicators against a representative sample of systems in your environment before turning them loose on a large population.
In our indicator lifecycle shown earlier in Figure 5-1, we show that two reviews are performed during verification. The first is titled “Data Relevant to Indicator.” This appears obvious, but after generating an indicator, you’ll need to verify that it performs as intended. The efficacy of an indicator can vary widely due to the properties it identifies. We already discussed the difference between indicators composed of very specific properties and indicators composed of multiple indistinct or loosely attributable properties. Additionally, you will want to ensure that the properties in a new indicator do not identify the malware or activity solely at a specific point in its lifecycle. For example, consider the following common scenario of the lifecycle of an attack:
1. E-mail is sent into an organization with a malicious payload. The payload is an executable file (a “dropper”) that appears to be a Word document to an unsuspecting user.
2. The user, believing that the Word document is real, opens it and launches the executable.
3. The executable drops an actual, innocuous Word document and opens it for the user, while downloading and launching a second-stage malicious file in the background.
4. The malware removes the dropper from disk.
5. The second-stage malware continues on its way, doing what malware does.
A less effective indicator would be comprised solely of the MD5, file name, or properties of the dropper. This type of indicator is what automated processes that simply scan e-mail for threats typically generate, and one we see on many of the “bad file” spreadsheets that are distributed through informal channels. It is valid on a host for a finite period of time, typically seconds or minutes before the user inadvertently launches the dropper. On the other hand, if the analyst were to examine the e-mail payload more completely and generated indicators after understanding the lifecycle of the attack, the properties may also include the following:
• A file entry in the system’s prefetch directory.
• A file name for the innocuous Word document in a Most Recently Used (MRU) registry key.
• If the dropper used API calls to fetch a file, the retrieval of the second stage may be logged in the user’s browser history.
• DNS cache entries for the site that hosted the second-stage malware.
• The file metadata for the second-stage malware.
In summary, ensuring that the process identifies data that is relevant to the indicator, you should verify that what you are looking for and how it changes over time are captured properly in the indicator itself.
The second type of verification that is typically performed is called “Data Common to Environment.” This verification step is performed to compare the properties of an indicator to the environment in which it will be deployed. This verification step informs you if the properties in your indicator will match against your environment and perhaps overwhelm your investigation with multiple false hits. To verify that your indicator is appropriate for your environment, select a sample of clean workstations and servers that you will use as a test bench for new indicators. Run the indicator on the sample set and ensure that the parameters do not match against the unaffected systems. If they do, modify the indicator or review the initial data to determine a better approach. After you are satisfied that the indicator will not lead to many false-positive hits, slowly integrate it into your investigation. It usually takes time before we consider an indicator to be completely validated in a new environment.
Another verification we always consider is the performance of the indicator within an environment and its impact therein. If a team deploys a host-based indicator across an enterprise, it behooves the analyst to ensure that the impact on the systems is well known. To draw a parallel between IR and IT, regardless of what actually caused an outage, you’ll be the first to receive blame. Once you have an indicator that you consider ready for testing, identify a subset of systems that are representative of the environment. Specifically, you should include server-class operating systems in the set as well as desktops. Most IR tools affect servers differently than workstations due to increased RAM, storage, or the enterprise applications that are running. Use the resource manager to observe the load placed on the sample systems and determine whether it exceeds a comfortable threshold. An important configuration to be aware of is when you are sweeping a virtual computing environment. If a sweep is scheduled for multiple VMs running on the same hardware, you run the risk of causing a failover or resource starvation.
We have talked about leads that originate from systems or your security infrastructure, but an initial notification of a possible event could come from a user or administrator. There are no PERL scripts or automated agents on the market that will help in these situations. As an IR team, you may need to perform interviews and gather witness accounts of incidents. Although you do not need to train in interview or interrogation techniques, keep the following pointers in mind:
• Thoroughly document any statement. Be a stellar documentarian. The statements or first-hand account of the incident may not be the most accurate representation of what transpired, but noting when a user opened an e-mail or what they observed on a website may be important later in the investigation. It’s best to have a second person performing documentation during an interview. As a lead investigator, you need to be actively engaged in the conversation.
• Allow the interviewee to tell a story. They should talk more than you do. Earn a rapport with them. This is important given the situation you may put the interviewee in. Imagine your reaction if one afternoon a person from the Security Team, whom you never met, dropped by for a chat. Avoid interruptions by only asking clarifying questions as the interviewee relates the story as they see fit. Once they work through the incident from memory, revisit aspects that require more detail.
• Avoid leading questions and those that lead to yes/no answers. Keep the questions open-ended and note how the person recollects the events observed.
• Collect the facts before allowing the interviewee to opine. If a systems administrator took action after noticing an issue, get the details of those actions and build a timeline before asking why they made the decisions. Of particular importance is to allow the interviewee to continue without confrontation. Negative reactions on the part of the interviewer may lead the interviewee to withhold other details.
• Know when to get others involved. Conducting interviews of systems administrators who took action after an apparent attack on your network is one thing. Interviewing staff who are the subject of an internal investigation is quite different. Your legal team should be able to provide guidance, and their participation in the process is essential.
The key items to get into your case notes are the actions taken and the dates when they occurred. If you can get log files or notes taken by the administrators or other personnel, secure them as well. As time passes, the individuals’ memory will fade, so interview early.
Resolving External Leads
At times, you will need to acquire data from an outside source. This generally means that you need to engage your legal team for help in assembling requests for preservation or subpoenas. Generally, an external party is under no obligation to provide you with information; however, some may provide as much assistance as they can if it does not cause undue risk.
Private organizations cannot serve grand jury subpoenas, 2703(d) court orders, or subpoenas, so they must rely on one of the following methods:
• File “John Doe” lawsuits and subpoena the provider or organization that possesses the records for the source address or e-mail.
• Rely on pre-litigation discovery mechanisms. Depending on the state, these options may not be available.
• If the issue involves copyright infringement, the Digital Millennium Copyright Act provides for pretrial identification subpoenas.
• Report the incident to law enforcement agents and hope that they will investigate and prosecute criminally.
Keep in mind that these external leads can involve other victims. Although the initial contact may be a bit awkward, once everyone agrees on what data can be exchanged and protected, coordination can be fairly fruitful to an investigation.
Filing a Subpoena to Perform Discovery
Depending on local rules of civil procedure, your legal counsel may be able to file a complaint, which can lead to a civil discovery. Using these tools, you may be able to compel an organization, such as an ISP, to divulge certain information about a subscriber. Filing a complaint is a fairly standard process for any lawyer, but they may rely on your team to assemble the necessary information. Each situation can be fairly unique, so meet with the legal team to discuss what information they require as well as to understand the thresholds they need to meet to initiate the process. This becomes part of your response plan.
Reporting an Incident to Law Enforcement
When you begin to pursue external leads, you may opt to report the incident to law enforcement instead of taking action through civil litigation. Many factors can play a role in this decision, and we have found that most organizations prefer to avoid notifying law enforcement. Although the investigative tools and legal options are far greater and more effective with their involvement, the primary justification for avoiding notification is simply to avoid a public relations issue. In the United States, there are very few situations where notification of criminal acts is required. Your counsel will know where these bright lines exist and will manage notification.
When your leads take you to foreign entities, such as ISPs or hosting sites, the process to obtain information can get quite complicated. In most situations, foreign governments require civil requests be filed through official channels. The State Department and federal law enforcement agencies maintain relationships with foreign governments and provide the means to request information from commercial entities in each country. The process can take a fair amount of time to complete, and we have found that some companies will respond to less-formal preservation requests when they know that official paperwork is being completed.
There are a few advantages to soliciting the assistance of law enforcement. As we mentioned earlier, they typically have greater capacity to investigate and prosecute. The tools at their disposal operate under a different set of rules. For example, when law enforcement officers serve subpoenas or court orders on companies to identify subscribers or customers, they usually receive a quicker response and the anonymous party is not notified. Another advantage is that law enforcement can bring criminal action against a party at no cost to your organization. Although there are costs associated with your investigation, including the preparation of materials that can support the criminal complaints, those costs are far less of a burden than civil action. If you have documented the incident appropriately, maintained a proper chain of custody of the evidence, have a clear and concise picture of the unlawful activity that took place, and can convey the information in a clear and simple manner, law enforcement should be able to initiate the steps the public sector cannot take—the search and seizure of equipment from private residences and retrieving logs from upstream sites. Keep in mind that an organization can always pursue civil litigation regardless of the outcome of the criminal case. The burden of proof in a civil action is preponderance of the evidence rather than beyond a reasonable doubt, which can help in the recovery of damages, as well as the costs associated with the investigation.
Another advantage is perspective. Oftentimes, although perhaps not immediately, federal law enforcement has the ability to aggregate data from numerous victims and can identify patterns and techniques. When properly shared, this information can be used during your remediation process to help defend against further incidents. The challenge is to maintain communication with the agencies you notify. Their primary goal is prosecution, which means that the dissemination of information is usually the last thing on their minds.
Many agencies participate in industry forums that are designed to share information from incidents. Through these groups, you can learn about the issues that others in your industry are facing, as well as forge relationships that are very helpful when external leads involve your contemporaries. Current groups that we have found to be very active and beneficial include:
• Infraguard An FBI-sponsored group focused on Critical Infrastructure Protection
• FS-ISAC Financial Services Information Sharing and Analysis Center
• DIB-CS/IA Defense Industrial Base Cyber Security/Information Assurance
GO GET IT ON THE WEB
Infraguard www.infraguard.org
FS-ISAC www.fsisac.com
DIB-CS/IA dibnet.dod.mil
In this chapter, we discussed a framework to help classify leads and act upon them so that your team can efficiently allocate precious resources. Regardless of the method you use to sweep an environment for indicators that test and generate leads, keep in mind the following points.
• Indicators are only as strong as the tool you use to search with. One tool may give great insight into user-land data, whereas another may be better when you’re examining actions performed by the kernel. Learn the constraints of every tool you use. We don’t rely on our own tools alone, and you should be suspicious of anyone who does.
• Test and validate indicators before deployment. Validate and monitor the effectiveness of the indicators while they are in production. Test against your baseline operating systems as well as known-compromised systems.
• Work alongside legal counsel during investigations, particularly when leads begin to resolve to external entities.
QUESTIONS
1. From the Practical Malware Analysis book (practicalmalwareanalysis.com/labs), generate host-based indicators for the binary file Lab03-03.exe.
2. In February 2013, Mandiant published a report that detailed the group known as APT 1. This report outlines the typical attack progression observed at numerous victim organizations. In the section titled “APT 1: Attack Lifecycle,” the typical process used for internal reconnaissance is described. Using the methodology described, generate a set of indicators that can help your organization identify this type of activity. Note that a methodology indicator does not necessarily identify malware. Consider both host-based and network-based indicators.
3. From the Practical Malware Analysis book (practicalmalwareanalysis.com/labs), generate host-based and network-based indicators for the binary file Lab06-02.exe. Note that you may be able to generate extremely effective network signatures if you perform dynamic analysis on the binary and understand what the malware is looking for.
..................Content has been hidden....................
You can't read the all page of ebook, please click here login for view all page.