

Network Evidence
When the prior editions of this book were published in the early 2000s, it was rare to find an organization that considered network monitoring an essential part of a good information security strategy. It was a practice one would find only in the organizations that had highly skilled Unix staff that optimized so well that the infrastructure nearly ran itself. Only then would a bored sysadmin or two spent time placing sensors on a few switches’ SPAN ports. As with nearly every topic revisited in this edition, this has changed significantly. The change has been so great that numerous companies, whose stock is traded on the open market, base their entire existence on enterprise network monitoring and the intelligence one can derive from it.
In what has become “traditional network monitoring,” solutions are implemented proactively. A number of enterprise solutions are available that can scale from a handful to many hundreds of sensor nodes. During an investigation, you may want to take advantage of an existing infrastructure for egress point monitoring, if your organization has one. If, however, your team cannot add or modify signatures on the sensors in a reasonable amount of time or you need to monitor an internal subnet, you may need to deploy your own tactical sensors. In any case, if your team has experience creating, testing, and interpreting network-based signatures, intelligence you gather from malware analysis and other sources can easily be used to detect additional malicious activity.
In this chapter we discuss how to build sensors that you can use during an investigation, what types of collections provide the greatest benefit to an IR team, and how to interpret data you have collected.
THE CASE FOR NETWORK MONITORING
There is typically no shortage of potentially actionable information during an investigation. Why add to the chaos by attempting to monitor egress points and internal networks? If a monitoring infrastructure is in place, a team can rapidly turn intelligence gathered from logs and malware into signatures that can help you to do the following:
• Confirm or dispel suspicions surrounding an alleged computer security incident
• Accumulate additional evidence and indicators
• Verify the scope of a compromise
• Identify additional parties involved
• Generate a timeline of events occurring on the network
In some situations, data captured by a network sensor or a device is the only evidence that certain actions were taken by an attacker. Take, for example, a POST request to an application server. Unless you have a proxy or the servers are configured with mod_security or similar, host-based logging will leave you blind. One of our scenarios in this chapter will demonstrate how to capture and decode commands sent to the server using the POST HTTP command.
When you begin to monitor your network during an IR, you can choose to collect four levels of detail. The first most closely resembles the level of detail you may be accustomed to through normal security monitoring: event-based alerts. Snort and Suricata are the primary applications used in this fashion. Two commercial packages available at the time of publication are Sourcefire and RSA NetWitness. When configured with well-tested and tuned rule sets, they will generate events (or alerts) when the predefined conditions are observed on the monitored network. The next two levels of detail collect packet and session information that fits a given criteria, and an investigator is needed to post-process the data to extract information useful for the investigation. These options are known as header and full packet logging. Finally, high-level statistics can be generated that show the nature and volume of the data moving through your networks.
GO GET IT ON THE WEB
Snort www.snort.org
Suricata www.openinfosecfoundation.org
Sourcefile www.sourcefire.com
RSA NetWitness www.emc.com/security/rsa-netwitness.htm
What capture method is going to be of greatest benefit to your team? Ideally, your platform should be capable of handling all four. If you have network-based indicators from malware that your team analyzed, the event-based alerting will give you real-time notification, which can help you quickly identify other infected systems on your networks. Header capture and full packet logging, when used sparingly, can help you identify the scope of data theft, capture the activities of attackers who use interactive shells, and more closely monitor communications between malware and remote sites. Finally, if you have very little information about an event, suspicious traffic patterns and transfer volumes can reveal interesting information on activities that are not otherwise detectable.
Event-Based Alert Monitoring
Event-based alerting is the form of monitoring that most IT and information security organizations are accustomed to. Numerous free and commercial platforms exist to help staff monitor an entire organization with little effort, at least in terms of deployment. This type of network monitoring is based on rules or thresholds employed on the platform. In their simplest form, events indicate the sensor observed something of interest. Traditional events are generated by a network intrusion detection system (NIDS), but events can also be generated by software that monitors traffic patterns and flows.
The standard tools for event-based monitoring are Snort and Suricata. Both have their strengths, and either may be appropriate for your organization, depending on your requirements. Rather than listing the pros and cons of each, which would be immediately out of date, we’ll refer you to the sites listed earlier. In this chapter we use Snort to demonstrate this type of monitoring.
Event-based monitoring relies on indicators (or signatures) that are matched against the traffic observed by the network sensor. Indicators can be simple, such as a combination of a specific IP address and TCP port (for example, alert when any computer on the network attempts to connect to the secure shell daemon on the web server). Simple rules are usually “cheap” to implement, in that they incur only a small load on the sensor. Indicators can also be complex. Complex indicators involve session reconstruction or string matching that requires the analysis engine to maintain connection states. Stack too many of these indicators on a sensor and you may find that it cannot keep up with the incoming data rate. The following is an example of a simple indicator that raises an alert if a system attempts a secure shell connection to a web server at IP address 192.168.2.78. It is configured to alert a maximum of once per minute, per source IP address.
GO GET IT ON THE WEB
Snort Reference Guide manual.snort.org
Numerous output plugins are available for Snort, and what you choose to enable in the Snort configuration file depends largely on how your team decides to manage the information generated by the sensors. We cover a couple of management consoles later, but the simplest output module is called alert_fast. It provides an easy means to validate whether certain rule sets are operating properly from the sensor’s shell by sending ASCII text to a file. In this example, the Snort configuration file contained the string “output alert_fast alerts.txt.” The indicator just shown generates an entry in the alert_fast output module once every minute, per source IP address, shown here in our output file, alerts.txt:
Detecting SSH connections to an internal web server is a rather simplistic example. The analysis engine in Snort matches on the IP and TCP headers only, and can discard the remainder of the packet if no other indicators have a partial (or potential) match. The Emerging Threat rules in the public domain provides for a huge number of real-world examples. Here is an indicator, written by Emerging Threats, that identifies the use of a fake SSL certificate used by attackers identified in Mandiant’s 2013 APT1 report:
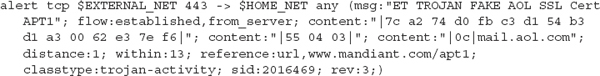
What is this indicator looking for? Referencing the information released in the APT1 report, we know that the certificate can be identified by a serial number, the validity dates, an issuer name, among other descriptive data. The folks at Emerging Threats chose to use a combination of the certificate serial number and the Issuer string. The first content string, beginning with “7c a2,” is the cert’s serial number. The second and third content strings identify when the three bytes 0x55, 0x04, and 0x03 are followed (at an offset of 1 to 13 bytes) by the byte 0x0c and the ASCII string “mail.aol.com”. Together, these latter two content strings identify the Issuer of the certificate. This results in a very robust indicator that is unlikely to return false alerts.
Header and Full Packet Logging
Full packet logging is used for the two distinct purposes during our investigations, and that purpose dictates the care and handling of the collected data. The first purpose is to collect data transferred between systems to help the IR team generate signatures, monitor activity, or identify data that may be stolen. The second purpose is to collect evidence to support an internal investigation or legal matter. These two goals may intersect at times, and it can be difficult to know if the matter may result in administrative or legal action at the onset of an investigation. Oftentimes, the decision on how to handle the data comes down to the subject being monitored. If your investigation leads you to capture all traffic originating from your corporate Windows-based DNS server that does not occur over TCP or UDP port 53, it’s a different situation than if you were to capture all traffic generated by that suspicious sales guy who you suspect is leaking information to a competitor. The latter certainly requires additional care when handling and storing the data. In many situations, if you cannot tell from the beginning where the investigation may lead, it is wise to track all captured data as if it were evidence, to include the maintenance of a chain of custody. It’s far better to create excess documentation at the beginning and relax the process as the situation changes than to face the consequences of a lack of documentation from the start.
The means by which the capture is performed is also affected by the purpose of the investigation. When the data that needs to be captured is in response to a definable event, IDS systems typically have the ability to retain the entire session of interest. This function can allow you to quickly gather malware, stolen data, and full sessions of interactive logins for analysis. We would not, however, rely on Snort or other IDS platforms for targeted collections against specific subjects. In these situations, we rely entirely on tcpdump or Wireshark.
Full packet monitoring yields the raw packets collected from the network. It offers the highest fidelity, because it represents the actual communication passed between computers on a network. The following is a packet captured in its entirety and displayed using tcpdump:


This 142-byte packet shows an HTTP GET request from a system at 192.168.2.40. This shows us the Ethernet frame, the IPv4 header, the TCP header, and the payload of the packet. We aren’t going to get in the weeds on packet disassembly in this book, as much fun as that would be. To learn the basics, find a copy of W. Richard Stevens’ TCP/IP Illustrated, Volume 1: The Protocols. There are innumerable references on the Internet that you can use to build your skills as well.
Header captures simply retain a portion of each packet. The intent is to gather the Ethernet, IP and TCP, or UDP headers while storing little, if any, user data by limiting the capture length to approximately 64 bytes. Other than a number of statistical analysis tools that capture and process packet headers, the only time we have found header captures to be useful is when we were capturing data as or for law enforcement. Header captures are equivalent in many ways to a traditional “trap and trace,” and in some circles, those terms are used interchangeably. In any situation where you find yourself capturing user data, ensure that your legal counsel is aware. Attorneys hate surprises more than anything else.
Statistical Modeling
Statistical monitoring focuses on the high-level view of what connections, or flows, traverse the network. Modeling of traffic flows can be most useful during the stages of the investigation where there may not be complete visibility on the endpoints. This situation presents itself when there is ongoing activity and little explanation for how it occurs. To generate useful data, most software will capture or parse the protocol headers from a source over a period of time and present data based on interpreting the timing and the packet structures.
Most organizations will generate data suitable for analysis from NetFlow probes. NetFlow data can originate from Cisco network devices, or anything else capable of running a capable agent. This type of data stream contains a count of the number of bytes and packets for each “flow,” or session, observed by a device. One could also take PCAP capture files and pass them through a NetFlow probe manually. In either case, several methods are available to analyze and visualize the data. Fluke, HP, Solarwinds, and IBM are the leading companies that offer NetFlow analysis products. In this chapter we focus on software under various open source licensed applications—namely, argus and flow-tools.
GO GET IT ON THE WEB
argus, the network audit record generation and utilization system www.qosient.com/argus/
flow-tools code.google.com/p/flow-tools/
When this information is available, we use flow-tools and argus to look for patterns in the data. Generally, when we turn to NetFlow analysis, we are either answering a very specific question (“During the suspected time frame of the attack, has a significant amount of data left the environment?”) or looking for communications that are characteristic of beaconing or other malicious communications (port scans, suspicious flows going the opposite direction of the expected behavior, and so on).
In the following example, we have a short full-content capture session that is only eight minutes long. This network capture, performed by tcpdump, was monitoring the subnet where several web servers were located. Let’s take this PCAP file and determine whether there is any suspicious activity originating from the web servers. The example is a bit contrived; the simple statistics that we show are easily detected through other means, especially if a network has good egress rules.
To convert the PCAP file to a data file consumable by argus’s data clients, we run the following command:
When processing the data, we try to maintain as many fields as possible to reduce the chance we’ll reprocess the data. This command preserves MAC addresses (m), application byte metrics (A), packet performance data (J), response times (R), and 512 bytes of application data (U). Argus will read (-r) from a standard PCAP-formatted file and output (w) to a format legible to the argus tool suite. The output file is then ready for additional processing.
Let’s take a look at the data for suspicious outbound traffic, particularly over HTTPS since we know that several attacks pull second-stage code from external sites:
This command (using the argus binary “ragraph”) will generate a bar graph of destination bytes by destination port, for all TCP traffic from the host server1, whose destination byte size exceeds 68. The result is shown in Figure 9-1. As you can see, the only traffic captured that had a dst size > 68 was HTTP and HTTPS traffic. At 15:34, there was a huge spike in activity, peaking at 3.8 Mbps. This time frame may be a great place to start from when performing analysis on the server itself.

Does that spike fit into a recurring pattern? Let’s re-run that ragraph command, but we’ll add the -log option to the previous command to examine the data lost in the autoscaling that was performed by ragraph. The version with the y-axis in log scale is shown in Figure 9-2.

It doesn’t appear that the communication was periodic (at least in the very short time captured in this PCAP), but we now see that there was a 75-second transfer that started at approximately 15:29:25. This may also be something worth investigating, if the server in question is not expected to originate HTTPS traffic.
SETTING UP A NETWORK MONITORING SYSTEM
Within a short period of time following our arrival on a site, we try to get eyes on the network egress points. Before we formalized our network monitoring program, we often would deploy laptops or 1U servers alongside hardware-based network taps in offices and data centers. A custom solution consisting of Snort and tcpdump gave us the most flexibility, especially when the folks running the network already had intrusion detection systems in place. Generally, IDS platforms cannot reliably perform both intrusion detection and network surveillance duties simultaneously. It can certainly be done, but keep in mind that once you instruct an IDS sensor to begin full-content capture, its effectiveness as a sensor will diminish.
Setting up a monitor to perform network surveillance requires a bit of planning and preparation. Your ability to deploy a monitor will be affected by your network architecture, the bandwidth and utilization of the segment being monitored, and nontechnical influences such as corporate policies and a limited budget.
• Define your goals for performing the network surveillance.
• Ensure that you have the proper legal standing to perform the monitoring activity.
• Acquire and implement the proper hardware and software.
• Ensure the security of the platform, both electronically and physically.
• Ensure the appropriate placement of the monitor on the network.
• Evaluate the data captured by your network monitor to ensure you meet the goals you defined.
A flaw in any one of these steps could produce unreliable and ineffective surveillance capabilities within your organization. Let’s take a closer look at how to choose monitoring hardware and software as well as how to design and evaluate your monitor.
Choosing Appropriate Hardware
You can buy a commercial system or build your own network monitor. The key issue is to ensure your system has the horsepower required to perform its monitoring function. It can be exceptionally difficult to collect and store every packet traversing high-speed links. Organizations that have high-throughput connections should invest in enterprise-grade equipment for network monitoring.
Many organizations will need to rely on homegrown solutions. In some respects, these solutions are preferable because you can customize them to suit your needs. Choose a stable, robust platform and dedicate it to network surveillance. Our custom network monitoring systems are 1U servers from large manufacturers that we can rely upon in the event a hardware failure occurs. We usually recommend a couple of pre-built distributions, based on a GNU/Linux operating system. It is common knowledge that a stable Unix platform outperforms all other options. Until recently, the FreeBSD operating system has provided the most efficient capturing environment. However, due to the advancements made by the group at NTOP on the PF_RING network socket, the Linux kernel has now displaced FreeBSD’s kernel as the core of our platform. To take advantage of the additional capabilities of their work, one must be comfortable with maintaining kernel modules for the version of Linux used, until the Linux kernel team concedes that NTOP’s PF_RING outperforms their own AF_PACKET interface and it becomes a part of the kernel itself.
What Should I Buy?
Several systems on the market are capable of capturing and retaining data on high-speed networks. With the rate at which the startups that pioneer the field are acquired, if we were to list links, they would be inaccurate within a year. We suggest following the development teams or their principal developers individually. As of the time we wrote this book, the engineering teams behind Solera Networks and NetWitness were designing the most effective and user-friendly commercial network analysis systems.
GO GET IT ON THE WEB
Comparing and Improving Current Packet Capturing Solutions Based on Commodity Hardware (2010) conferences.sigcomm.org/imc/2010/papers/p206.pdf
Packet Capture in 10-Gigabit Ethernet Environments Using Contemporary Commodity Hardware (2007)
When we begin an investigation, we are purely in tactical mode and do not typically have the advantage of access to a long-term monitoring system. Most organizations find themselves in this situation when they are notified of an intrusion. When faced with the need to quickly deploy a monitoring technology, nothing beats a hardware network tap (or a robust SPAN port) coupled with a Snort sensor with tcpdump. On the other hand, if you have the budget to install a monitoring solution before an incident, there are a few commercial solutions that combine Snort-style alerting with storage.
In 2013, two commercial packages exist that we regularly recommend to organizations that would like to set up and run their own monitoring system. The first is Solera Networks’ DeepSea appliance and the second is RSA’s NetWitness platform. If you are used to the simplicity of a Snort installation, both commercial options may be a bit of a shock. In the recommended installation configurations, both work best in a hierarchy; sensors feed into collectors, which are queried by user workstations or management servers.
Because sensor management on the commercial platforms is well documented, we will focus on the use of open source options for the remainder of this section. The steps are similar whether you are installing a platform for long-term monitoring or are in the throes of an investigation.
Installation of a Pre-built Distribution
Unless your group has significant experience in Linux (to include kernel patching) and time to burn, you will want to build your platform on an existing sensor distribution. We suggest starting with the Security Onion distribution. Security Onion (SO) can be installed from the ISO disc image, or you can choose to install it on your favorite Linux distribution. When you install SO, it manages all of the OS and kernel tweaking necessary to get you started with a reliable platform.
GO GET IT ON THE WEB
Security Onion website www.securityonion.net
The Security Onion (SO) team maintains a customized Xubuntu distribution with all of the required SO software and dependencies built in. The distribution is made available as an ISO image that you can use to create a bootable DVD or USB thumb drive. Once you boot to the media, the following steps will get you up and running with a basic installation (additional details and installation help are available on the SO website):
1. At the initial boot menu, select “install - start the installer directly.”
2. Once the system boots, double-click Install Security Onion.
3. Click through the prompts, accepting the defaults and entering information as appropriate.
4. After a few minutes, the install will complete and the system will reboot.
5. Log in and then double-click Setup. Some changes will be made to the system and it will reboot again.
6. Log in and then double-click Setup. Click through the prompts and choose Quick Setup. Then pick the network interface you would like to monitor. When prompted to install ELSA, select YES.
7. The setup will complete after a couple of minutes.
8. Hyperlinks to access SO’s high-level tools are on the desktop. Alternatively, you can browse to the HTTPS port of the IP address assigned to the system, where a web page with useful links is provided for your convenience.
Monitoring begins immediately after the setup completes. Keep in mind that some of SO’s web-based tools, such as Snorby and Squert, do not display events in real time.
GO GET IT ON THE WEB
Introduction to Security Onion code.google.com/p/security-onion/wiki/IntroductionToSecurityOnion
In this chapter we are focusing on the use of SO as a platform for a small subset of the capabilities built into it. The tools we use in this chapter are installed alongside some other quite useful sensor and alert management applications. We highly recommend reading through the Introduction to Security Onion page and experimenting with SO before relying on it in your organization.
The placement of the network sensor (or in some cases, a tap that supports several monitoring devices) is possibly the most important factor in setting up a monitoring system. Understanding the network environment is essential. Before you begin, assemble the right people to answer questions such as the following:
• Where are the network egress points?
• Does the network use specific routes to control internal traffic? External traffic?
• Are “choke points” available at suborganization or administrative boundaries?
• How is endpoint traffic encapsulated when it arrives at firewalls or “choke points”? Is VLAN trunking in use, for example?
• Where are network address translation devices in use? Web proxies?
These factors affect the placement of the network sensors as well as the software you use. For example, if the point you choose to monitor tagged VLAN traffic, you may want to specify a configuration for a specific VLAN tag. Should your monitoring point be a high-bandwidth connection with a high-sustained throughput, you may need to deploy multiple sensors and find a way to partition the sessions.
Don’t be reluctant to suggest major network changes that can help the investigation. In many situations, an incident provides enough justification for changes that many agree will result in a better configuration. At times, an incident is enough to get people to move past temporary inconvenience while changes are made.
In a recent investigation, our client had over 40 branch offices, each with its own Internet connection. Although corporate traffic was sent over IPSec tunnels to a central location, each office was configured to route Internet-directed traffic out of each local gateway. This configuration did not lend itself to comprehensive monitoring. The new IT director jumped at the opportunity to implement MPLS (Multiprotocol Label Switching) across the organization, given the excess network capacity at their headquarters. What was once a sensor management challenge became a much simpler one: two sensors to monitor internal and external traffic.
It is also important to place the sensor in a physically secure location. When you’re deploying a system to perform network su1rveillance, you need to secure the system in a locked room where only a select number of trusted employees can gain access. In the event you will need to capture data that will be used in an administrative or legal action, remember the chain of custody and how it defines control.
In the traditional information security sense, remember to secure the monitor as you would any other Unix system. Protect it from unauthorized access and keep the patches up to date. Finally, document everything. Keep in mind that the configuration and security of the sensor are quite relevant to the potential evidence that it may capture. Review logs and consider the use of tools such as Tripwire to periodically verify that the sensor platform remains a trusted platform for evidence collection.
Once you have a platform in place, you will want to evaluate two primary things. Is the monitor receiving the traffic that you intend to monitor, and is the hardware responsive enough to accomplish the monitoring goals you set? Verifying the operation of the sensor in this manner seems fairly apparent; however, we have had numerous instances where a team who wasn’t aware of how the network routed traffic set up a sensor, and analysts would find out weeks later that the traffic from the network of interest was routed through a different gateway. We won’t go into detail on how to troubleshoot such misconfigurations, but we suggest that you create a couple of signatures that are triggered by specific traffic that anyone can generate. For example, it may be sufficient to have the system alert when a nonexistent web page is requested from your company’s external site. You could ask a random employee whose system is in a particular office to visit the specific URL that triggers your indicator. Although the process doesn’t validate the entire signature set, it helps troubleshoot sensor placement, SPAN or tap issues, and the decoding of transport encapsulation. Closely monitor the statistics that are kept by your software as well. Snort and Suricata will log performance metrics that tell you if your sensor is dropping packets. When this occurs, take a close look at your signatures. Quite often, poorly written signatures cause the software to drop packets simply because the signature engine can’t keep up. In some cases, the drivers or hardware are at fault; the data volume or packet arrival rate can keep the driver from shoveling data fast enough to keep up with the incoming traffic.
NETWORK DATA ANALYSIS
Once you’ve obtained relevant network data, you will need some way to examine it. In this section we present two scenarios and examine the associated network capture data with the popular packet analysis tool Wireshark. There are many other tools that you could use, and most have the same basic features. We chose Wireshark because it is a very popular free, open source, and multiplatform tool. Additionally, you can create your own decoders, either in C or LUA. That ability alone makes it a very valuable tool for incident responders who may deal with network-capable malware. You may choose to use another tool to analyze the data. We always encourage an investigator to be familiar with multiple tools for the same task—if not for flexibility, for process validation. If you are working with data that needs to be decoded or interpreted in a significant way, run the data through a couple of different utilities or processes to ensure that the results are consistent. It is quite common to have a utility that appears to process data with no issues, but omits potentially important information. Process validation is especially important when working with custom tools or filters.
During an investigation, the network data analysis we perform is generally limited in scope—meaning, without good reason, we do not attempt to “find new evil in a network data haystack.” As we’ve mentioned before, whenever we analyze data, we focus on following leads and answering the investigative questions. In most real-world incidents, you won’t find us attempting to analyze five terabytes of unfiltered network capture data from an organization’s main Internet connection or trying to mine the past year of DNS lookups to establish patterns—that’s a challenge typically more suited for IT security or a research setting. During an incident, you’ve got a building on fire with people in it that need help. You must stay focused.
Following that philosophy, we’ve designed two scenarios that will provide you with an opportunity to become familiar with looking at network data. Because we’d like for you to be able to perform the analysis yourself, the packet capture files for these two scenarios are included in the companion website for this book. These scenarios are based on real incidents—they are not thought experiments. If you have been a customer of ours, you may think we’re talking about your organization. However, attackers have used the exact sequence of events in these scenarios at thousands of organizations over the past two decades. In other words, these scenarios are commonplace.
The first scenario is one of simple data theft—an attacker uses RAR to archive and compress data, and then uses FTP to transfer the data to an external server. The second scenario involves a PHP-based webshell that an attacker installs on a web server in your demilitarized zone (DMZ) and uses to perform reconnaissance on your network. For the purposes of making things easier to illustrate, we will assume the victims in these scenarios implemented full content network monitoring and that we have access to the data.
Speaking of data, you may be wondering what form the network capture data will be in. During an incident, we most commonly obtain network capture data in the form of packet capture (or “pcap”) files exported from a dedicated monitoring solution. A packet capture or “pcap” file is the de facto standard file format for network capture data. Nearly all network tools that process network data support the pcap file format. Some tools not only support the pcap format, but can also natively read numerous other formats. However, whether you create the captures yourself or you obtain them from another team, we recommend using the pcap format because it is the most universal.
Now that we’ve provided some background, let’s get into the details of our first scenario: data theft.
Data Theft Scenario
It is a dark and stormy night on December 3, 2013. An investigation you are running finds that two days ago, an attacker accessed a user’s desktop system and executed rar.exe and ftp.exe, a single time each. RAR is a file archiving program that some attackers frequently use to consolidate and compress many files they wish to steal into one single file. This process makes it easier for the attacker to transfer the data out of a victim’s network. The ftp.exe program is an FTP client, used to download or upload files to an FTP server. In this case, the host-based evidence is not detailed enough to answer what RAR or FTP were used for—you’ve only found evidence that those programs were executed. However, through interviews, you do know that this is not part of any normal activity for the user of the system.
Management is very interested in being able to answer what happened, and this limited evidence raises more questions than it answers. Although this scenario fits a common pattern of evidence that indicates data theft, it is important to confirm whether theft actually occurred and determine more about what was stolen and where it was transferred. Luckily, your organization maintains three days of full content network capture data. With the help of the full content network captures, you may be able to provide solid answers about what happened. Even connection information (headers) or NetFlow data would provide some answers, although full content is more likely to provide a complete picture. Let’s look at how that network capture data can help.
The first step is to identify the FTP session in the capture data. In this scenario, we know that ftp.exe was executed, suggesting the attacker may have used the FTP client to transfer data. The evidence of this was a Windows prefetch file, which indicated the program was executed only once, and therefore we also have the exact date and time it was executed—December 1, 2013 at 00:57 UTC. We could also use DHCP server logs to track down the IP address the system was assigned, but that may not be necessary because we have a specific protocol (FTP) and time the event occurred. So we’ll begin by querying the capture system for any FTP sessions on the date in question. The system returns a list of 73 sessions, but only two are near the time ftp.exe was executed. The sessions are to the same external IP address, but from two different internal IP addresses. One session crosses right through the time of the ftp.exe prefetch evidence, but the other is about 15 minutes prior. Because both sessions are to the same external IP address, you decide to extract and analyze them both. You export both sessions to files in pcap format, a format that is well-supported by all major network traffic analysis tools. Next, let’s get our hands dirty in packets.
We’ll use Wireshark, one of the most popular network packet analysis tools, to examine the sessions. Wireshark is GUI based, supports hundreds of network protocols, and runs on all major operating systems, including Linux, Windows, BSD, and OS X. Many of Wireshark’s capabilities also exist in a set of command-line tools that are part of the project.
GO GET IT ON THE WEB
Wireshark website www.wireshark.org
Because the initial lead occurred during the time frame of the second session, we will begin our analysis there. The first session seems like it may be connected, but we should really finish investigating the initial lead before we spend time, and possibly become distracted, with the first session.
A quick method to examine what went on in the first session is to open the pcap file in Wireshark, select Statistics | Conversations, and then click the TCP tab. In Figure 9-3 we see two conversations, both between the same IP addresses.

One conversation connected to a destination port “ftp” and the other “ftp-data.” This is consistent with an ftp session that includes a file transfer, because ftp actually uses two ports—port 21 for ftp commands and port 20 for data transfer. The easiest way to look at the ftp commands that were issued is to click the conversation that connected to the “ftp” port and then click Follow Stream, shown in Figure 9-4. Wireshark will process the packets that are part of that conversation, including reordering and dealing with retransmissions, and display the result of the reassembled payloads in a window. In this case, we see the ftp commands consist of a login using the username “frank” and then a transfer of a 608,414 byte file named edi-source.bin. You can use the Save As button to save the commands into a file.

Continuing to look at the conversations, we see that there is a single “ftp-data” conversation. This is consistent with the ftp commands we saw—one file was transferred. The ftp-data conversations are pure file data streams, meaning if the data payloads for this conversation are reassembled and saved, we’ll have a copy of the file that was transferred. Again, the easiest way in Wireshark to accomplish this is to click the ftp-data conversation in Statistics | Conversations and then click the TCP tab. Next, click Follow Stream, and a window will pop up showing the content of the file transfer. You can then use the Save As button to save the file. The file you save will be an exact copy of the file transferred during the session. If you’re familiar with common file headers, you can probably take a guess at what the file actually is. The “Rar!” header is associated with the RAR file archive and compression tool. This is consistent with what we might expect to see, based on the evidence from the initial lead that rar.exe was executed on the system. Figure 9-5 shows the contents of the recovered RAR file.

The consistencies we’re calling out may seem obvious or unhelpful, but in our experience, any inconsistency or unexpected result usually indicates a gap in knowledge that requires additional investigation. Sometimes there is insufficient evidence to explain an inconsistency, and in those cases it’s important to realize the limitations of your conclusions. As unexplained inconsistencies or unexpected results increase, your confidence in conclusions related to them should decrease. |
At this point, let’s recap what we’ve discovered. You have identified a set of FTP commands that transferred a single file named edi-source.bin, and you have a copy of the file. The external IP address the file was transferred to, 203.0.113.100, is not part of any normal business process. A preliminary review of the file suggests it is a RAR archive. That gives us some solid evidence to perform further analysis on and use as leads to look for other evidence. For example, when you attempt to open the RAR file, you discover it is password protected. The directory is intact, so you can create a list of file names, but you cannot extract the data. The file names suggest the RAR contains source code. To gain access to the data, you could ask the forensic examiner to search for evidence of common RAR command lines on the victim system in an attempt to find the password that was used. You could also request for the password to be cracked, although that may take considerable time. Perhaps the attacker was quite lazy and used “frank” as the password. You can also request to examine any sessions from other days to the external IP address, 203.0.113.100, or sessions that use a similar username. But what about this session? Is there anything else you could glean from it?
Sometimes it’s useful to know if an attacker performed tasks manually or used some automation. In the case of automation, there may be additional evidence on the system, such as scripts or programs that were used to automate the process. If the network session suggests the tasks were automated, it may be prudent to put extra effort into examining the system to find out how the automation was accomplished. That evidence may provide solid leads, such as file naming conventions for both the scripts and the data stolen.
So in this session, how can we tell if the process was automated or manual? In many cases, the most obvious indication that tasks were performed manually is mistakes. For example, typographical errors as well as incorrect command use and then subsequent successful retries are a strong indicator that a human was performing the tasks manually. Timing is another good indicator—automated processes have minimal delay between commands. This is most obvious when the commands are long, but even when they are short, there is usually a clear indication that a human is performing the tasks manually. For example, in this session, there is a “long” delay between the FTP prompts and the response. We can see the timing of these commands by looking at the default display of the session in Wireshark, in Figure 9-6.

The FTP prompt for a username is displayed .003 seconds into the session, but a username is not sent until 2.5 seconds into the session, a delay of more than two seconds. If automation was used, that delay would have been milliseconds. Because automation can be made to look similar to manual interaction, this does not prove that the tasks were performed manually, but it’s a good indicator. At this point we’ve gotten most of what we can out of examining the second session—let’s go back and look into the first one.
The first session to the external IP address 203.0.113.100 was about 15 minutes before the system from the original initial lead. Let’s take a look at this session to see if there appears to be any link to the investigation beyond just the same external IP address. If we open this session in Wireshark, we see that it’s quite similar to the second session. The login credentials were also “frank.” Under Statistics | Conversations, the TCP tab shows two conversations. One is ftp, the other ftp-data. Using the same techniques as with the last session, we look at the FTP commands and see that a single file, named edi-transfer.bin, was transferred to the external IP address. This file name is similar to the one from the second session, which was edi-source.bin. This similarity in file name suggests there might be a connection between the two sessions. The file in this session is much smaller than the last, though—this file is only 2KB (versus 553KB). Using the same method to save the file, you see the “Rar!” header again, suggesting this file is also a RAR file. We extracted the data and opened it in 7-Zip. Figure 9-7 shows the contents of the recovered RAR file.

You may immediately recognize some of these file names, such as 127.0.0.1.cachedump, as part of the “fgdump” password hash dumping tool for Windows. A query with any major search engine would also associate these file names with fgdump. Attackers use fgdump to obtain password hashes from Windows systems and then subsequently crack the hashes to reveal the passwords. If an administrator recently logged on to the Windows system, their password hash may have been compromised. Unfortunately, the RAR file is password protected, and we’re unable to extract the files at this point. If we were able to crack or otherwise obtain the password for the other RAR file, it is highly likely that it would work on this file as well. At a minimum, this evidence strongly suggests that this session is malicious, and may be associated with the previous session we examined. Now let’s step back and look at what examining both of these sessions has revealed and what follow-up steps may be prudent.
We’ve discovered that both sessions transferred RAR files that are password protected. The naming convention was similar and the destination IP address was the same, suggesting they may be related. Based on the names of the files in each RAR, we suspect one contained source code and the other contained password hashes dumped from a Windows computer. To confirm what is in the RAR files, you should request additional analysis to attempt to find the RAR command line, or request password cracking on the RAR file. You should also find out why the first session was not discovered through your host-based inspection tool—we would expect to see evidence of RAR or FTP execution. Those answers may lead to more discoveries about how the attacker is operating and provide better indicators of compromise for your investigation.
At this point, we’ve wrapped up our first scenario. Although some questions remain, such as what the password to the RAR file is, it’s time to move on to our second scenario—webshell reconnaissance.
In this scenario we are switching perspectives. Your intrusion detection system, watching web servers on the DMZ subnet 203.0.113.0/24, alerts you to a port scan that originated from your DMZ. During your investigation you identify that the port scan came from a publicly accessible Apache-based web service on a Microsoft Windows server at 203.0.113.101. This server also runs a MySQL instance that the Apache web server uses. You ask the IT team if anyone was performing port scans, and they indicate that no such activity was recently authorized. You review the login history on the web server, but see that no users were logged in at the time. You decide you need a closer look at the web server.
Because the server is publicly accessible, you feel a likely explanation is that the site was compromised somehow. So, you begin by performing an analysis of the Apache server logs. The logs show an unusually large number of requests around the time frame of the port scan. The requests originate from an external IP address that you do not recognize. The analysis shows many requests to many pages over a short period, and then the requests only go to a single page named/apps/login.php. Those requests were mostly POST requests. Shortly thereafter, GET requests begin to go to/tmpbkxcn. php, and that continues until activity coming from the associated external IP address stops. The GET requests to/tmpbkxcn.php contain strings such as “cmd=netstat” and “cmd=tasklist,” so initially this appears to be malicious SQL injection, although you are unsure if the commands actually worked. You decide that you need to look at network capture data to help you figure out what happened. The network capture team, who wisely implemented a full-content traffic retention system after a previous incident, provides you with a full-content pcap file of all traffic between the DMZ web server and the external IP address you identified for the date of interest.
This example also illustrates the importance of a quick response to alerts. In the scenario we note that the network team had implemented a full-content retention system as a result of lessons learned during a previous incident. Naturally, there is a limit to what can be stored, given the data rate and traffic collected by a sensor. In this example, we were able to identify and preserve the sessions before the collection system purged the data from the buffer. |
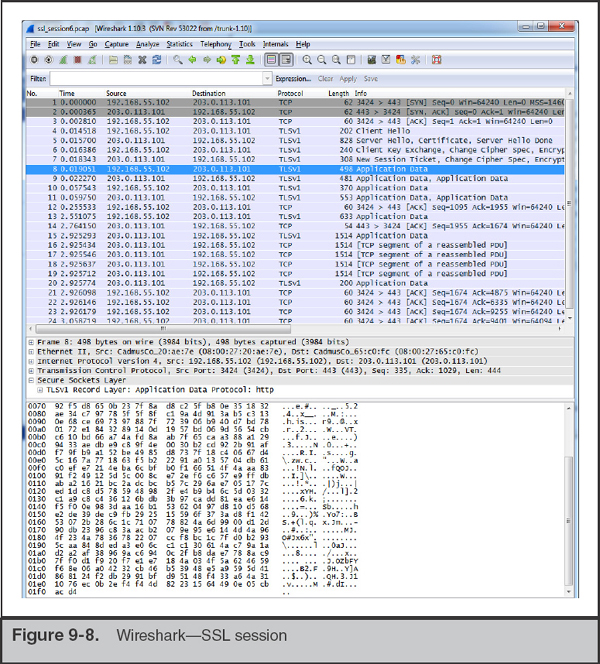
You open the file in Wireshark and immediately notice a problem. The sessions occur over port tcp/443, a port you would expect to see standard Secure Sockets Layer (SSL) traffic. As shown in Figure 9-8, the traffic is indeed encrypted, and at this point you are unable to view any of the content.
You’ve heard that Wireshark has SSL decryption capability and decide to give that a try. After some quick research, you learn that there are important factors in decrypting SSL. Either you must have the session master secret, or the session must not have used forward secrecy and you need the web server’s private SSL RSA key. As a side note, this may be the first time you’ve heard of forward secrecy—it is an encryption scheme where the session master secrets (keys) are uniquely derived for each session, so that even with the server’s private key you cannot decrypt the session. Not all web servers and web browsers support forward secrecy methods, although they are becoming more prevalent. In this case, the DMZ web server was not configured with forward secrecy, so you can obtain the server’s private SSL key and configure Wireshark to decrypt the session.
The location of the SSL key is set in the Apache configuration file. The website’s administrator should be able to locate and provide you with the key or keys. Once you have the key, adding it into Wireshark is easy. Select Edit | Preferences from the menu and then click Protocols and type SSL. This should bring you to the SSL preferences page, shown in Figure 9-9.

What if your investigation was on the other side of this connection? How could we have access to an SSL certificate file from a remote server? This goes back to the human side of investigations. It is quite common that a remote server is not owned by a bad actor. Attackers will take over hosted servers or rent virtual servers using stolen payment cards. Oftentimes, the actual owner or hosting company is willing to help when they are notified that suspicious activity is originating from systems under their control. In these situations, you may be able to contact the documented owner of the subnet, explain the situation, and offer to share any details on the attack to help them better defend their servers. |
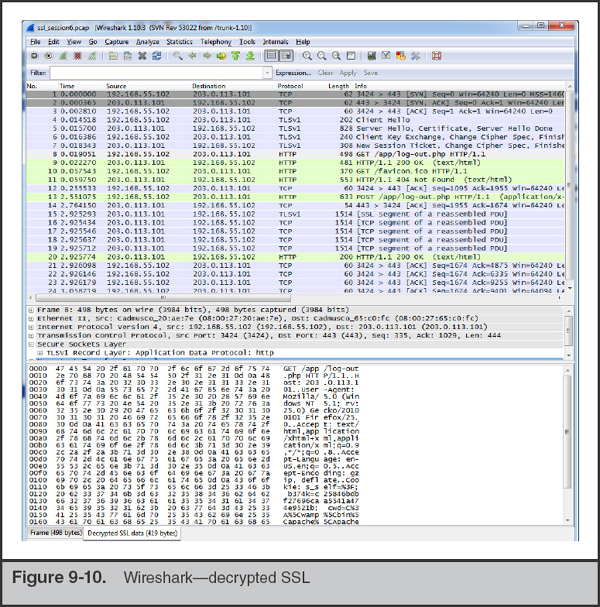
Click the Edit… button next to “RSA keys list:”. Here, you will add a new key. Enter the IP address of the server, the port (443), and the protocol (http) and then browse to the key file and select it. If the key is password protected, be sure to enter the password in the provided text box. Then click OK to close out the configuration windows. Wireshark automatically applies the key, so if the information you entered is correct, you will be able to immediately look at decrypted portions of the session, shown in Figure 9-10. Note that, by default, Wireshark displays the reassembled and decrypted SSL data in an additional tab in the Packet Bytes pane that is labeled “Decrypted SSL data.” This tab is not displayed on every frame because Wireshark reassembles multiple related frames and displays the tab on the last associated frame.
Now that you are able to see plaintext data from the session, you start to examine the data transferred in the POST commands. Figure 9-11 shows the content of the packet, including the encoded URL string. You quickly notice that the bulk of the POST requests to login.php have a user-agent string containing “sqlmap/1.0-dev.” Sqlmap is a SQL injection tool that helps automate finding and exploiting SQL injection vulnerabilities on a web page.

GO GET IT ON THE WEB
Sqlmap website sqlmap.org
Although you can’t be sure that sqlmap was used since user-agent strings are easily spoofed, this finding is consistent with the current clues we have about what happened. You decide to look at the login.php code, and notice that it accepts POST parameters directly into a SQL query—certainly a security issue and possibly what lead to this incident. Following the high volume of repeated accesses to login.php was a number of sporadic requests to tmpbkxcn.php. You suspect this may be a webshell, because you saw Apache log entries with “cmd=” as part of GET requests to this page.
Next, you use Wireshark to perform a packet details search for tmpbkxcn.php. You find that this page was uploaded via a POST request to another page, /tmpuiimz.php. You then search packet details for tmpuiimz.php and find that it was placed on the system using SQL injection on the login.php page. The user-agent string was “sqlmap/1.0-dev (http://sqlmap.org),” so you suspect the attacker used the built-in capabilities of sqlmap to install these files.
The network capture shows that the file tmpuiimz.php was only used to upload tmpbkxcn.php. You use Wireshark’s packet details search to find requests to tmpbkxcn.php, and as you go through each match, you find that the attacker successfully executed a number of commands, including the following:
• net view
• tasklist/v
• netstat -anb
• tree c:
• dir/s c:
• unzip nmap-6.40-win32.zip
• 113.bat
You believe the commands were successful because the pcap data shows the output of each command. Most of the commands appear to be reconnaissance activity; however, two commands modified the user accounts on the web server:
These commands successfully created a new local Windows user account named “backup” and added it to the Administrators group. Perhaps the attacker was hoping to use this account as a fallback method of maintaining access to systems on your network.
Let’s recap what you’ve been able to determine. You found evidence that the attacker used a tool named sqlmap to find and exploit SQL injection vulnerability in the login.php page. The attacker continued to use sqlmap to perform reconnaissance. The reconnaissance consisted of operating system commands such as netstat and taskview, as well as uploading and executing the nmap port-scanning tool. The attacker also created a local Windows user account and added it to the administrative group. Finally, the attacker deleted all of the files they created. At this point, the network capture data has allowed you to gain a solid understanding of how the attacker exploited the system and what they did.
Other Network Analysis Tools
In both of our scenarios, we performed the analysis using Wireshark. But as we mentioned earlier, there are other tools you could use. The Wireshark wiki maintains an extensive list of network analysis tools:
GO GET IT ON THE WEB
We’d like to briefly discuss one that is not on that list, because we find it useful in many scenarios. The tool is named NetWitness Investigator. Although the name is similar to RSA’s enterprise NetWitness platform, Investigator is a stand-alone network traffic analysis tool that can also directly capture network data. NetWitness Investigator is free, although registration is mandatory. The tool comes with a small demo capture session and provides comprehensive documentation accessible in the menu under Help | Help Documentation.
GO GET IT ON THE WEB
NetWitness Investigator automatically identifies sessions and displays them in a high-level category-based presentation. For example, NetWitness places all sessions in a Service Type category, such as HTTP, DNS, and FTP. In addition to standard network protocols, NetWitness also places sessions into application protocol service categories such as MSN IM, IRC, as well as many other common applications. Figure 9-12 shows the processed contents of a demo session included with NetWitness Investigator. Note that the overview shows the contents of the sessions, from addressing to files extracted from IRC and HTTP sessions.

This category type view can help an investigator quickly identify and review types of traffic that they are more interested in. This type of presentation also helps an investigator see relationships between different properties of a session, such as a specific IP address and the service types associated with it. For example, if you select one IP address from the category Source IP Address, the category names and counts are updated to reflect only the sessions that involve that IP address.
Do not overlook all the potential sources of evidence when responding to an incident! Most network traffic leaves an audit trail somewhere along the path it traveled. Here are some examples:
• Routers, firewalls, servers, IDS sensors, and other network devices may maintain logs that record network-based events.
• DHCP servers log network access when a system requests an address.
• Firewalls allow administrators an extensive amount of granularity when creating audit logs.
• IDS sensors may catch a portion of an attack due to a signature recognition or anomaly detection filter.
• Host-based sensors may detect the alteration of a system library or the addition of a file in a sensitive location.
• System log files from the primary domain controller several zones away may show a failed authentication during a logon attempt.
When you combine all the existing pieces of network-based evidence, it may be possible to reconstruct specific network events such as a file transfer, a SQL injection attack, or a compromised account used on your network.
Network-based logging offers some advantages over standard system-based logging. Anyone who has access to a system, whether remotely or locally at the console, may alter any file or a function that the system performs. Therefore, there is a compelling argument that properly handled network-based logs may be more reliable and valid than host-based system logs from a victim machine. This is especially true when physical access and command-level access to the network devices are rigidly controlled. Surveillance logs are specifically generated as network-based evidence that was collected in a controlled manner with an established chain of custody.
We’ve hinted at this at several points in this chapter, but logs that you collect as part of a focused effort should be treated as evidence and documented fully with a chain of custody. If network sensors capture traffic that is relevant, export the pcap data captured during the time of the incident, log it into evidence, and perform analysis on a working copy. |
Although all these sources of network-based information can provide investigative clues, they often present unique challenges to the investigator. Network-based logs are stored in many formats, may originate from several different operating systems, may require special software to access and read, are geographically dispersed, and sometimes use inaccurate time stamps. The challenge for investigators is in locating all these logs and correlating them. It is time consuming and resource intensive to obtain geographically dispersed logs from many different systems, maintain a chain of custody for each of them, and reconstruct a network-based event. Many times, the proper combination of all these logs still paints an ugly, incomplete picture. Therefore, many organizations perform network surveillance, as explained in the previous sections of this chapter, to augment the data they obtain from other relevant logs.
SO WHAT?
Relying solely on host-based methods to obtain and analyze data will often result in incomplete conclusions. Furthermore, if network evidence is available to reinforce host-based findings, the conclusions you reach will carry more weight. Without network sensors and NetFlow probes, it is likely that your remediation will be incomplete as well. They are essential tools to determine whether you were successful in chasing the attackers out of your network. It is essential that your IR team become familiar with the tools and the typical traffic they may observe on your networks so that when the time comes, the identification of suspicious activity is easier. In nearly every investigation where we had sensors on the ground, we have been able to more fully understand the scope of the incident.
QUESTIONS
1. When architecting a new network monitoring system, what types of questions should be asked of the IT or network staff? How can you help ensure complete visibility into traffic egressing your networks?
2. How can your team detect the following suspicious activities through statistical network monitoring?
a. Installation of dropper malware
b. Malware that retrieves commands from a remote site
c. Potential data theft
3. What is perfect forward secrecy and how does it affect your ability to decrypt SSL traffic? How might you decrypt SSL traffic that is encrypted using a forward secrecy algorithm?
4. How would you quickly identify whether a large pcap file with thousands of sessions contained FTP activity? How would you extract the transferred files?
..................Content has been hidden....................
You can't read the all page of ebook, please click here login for view all page.