

Investigating Windows Systems
The objective of this chapter is to help you understand the fundamental sources of evidence on a Windows system, and how you can apply them to solve common questions that typically arise during an incident response investigation. To be blunt, investigating Windows can be an intimidating challenge. The operating system is a complex beast on its own—even more so when it’s part of an Active Directory domain, as is most often the case in corporate environments. The sheer volume of files, registry keys, log entries, and other artifacts generated by a system during normal day-to-day use can be overwhelming for a new analyst.
Fortunately, as the fields of forensics and incident response have matured over the past decade, so too have the tools available to investigate Windows systems. The net result is that it is easier than ever to collect and parse the sources of evidence that we’ll discuss throughout this chapter. However, we’ve often found that less experienced analysts can fall victim to relying upon a tool’s interpretation of evidence without understanding its true origin or behavior. Moreover, tools can have bugs and convey data in a way that is misleading or incomplete. This can significantly limit your ability to draw the correct conclusions about an intruder’s actions on a system—or worse yet, cause you to miss or misrepresent findings outright. No tool can be a complete substitute for a comprehensive understanding of how Windows behaves “under the hood.” We hope that this chapter can serve as a foundation for your analysis, as well as a launching-point for further research on more complex topics beyond our scope.
This chapter is divided into subsections that each focus on a specific source of evidence. Rather than attempting to cover every facet of the operating system, we have prioritized areas that are most beneficial for incident response investigations. These include the following:
• NTFS and file system analysis
• Windows prefetch
• Event logs
• Scheduled tasks
• The registry
• Other artifacts of interactive sessions
• Memory forensics
• Alternative persistence mechanisms
Within each section, we’ll provide information on how the evidence “works” (that is, its role in supporting operating system functionality), what you need to collect as part of your forensic-acquisition process, and how you can analyze or interpret the evidence (including suggested tools). Along the way, we’ll link the various sources of evidence to scenarios that are common to incident response investigations, and highlight how they are impacted by attacker behavior. And at the end of the chapter, we’ll include a review that summarizes all the Windows forensic artifacts you’ve learned about.
As of this writing, Windows 8 has yet to see widespread deployment in the majority of corporate environments. In fact, many organizations with which we have worked only recently upgraded their user endpoints to the latest edition of Windows 7. As a result, this chapter does not include analysis of artifacts or changes specific to Windows 8. Like all significant Windows upgrades, many of the forensic artifacts remain unchanged, some have been removed, and some have been added. Post-publication, we’ll be updating the website accompanying this book with additional information on Windows 8, so stay tuned. |
NTFS AND FILE SYSTEM ANALYSIS
The Windows file system serves as the foundation for many of the sources of evidence we’ll discuss throughout this chapter. Today, the NT File System (NTFS) is the most common file system in use by all recent versions of Windows. NTFS is a proprietary file system developed by Microsoft in the early 1990s—it gained widespread usage during the Windows 2000 and XP era, eventually supplanting the legacy FAT file system that was common with the Microsoft Disk Operating System (MS-DOS). Because NTFS is now the most common file system we expect you will encounter on Windows systems, particularly for the disk volume on which the operating system resides, we will focus exclusively on NTFS in this chapter.
We’ll begin with a crash-course on the most important artifacts of NTFS: the Master File Table and associated metadata, INDX attributes, and change logs. We’ll also discuss several file system topics that are not exclusively related to NTFS, but remain essential knowledge for any investigator, including volume shadow copies and file system redirection.
The Master File Table
As with any file system, NTFS defines how disk space is allocated and utilized, how files are created and deleted, and how the metadata associated with these files is stored and updated. If you have any experience with “dead disk” forensics, you’ve probably performed routine tasks such as reviewing file timestamps and identifying deleted files that can be recovered—these are all possible due to NTFS artifacts that can be acquired and analyzed like any other source of evidence on a Windows system.
The Master File Table (MFT) is the primary source of metadata in NTFS. It contains or indirectly references everything about a file: its timestamps, size in bytes, attributes (such as permissions), parent directory, and contents. In other words, if you have a copy of the MFT from a Windows system, you have the authoritative catalog of all files that exist on that volume—as well as some that may have been recently deleted (more on that in a bit).
Each NTFS volume will contain its own MFT, stored within the volume root as a file named $MFT. If you’re analyzing a system with multiple partitions or drives, ensure you acquire the MFT from each volume—you never know what you might need. NTFS metadata files such as the $MFT are not accessible via Windows Explorer or other standard application programming interface (API) file-access methods. You’ll need raw disk access—such as that provided by any disk forensics software and its drivers—to interact with or acquire the contents of the $MFT file.
On a standard hard drive with 512-byte sectors, the MFT is structured as a series of 1,024-byte records, also known as “entries,” one for each file and directory on a volume. The first 16 MFT entries are reserved for essential NTFS artifacts, including the $MFT itself, $LogFile, and other special files we’ll cover later in this section. Each entry contains metadata and attributes that both describe a file or directory and indicate where its contents reside on the physical disk. The essential elements of an MFT entry include the following:
• Record type Specifies whether a given entry represents a file or directory.
• Record # An integer used to identify a given MFT entry. Record numbers grow sequentially as new entries are added.
• Parent record # The record number of the parent directory. Each MFT entry only tracks the record number of its immediate parent, rather than its full path on disk. You can re-construct a file or directory’s full path by following this sequence of record numbers until you reach the root entry for a volume.
• Active/Inactive flag MFT entries for deleted files or directories are marked “Inactive.” NTFS will automatically reclaim and replace inactive entries with new active entries to keep the MFT from growing indefinitely.
• Attributes Each MFT entry contains a number of “attributes” that contain metadata about a file—everything from timestamps to the physical location of the file’s contents on disk. The three most important attributes we’ll detail in this section are $STANDARD_INFORMATION, $FILENAME, and $DATA.
Note that on advanced format (AF) drives with 4KB sectors, each MFT record will be 4,096 bytes instead. Additional information is available in the following blog articles:
GO GET IT ON THE WEB
Figure 12-1 provides a high-level depiction of an MFT record’s layout and key elements, including the FILE_RECORD_SEGMENT_HEADER (shown as “Record Header”), the $STANDARD_INFORMATION and $FILE_NAME attributes, and the $DATA attribute.

As we mentioned earlier, the MFT is among the most important sources of evidence that we use when conducting file system forensic analysis. In this section, we’ll focus on how to analyze the MFT to recover information about deleted files and directories, and to obtain timestamps—both of which are common tasks you’ll likely perform again and again during an investigation. We’ll also spend some time discussing two topics that can impact your ability to recover “hidden” data related to a file, given an MFT: resident records and alternate data streams.
Identifying Deleted Files Just about any forensics practitioner knows that “deleting” a file or directory doesn’t actually mean it’s erased from disk and unrecoverable. But specific to NTFS (and ignoring factors such as the Recycle Bin), why is that the case? We already mentioned that each MFT entry contains a flag that can indicate whether a given record is “Active” or “Inactive.” When you delete a file or directory, NTFS sets the flag in the corresponding MFT entry to “Inactive”—meaning that the MFT entry is now available for reuse. After all, NTFS wouldn’t be very efficient if MFT entries for deleted files remained forever—the MFT would continuously grow in size. But note that nothing else about the file, or the MFT entry, changes. Its actual contents still remain on disk, and are still “pointed to” by the inactive MFT entry (specifically, the $DATA attribute, which we’ll discuss in more detail shortly). As long as those clusters are not overwritten with other data, they can still be recovered. Similarly, as long as the deleted file’s inactive MFT entry is not reused, its metadata can be recovered.
How long will an inactive MFT entry remain present? It depends. NTFS will always try to replace an existing available entry before extending the size of the MFT. As a result, we often find that inactive entries only last for seconds or minutes on the primary operating system volume. On a secondary drive with less frequent activity, you may find that there is less “churn,” so inactive entries remain present for a longer period of time.
Analyzing Timestamps File timestamps are among the most important metadata stored in the MFT. You’ll often hear forensic analysts refer to a file’s “MACE” times—that’s short for the four types of NTFS timestamps: Modified, Accessed, Created, Entry Modified (MACE). We’ll detail what each of these mean momentarily.
An MFT entry for a given file will have at least two sets of attributes containing MACE timestampattributes. One set is contained within the “Standard Information” attribute (also known as $SIA, STANDARD_INFORMATION, or $SI). This attribute also contains various identifier codes, flags, and sequence numbers used by the operating system. The other set of MACE timestamps is contained within FileName attribute(s) (also known as FNA, FILE_NAME, or $FN). The $FN attribute stores the file name itself, its size, and its parent directory record number.
If you’ve ever looked at a file’s properties in Windows Explorer or in the default user interface for popular forensics tools such as Encase, you’ve seen Standard Information timestamps. They’re accessible via the Windows API and thereby exposed to user-mode applications throughout the operating system. In Figure 12-2, note that the properties for cmd.exe illustrate its $SI Created, Accessed, and Modified times. Windows Explorer does not show the Entry Modified timestamp—but nearly any disk forensics tool, including SleuthKit, EnCase, and FTK, will do so.

The definitions of the Standard Information ($SI) MACE timestamps are fairly intuitive (except perhaps for Entry Modified):
• Modified When the contents of a file were last changed
• Accessed When the contents of a file were last read
• Created When the file was “born”
• Entry Modified When the MFT entry associated with a file, rather than the contents of the file, was changed
In order to improve performance, Windows Vista, 7, Server 2008, and later versions of Windows no longer update the Accessed timestamp by default. This behavior is controlled by the registry key and value HKLMCurrentControlSetControlFileSystemNtfsDisableLastAccessUpdate. Even if this value is not set, NTFS may delay updates to the Accessed timestamp by up to an hour. |
So how do the $FN MACE timestamps differ from $SI? They refer to the MFT entry for the file name itself. For instance, Filename Created refers to the date and time on which the MFT entry for a given file was created. Filename Modified refers to the date and time on which a file name attribute in the MFT last changed, and so on.
If, like this author, you’re old enough to remember using MS-DOS, you might recall that file names were once restricted to being no longer than eight characters long (plus a three-character extension). NTFS actually maintains multiple sets of file name attributes—including both full, case-sensitive long file names and the MS-DOS 8.3 file name. That means you can recover another four MACE timestamps for the MS-DOS file name, although these will typically be identical to the “long” file name timestamp attribute.
Why care about all of these timestamps—isn’t one set of MACE attributes enough? Recall that we mentioned that the $SI timestamps are available to user applications through the Windows API. That means that programs can both read and change any of these timestamps to a value that is intentionally not accurate—a process known as “time-stomping.” Utilities such as setmace can easily change any file’s $SI timestamps to an arbitrary value or to match those of another file. Malware droppers and installers will often automate this process as a counter-forensics technique, frequently cloning timestamps from legitimate system files in %SYSTEMROOT% to blend in and hinder timeline analysis.
GO GET IT ON THE WEB
Fortunately, it is a bit more difficult to manipulate the $FN MACE timestamps. Applications cannot read these values without obtaining access to the MFT itself, which requires raw disk access (typically through a device driver). Similarly, there are no supported methods for directly setting or changing the $FN timestamps—but there is an increasing number of indirect mechanisms to achieve this. For example, you can use setmace and other utilities to set both $SI and $FN to arbitrary values by performing the following steps:
1. Modify the Standard Information timestamps to the desired value.
2. Move the file to a new directory within the same volume.
3. Modify the Standard Information timestamps of the file in its new location.
4. Move the file back to its original path.
5. Modify the Standard Information timestamps once again.
This operation will result in a matching set of modified $SI and $FN attributes. Why does this work? When moving the file to a new destination on the same volume, Windows uses its $SI timestamps to set the $FN timestamps for the new MFT entry. Restoring the file to its original location and remodifying ensures that all eight MACE timestamps match the desired values. This trick is often referred to as “double-time-stomping.”
The setmace utility has yet another mechanism for manipulating the $FN attributes: writing to physical disk. This requires a kernel mode driver in Windows Vista and later versions, and as is the case with anything that directly tampers with NTFS metadata, it runs the risk of corrupting an MFT entry. In practice, most attackers rely on the previously cited double-stomping trick because it is simple, reliable, and does not require raw disk access.
Although it may be discouraging to learn about all the ways an attacker can tamper with NTFS metadata—fear not! There are several ways to defeat the most common counter-forensic techniques. We recommend incorporating $FN timestamps whenever conducting timeline analysis of NTFS metadata. If an attacker has simply tampered with a file’s $SI timestamps, its $FN attributes may reflect its true MACE times and thereby “fit” within a time frame of interest. Of course, reviewing eight timestamps per file ($SI and $FN) can make for a very cluttered timeline—so you may find it advantageous to just begin with Filename Created and Standard Information Created. As needed, you can then expand your “window” of analysis to include the remaining MACE timestamps. You can also rely on the other sources of time evidence we’ll discuss in this chapter, such as the registry, prefetch files, and event log entries, to help you determine time frames of interest that can help focus your analysis efforts.
Figure 12-3 depicts an example of time-stomping from a real-world case we investigated. An attacker’s backdoor installer modified the $SI timestamps of a malicious DLL (rasmon.dll) to match those of legitimate system files included with a standard installation of Windows. However, the $FN timestamps remained accurate (as confirmed through analysis of other corroborating sources of time evidence on the system).

Is a file intrinsically suspicious if its $FN timestamps don’t match its $SI timestamps? Unfortunately not—there are a number of cases where this can legitimately occur. For example, files installed from physical media (such as a CD), extracted from archives, or copied over network shares may retain some or all of their $SI timestamps from their source. In such cases, the $FN-created timestamps usually represent their true creation date and time on a given system.
It definitely can be challenging to keep track of the “rules” that Windows follows when updating these attributes during various operations. SANS maintains a useful Digital Forensics cheat sheet that summarizes how common file system tasks affect each of the $SI and $FN timestamps. This cheat sheet can be found at blogs.sans.org/computer-forensics/files/2012/06/SANS-Digital-Forensics-and-Incident-Response-Poster-2012.pdf. |
Resident Data We’ve spent a lot of time talking about the $SI and $FN attributes within a file’s MFT entry—but one of the most important attributes is named $DATA. This attribute typically provides a listing of the clusters on disk wherein a file’s contents reside. The clusters that contain all the data for a given file may not all be sequential, or more commonly called “contiguous.” When all the clusters for a given file are not contiguous, the file is said to be “fragmented.” When a file is fragmented, the $DATA attribute will list the “data runs” that, assembled together, contain the data for the file. You may wonder why NTFS would use this method for very small files since it would be inefficient. In fact, NTFS stores very small files in a different way, which is referred to as “Resident Data.”
Recall that a typical MFT entry has a fixed length of 1,024 bytes. That’s a decent amount of headroom for most files—even given the plethora of attributes it tracks. So for efficiency’s sake, NTFS will actually store the complete contents of files under approximately 700–800 bytes within the $DATA attribute itself. If this happens, a special flag named the Resident flag is set in the MFT entry to indicate this condition. In other words, by acquiring the $MFT and locating the entry for a given file that falls under this size constraint, you can recover its contents directly from the MFT file itself. This will remain true for files that have been deleted but still retain an inactive MFT entry.
If a file is too large, the $DATA attribute will only contain its cluster runs—there’s no such thing as a “partially” resident file. However, an MFT entry may contain slack space that includes previously resident data. If a file is initially small enough to be resident, and subsequently grows to exceed the available space, the MFT entry will be flagged non-resident and the $DATA attribute will update to point to the file’s clusters on disk. However, leftover space in the attribute may still contain the previously resident data from older versions of the file. Analysts often encounter artifacts of resident data during string searches across a forensic disk image. Therefore, if you ever get a search hit for file contents within the $MFT, now you know how that might have occurred.
Alternate Data Streams Earlier in this section, we explained that each MFT entry contains a $DATA attribute that either contains the contents of a resident file or the cluster runs of a resident file. NTFS also allows you to add additional named $DATA attributes, also known as alternate data streams (ADS), to a file’s MFT entry. Each of these attributes can point to a unique set of cluster runs, and thereby behave as files that are “attached” to a given primary file. The MFT entry will not contain separate sets of Standard Information or Filename attributes for an ADS, which means the ADS will not have its own distinct set of MACE timestamps.
The standard naming convention for referencing an ADS is filename:streamname—most forensic utilities will follow this convention when displaying alternate data streams in a file listing. To better understand how such streams can be created, refer to the command-line sequence shown in Figure 12-4. In this example, we created a file named out.txt, containing the string “Hello World”, and then created an alternate data stream named out.txt:secret.txt, containing the string “I’m an ADS”. We used the dir command to list the file—both with and without the /r switch. Finally, we used the “more” command to display the contents of both out.txt and its alternate data stream.
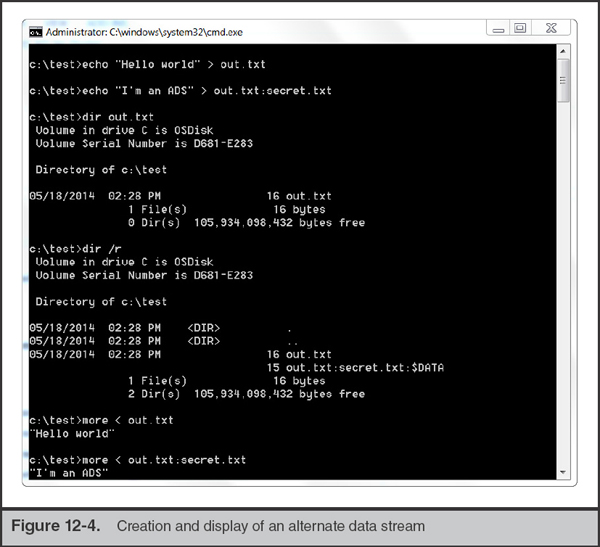
Note that the contents of the “out.txt” file were unaffected by the addition of the alternate data stream. The size remained the same, and if we calculated an MD5 checksum, it too would have remained identical before and after the ADS was created. Streams effectively behave as separate files distinct from their “host” file. Also note that the standard dir command did not list out.txt:secret.txt:$DATA—we had to use the switch “dir /r” to display the stream. We also used the “more” command (rather than “type”) to display the contents of the ADS (the “type” command does not have the ability to read from an ADS).
Hopefully you’re already thinking of ways that bad guys might abuse alternate data streams. In older versions of Windows, attackers would often hide malicious executable files in streams of legitimate files or folders (this is actually one of the default options available when building an instance of the Poison Ivy backdoor, for example). To make matters worse, initially there were no built-in mechanisms for listing alternate data streams via the command line or Explorer. The SysInternals “streams” and Frank Heyne’s LADS utilities are two free tools that provided the ability to list alternate data streams, until this functionality was included in later versions of Windows.
Beginning with Windows Vista, Microsoft implemented features and controls to limit malicious usage of alternate data streams. It’s no longer possible to directly run executable files out of an ADS, and the /r switch to the native dir command can list all available alternate data streams. However, be aware that it is still possible to store data in an ADS: this could include anything from RAR files to batch scripts or other interpreted code that’s loaded by a separate executable file.
If you’re using one of the popular commercial drive forensics tools, such as Guidance Encase, X-Ways Forensic, or AccessData FTK, alternate data streams will be listed in their own rows as if they were separate files. Encase 6 and 7, for example, use the display convention hostfile.ext·ADS rather than hostfile.ext:ADS. However, many free tools (such as FTK Imager) do not display ADS at all. Be sure to determine whether your toolkit of choice has this capability before examining a disk.
Windows continues to use alternate data streams for several legitimate purposes. For example, Internet Explorer and other web browsers append a stream named Zone. Identifier to downloaded files. Explorer refers to this stream to determine the origin of a file and enforce configured security controls if a user attempts to execute it. MSDN article “Known Alternate Stream Names” provides information on other valid ADS: msdn.microsoft.com/en-us/library/dn365326.aspx. |
MFT Analysis Tools Most, if not all, commercial forensic toolkits, including EnCase and FTK, are capable of extracting and parsing the contents of the $MFT and other NTFS structures. Fortunately, plenty of free and open source software is available to help you analyze such evidence—and we’ve provided a few of our favorites:
• The Sleuth Kit www.sleuthkit.org/sleuthkit Comprehensive open source toolkit for analyzing disk images and file system metadata.
• mft2csv code.google.com/p/mft2csv Suite of tools for converting the MFT to a CSV file and dumping single MFT entries to console for a specified file/path.
• analyzeMFT github.com/dkovar/analyzeMFT Another MFT parsing utility, capable of converting entries to CSV and Sleuthkit body file formats. If mft2csv fails to convert a given MFT successfully, try using this tool (and vice versa).
• plaso plaso.kiddaland.net A powerful timeline analysis engine that can incorporate evidence from Sleuth Kit and numerous other sources of metadata. This tool was designed to supersede the popular log2timeline utility.
INDX Attributes
An efficient file system should be able to quickly look up the contents of a directory to determine whether a file is present. However, recall that MFT entries only record the record number of their immediate parent directory. This makes enumerating the contents of a given directory inefficient—at minimum, you’d need to identify the directory’s record number, and then review each MFT entry to identify anything with a matching parent record number.
In order to optimize this process, NTFS provides a special attribute, $INDX (aka $I30), that is only present for directories. The INDX attribute maintains a B+ tree whose nodes track the contents of a given directory; by walking this tree, one can quickly enumerate the contents of a directory or find a file of interest. An INDX record may be resident within the MFT entry for a directory—this is referred to as the INDEX_ROOT attribute and represents the root node of the B-tree. Non-resident INDX records are referred to as INDEX_ALLOCATION and contain the subnodes that effectively describe the contents of a directory.
If you’ve ever done a string search for a file name across a forensic image, and ended up with ”hits” within a directory, an $I30 file, or data in disk slack prefaced with the heading “INDX,” you’ve encountered INDX attributes at work. |
So what’s the point of analyzing these obscure INDX attributes? Can’t we just identify the contents of any given directory by examining the MFT? Sure, but slack space within an INDX attribute may yield evidence of deleted files that are no longer tracked in the MFT. Specifically, the file system allocates INDX allocation attributes in fixed 4,096-byte chunks. As files are added to a directory, the allocation attribute must track more items and may grow to 8,192 bytes, and then 12,288 bytes, and so on. What happens when files are removed? The B+ tree subnodes are rebalanced, but remnants of the old files may remain in the resulting slack space—the allocation attribute does not dynamically shrink.
What’s particularly nice about INDX attribute entries (including those in slack) is that they contain the same metadata as a file name attribute in the MFT, including:
• File name
• Parent directory MFT record number
• All four MACE timestamps
• Physical and logical file size
The longevity of recoverable entries from INDX slack space will depend on the volume and frequency of file “churn” within a given directory. We’ve had tremendous success identifying remnants of everything from RAR archives staged for data theft to malware installers and other temporary files by parsing INDX records—but that’s typically true when the attacker’s working directory isn’t frequently used. If an attacker stages files within a user’s %TEMP% directory or paths such as %SYSTEMROOT%, you shouldn’t expect to recover nearly as much data from INDX slack.
For further reading on this admittedly complex topic, Mandiant’s Willi Ballenthin and Jeff Hamm have an excellent four-part blog post on acquiring and analyzing INDX records:
GO GET IT ON THE WEB
Willi also wrote a useful Python script, called INDXParse, that can parse NTFS INDX records and output CSV or bodyfile formats.
GO GET IT ON THE WEB
Figure 12-5 displays an example of the output generated by INDXParse.

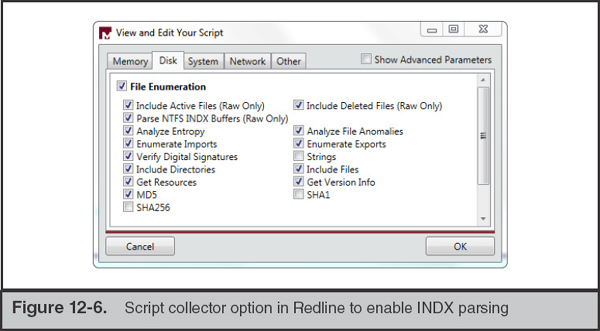
Redline, Mandiant’s free live-response analysis tool, can also be configured to collect and parse INDX records as part of its File Enumeration collector options (see Figure 12-6).
NTFS is a recoverable and journaled file system, so it maintains several logs designed to track changes to directories and files. The data within these logs can be used to reverse file system operations in the event of a failure. For a forensic investigator, they can also serve as a useful source of evidence for file system activity—particularly in cases where an attacker has attempted to delete files and disguise their activity. In this section, we provide a brief overview of the most important journaling logs: $Logfile and $UsnJrnl.
The NTFS log file, named $LogFile, tracks all transactions that change the structure of a volume. That includes file or directory creation/copy/deletes, changes to file metadata, and changes to INDX records. In fact, transaction entries within the $LogFile contain the same attributes that are present in the MFT. The $LogFile is located within the root of each NTFS volume and is typically 64MB by default. The log is circular and can roll over on a frequent basis, especially on system volumes. Like the MFT and other NTFS artifacts, you’ll need to use a forensic utility that provides raw disk access to copy the $LogFile from a running system.
The Update Sequence Number (USN) journal, named $UsnJrnl, provides a higher-level summary of changes to a volume. A given entry includes the type of change event that occurred, its corresponding timestamp, the file name, its attributes, and the MFT entry identifiers for the file and its parent directory. The journal is located in path $Extend$UsnJrnl. You may not find the USN journal on every volume because it’s not strictly required by NTFS. However, a number of common Windows services, such as the Indexing/Search Service and File Replication Service, require and enable it. Like the $LogFile, $UsnJrnl is a circular log and may roll over frequently on a system volume. In practice, $UsnJrnl often holds a longer history of changes to the file system than $LogFile because its entries track much less data. Additional details on the USN journal and Microsoft’s fsutil utility can be found at the following links:
GO GET IT ON THE WEB
The following free tools can help you parse and decode the $LogFile and $UsnJrnl artifacts:
GO GET IT ON THE WEB
LogFileParser code.google.com/p/mft2csv/wiki/LogFileParser
TZWorks Journal Parser tzworks.net/prototype_page.php?proto_id=5
parser-usnjrnl code.google.com/p/parser-usnjrnl
Volume Shadow Copies
The Volume Shadow Copy (VSC) service provides a mechanism for maintaining point-in-time copies, also known as “snapshots” or “restore points,” of files on an entire volume. Windows Server 2003 and Windows XP introduced VSCs in a limited capacity to support the NT Backup Service. Windows Vista, Windows 7, and Server 2008 provide a more comprehensive VSC implementation in place of Windows XP’s legacy System Restore Point feature. Among many improvements, it supports the useful “Restore previous versions” feature in Explorer, which allows users to roll back a file or directory to its state from a previous snapshot.
Some of the terminology can get confusing here. A “restore point” in the context of a VSC is a snapshot of a point-in-time state of a system. This is not the same as the legacy “System Restore Point” solution available in Windows XP. The XP implementation did not rely upon VSC, but instead used a process by which certain registry keys, and files with certain extensions, would automatically be copied to a protected path on disk. Due to the rapidly diminishing number of XP systems “in the wild,” this chapter will solely focus on the VSC implementation in Windows Vista, 7, and Server 2008. |
Examining shadow copies can be a useful way to recover files, registry keys, and other data that an attacker may have deleted or tampered with on a compromised system. Rather than get into the details of how shadow copies work, we’ll focus on a few basic characteristics that you should know before analyzing this evidence. It’s important to understand that VSC tracks changes to blocks of data on disk rather than logical files in their entirety. A mounted shadow copy will appear to be a mirror of the complete contents of a monitored volume, but the service only stores blocks that have changed between snapshot intervals. By default, Windows limits the maximum disk space consumed by VSC snapshots to 5 percent of the volume size on Windows 7 and 15 percent on Windows Vista.
Aside from this space limitation, the availability of data in shadow copies is also limited by the frequency of snapshots. Service pack installation, Windows updates, and driver installation can automatically trigger the creation of a snapshot, and users/applications can also manually request a snapshot. Finally, the system restore service can automatically create snapshots on a daily basis via scheduled tasks.
As you might realize, VSCs could help you recover data that might otherwise be deleted or is no longer present on a system’s current “live” file system. For example, given a known date and time of attacker activity, you might want to check the contents of the VSC taken in closest proximity to this period. This might yield files, data in registry hives, and even event log entries that would otherwise no longer be available.
How do you recover data from a shadow copy? You’ll first need to mount your evidence—be it a disk image or a drive—on a Windows Vista or 7 system. This will allow you to use the Volume Shadow Service and related tools to interact with the shadow copy “mirrors” of the target file system. Then, from an Administrator command prompt, type the command
This will list each shadow copy on the volume and provide a shadow copy ID, originating volume ID, shadow copy volume name, originating host name, and other attributes. You can then create a symbolic link via mklink to mount the shadow copy to a directory of your choice:
Note that the target directory for your link cannot previously exist on disk. You also must ensure that you include a trailing slash at the end of the Shadow Copy Volume path. Figure 12-7 shows the output of these commands.
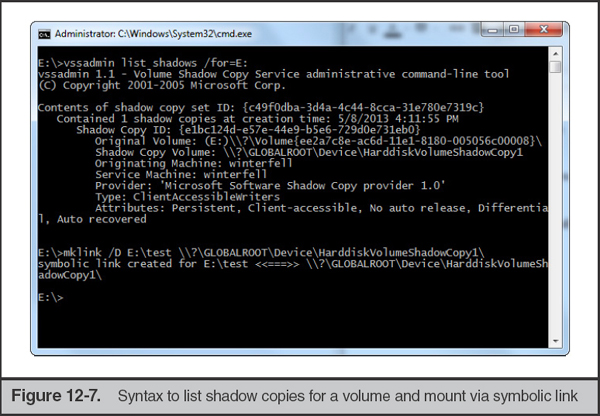
The shadow copy—a mirror of the volume’s entire file system at the time of the snapshot—will now be available within the linked directory.
Although vssadmin and mklink are all that’s needed to explore the contents of VSCs on a Windows system, several free tools are available that provide additional analysis capabilities or facilitate review on other operating systems. We recommend the following:
GO GET IT ON THE WEB
libvshadow code.google.com/p/libvshadow
Multiplatform library and tools for interacting with volume shadow snapshot data.
Shadow Explorer www.shadowexplorer.com
An easy-to-use user interface for exploring the contents of shadow copy snapshots.
VSC Toolset dfstream.blogspot.com/p/vsc-toolset.html
A user interface through which you can mount shadow copies, browse their contents, and execute batch scripts against them.
Windows provides a compatibility subsystem, Windows 32-bit on Windows 64-bit (WoW64), that helps ensure 32-bit applications run properly on 64-bit operating systems. Not only must WoW64 ensure that 32-bit applications are able to access the right versions of DLLs and other dependencies, it also must prevent them from overwriting or modifying system resources designed for other 64-bit applications. One such mechanism to do so is “file system redirector”—and it can have a significant impact on your investigative process.
The 64-bit versions of Windows maintain separate directories for files and dependencies used by 32-bit applications. If a 32-bit application attempts to load a file from %SYSTEMROOT%system32, then WoW64 will transparently redirect it to the directory %SYSTEMROOT%SysWOW64, which contains the proper 32-bit DLLs. The application remains unaware of this redirection and cannot “see” the actual %SYSTEMROOT%system32directory, which is reserved for 64-bit applications. Further detail is available on the Microsoft Developer Network at the following link:
GO GET IT ON THE WEB
Similarly, Windows maintains a separate Program Files directory, called Program Files (x86), for 32-bit applications, whereas 64-bit typically use the normal Program Filespath.
We’ll occasionally see attackers inadvertently use 32-bit malware droppers/installers on 64-bit systems and subsequently “lose” files that were subsequently dropped into paths such as C:WindowsSysWOW64, rather than the expected C:Windowssystem32. |
Hopefully you’re already realizing how this might impact your investigative process and tools on a 64-bit Windows system. If you use a 32-bit tool that relies on the Windows API to enumerate files and directories, they will effectively be “blind” to paths such as C:Windowssystem32 that are only accessible to 64-bit applications. Of course, if you acquire the Master File Table to reconstruct the file system, you wouldn’t be impacted by redirection—but still should ensure your scope of analysis includes all sets of redirected paths. WoW64 also redirects access to several widely used paths in the Windows registry, but we’ll provide further detail on that topic in “The Windows Registry” section of this chapter.
PREFETCH
Prefetch is a performance optimization mechanism that Microsoft introduced in Windows XP to reduce boot and application loading times. To provide some context on why prefetch exists and its value as a source of evidence, we’ll need to briefly delve into the details of Windows memory management.
The Windows Cache Manager is a component of the memory management system that monitors the data and code that running processes load from files on disk. Specifically, it tracks the first two minutes of boot processes and the first 10 seconds of all other applications’ startup. The Cache Manager then works with the Task Scheduler to write the results of these traces to prefetch files. The next time the system boots or a “prefetched” application executes, the Cache Manager can use these prefetch files like a “cheat sheet” to speed up the loading process.
The Evidence
Prefetch files are stored in %SYSTEMROOT%Prefetch. In this directory, you will find the following files:
• NTOSBOOT-B00DFAAD.pf The system boot prefetch. This always has the same name. On Windows Servers, this is the only prefetch file that will exist by default.
• Layout.ini Contains data used by the disk defragmenter.
• AppName-########.pf Up to 128 application-specific prefetch files, each with the extension .pf, and each representing an executable file that ran at least once. These files are named by concatenating the executable name, a dash, and a 32-bit hexadecimal hash derived from the file’s path. That means that the same executable, if ran from two different paths, will have two different prefetch files.
Figure 12-8 displays the partial contents of the C:WindowsPrefetch directory on a drive image loaded in FTK imager.

If you are analyzing a Windows Vista or Windows 7 system, you may see some additional files following the naming convention Ag*.db, such as AgAppLaunch.db. These files are generated by Superfetch—another performance optimization mechanism that can run concurrently with Prefetch. The format of these files is undocumented, but researchers have begun to analyze their structure and contents (reference: blog.rewolf.pl/blog/?p=214). |
Sometimes we come across systems that have no prefetch files in the Prefetch directory. In those cases, it may be helpful to check the registry key containing most of the prefetch settings: HKEY_LOCAL_MACHINESYSTEMCurrentControlSetControlSession ManagerMemory ManagementPrefetchParameters. Two of the values within this key are particularly important:
• EnablePrefetcher Controls the Prefetcher operation. Settings are as follows: 1 – Disable Prefetch; 2 – Prefetch Boot Files; 3 – Prefetch All Applications. Prefetch is often disabled on servers and systems with solid state drives.
• HostingAppList Specifies special Windows applications that load other executable modules, such as DLLHOST.EXE, MMC.EXE, and RUNDLL32.EXE. The Prefetcher incorporates the loaded module into the Prefetch hash value for these applications.
Note that even when EnablePrefetcher is set to 3, Windows will not create an infinite number of prefetch files—the maximum number is 128.
Analysis
Now that we’ve discussed how Windows creates and uses prefetch files, you’ve hopefully come to realize how they can be a valuable source of forensic evidence. Prefetch files serve as a record of programs that have executed on a system, regardless of whether the original executable files are still on disk. As we’ll discuss in this section, not only does the existence of a prefetch file prove that an application ran—but you can also determine when it ran, how many times, and from which path.
The simplest way to analyze prefetch files is to look at their Standard Information timestamps. The File Created date indicates when the corresponding application first ran. The Last Modified date indicates when it most recently executed. Of course, we’re limited by the fact that the prefetch file name does not provide us with path information. A prefetch file named EXPLORER.EXE-A840CB32.pf could have been created for the legitimate %SYSTEMROOT%Explorer.exe or for C:path oevilExplorer.exe. You can obtain this important evidence, along with other useful data, by analyzing the contents of the prefetch files themselves.
The excellent Hexacorn forensics blog published a useful article on how prefetch path calculation works, a Perl script that can generate the hashes within prefetch file names, and a list of precomputed hashes for Windows native executables in their default paths: www.hexacorn.com/blog/2012/06/13/prefetch-hash-calculator-a-hash-lookup-table-xpvistaw7w2k3w2k8/. |
So what additional evidence is available within prefetch files? The most useful is the list of full paths, including volume, to files loaded by the application within the first 10 seconds after it executed. This includes the executable itself, thus allowing you to determine exactly where it resided on disk. This can be important—C:UsersJohnDoesvchost.exe in prefetch is much more suspicious than C:WINDOWSsystem32svchost.exe. The list of accessed files will also include application dependencies (such as loaded DLLs) and files that may have been used for input or output.
The NTOSBOOT prefetch file is the only exception to this 10-second “rule.” It monitors accessed files through the first two minutes of the boot process. |
Figure 12-9 shows a prefetch file for the pwdump2x.exe password dumping utility displayed in NirSoft’s WinPrefetchView utility. Note that its parsed contents include references to the file to which the utility’s output was redirected, pwdump_out.txt.

Another scenario where this data could be useful is when analyzing the prefetch files for a “hosting” application. For example, an attacker might use rundll.exe to install or launch code in a malicious DLL. Because rundll.exe is one of the executables listed in the HostingAppList registry value, you’ll likely find multiple prefetch files for it—parsing the accessed file list in each prefetch file could help segregate legitimate usage from malicious.
We’ll often bulk-acquire and parse prefetch files across multiple systems in an investigation, and subsequently sort and filter on the path. This can be a great way to find evidence of previously unknown binaries executing within paths never used by legitimate programs (such as System Volume Information and Recycler). |
Each prefetch file also contains a counter that is incremented whenever its corresponding application has executed. This can also come in handy—in one recent investigation, we observed that a prefetch file for the attacker’s copy of Rar.exe indicated that it had been launched several dozen times within a two-month timespan. When combined with other sources of evidence, this helped support our findings that the intruder conducted a significant amount of data staging and theft on the system.
What happens if you run an executable file out of an alternate data stream (only supported in Windows XP and prior)? A file named identically to the primary file stream is created in the Prefetch directory. It will contain an ADS that is the actual prefetch data and follows the normal naming convention. For instance, running C:Windows:evil.exe (an ADS to the “windows” directory) could result in the creation of Prefetch file C:PrefetchWindows:evil.exe-A02B49FF. |
Finally, prefetch files contain a Last Run Time date and time. Why might this differ from the Last Modified time for the prefetch file itself? You may often find that the Last Run Time is approximately 10 seconds “earlier” than the Last Modified Time. This is likely caused by the delay between a program executing, the cache manager monitoring its first seconds of loading activity, and the prefetch file finally being written/updated to disk.
Prefetch Analysis Tools
Prefetch files contain binary data in a proprietary format. Known details are documented on the Forensics Wiki at the following link:
GO GET IT ON THE WEB
Although you can use file metadata such as the Created and Last Modified times to determine basic information such as the first and most-recent run times of the corresponding executable, you’ll need to parse the .pf files with a special-purpose tool in order to obtain encoded data such as the run counter, executable path, and accessed file listing. We’ve found the following three tools useful in performing prefetch analysis:
GO GET IT ON THE WEB
WinPrefetchView www.nirsoft.net/utils/win_prefetch_view.html
TZWorks Prefetch Parser www.tzworks.net/prototype_page.php?proto_id=1
RedWolf Forensics Prefetch-Parser redwolfcomputerforensics.com/index.php?option=com_content&task=view&id=42&Itemid=55
EVENT LOGS
Event logs are generated by the system-wide auditing and monitoring mechanisms that are built in to the Windows operating system. By reviewing these logs, you may be able to perform the following tasks:
• Identify successful and failed logon attempts and determine their origin
• Track the creation, start, and stop of system services
• Track usage of specific applications
• Track alterations to the audit policy
• Track changes to user permissions
• Monitor events generated by installed applications (such as antivirus, database, and web server services)
This section provides you with the information needed to locate and acquire the event logs on a Windows system. We’ll then spend the remainder of the section focused on analysis, prioritizing the types of log entries that we typically find to be most useful in an incident response investigation. Along the way, we’ll demonstrate how event logs can help you investigate common patterns of lateral movement, malware execution, and other patterns of activity common in compromised Windows environments.
The Evidence
All versions of Windows maintain three “core” event logs: Application, System, and Security. Activities related to user programs and commercial off-the-shelf applications populate the Application log. Application events that are audited by Windows include any errors or information that an application wants to report. Host-based security tools such as antivirus and intrusion prevention systems often record events to this log.
Windows authentication and security processes record events in the Security log. This log can include user logon and logoff attempts, account creation, changes to user privileges or credentials, changes to the audit policy, process execution, and file and directory access. Local or Group Policy settings can configure exactly which security events are captured and logged.
The System event logs events reported by a variety of core operating system components. Its contents can include Windows service events, changes to the system time, driver loads and unloads, and network configuration issues.
Acquiring the Windows event logs is a straightforward file acquisition task. Each log is stored in a separate file in paths specified within registry key HKEY_LOCAL_MACHINESYSTEMCurrentControlSetServicesEventlog. On Windows XP, Windows Server 2003, and prior operating systems, the default event log paths are
• Application %SYSTEMROOT%System32ConfigAppEvent.Evt
• System %SYSTEMROOT%System32ConfigSysEvent.Evt
• Security %SYSTEMROOT%System32ConfigSecEvent.Evt
Microsoft made significant changes to the event logging system in modern versions of Windows, beginning with Vista and Server 2008. EVT files were scrapped for a new XML-based format using the extension .evtx. The default paths were also slightly changed to the following:
• Application %SYSTEMROOT%System32WinevtLogsApplication.evtx
• System %SYSTEMROOT%System32WinevtLogsSystem.evtx
• Security %SYSTEMROOT%System32WinevtLogsSecurity.evtx
Microsoft also added a second category of logs, Applications and Services, that are used by individual installed applications or system components. These logs are also stored in EVTX files located within the directory %SYSTEMROOT%System32WinevtLogs. The Task Scheduler, Windows Firewall, AppLocker, Terminal Services, and User Access Control are a few examples of Windows features that can maintain their own logs (if enabled) under this category. Although we focus on the main Windows logs, we’ll mention how some of these other logs can be useful later in this chapter.
Analysis
Much like the registry, an entire book could be written on the myriad types of events generated by each version of Windows and their meaning. For the scope of this chapter, we focus on some of the events that are the most useful when investigating an incident.
Know Your Event IDs (EIDs)
Every type of event tracked in Windows event logs has an associated ID value. These IDs are often more useful than the event message itself when you are trying to research, filter, or cross-reference log entries. Covering the hundreds of EIDs that may hold forensic relevance is beyond the scope of this chapter. Fortunately, Microsoft provides a useful search engine, called Events and Errors Message Center, that you can query.
GO GET IT ON THE WEB
Several third-party websites maintain databases of Windows event IDs, including www.myeventlog.com and www.eventid.net. Although these sites often lack coverage of event IDs from the Applications and Services logs and are not officially supported by Microsoft, they can be a useful starting point.
The search engine will not only let you look up information about EIDs you are unfamiliar with, but it will also allow you to search for events that contain certain text or are generated by certain sources.
Be aware that Microsoft changed the EIDs for some (but not all) types of events between NT Kernel 5 (2000, XP, 2003) and 6 (Vista, 7, 2008). The newer EIDs often (but not always) equal the old value plus 4096 (for example, Successful Network Logon changed from 540 to 4624, whereas service start/stop events remained as EID 7036). Hooray for inconsistency! |
Understanding Logon Events
Nearly any Windows investigation you perform will include tracking and analyzing logon events. You may need to prove how a legitimate user accessed their own system, or how a malicious attacker gained remote access to it. You may need to track failed logon attempts indicative of password brute forcing, or you may need to determine how a compromised account was reused throughout an environment. Fortunately, the Security event log can cover all of these needs.
Let’s look at an example of a logon event and discuss what each of the key fields means. This particular example is taken from a Windows XP workstation, but you’d find the same information in later versions of Windows as well:
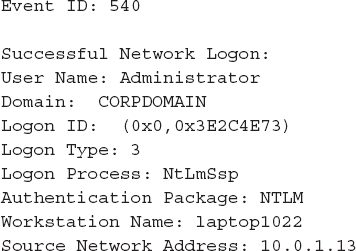
That’s plenty of cryptic terminology for just a simple logon event. Here’s a definition for each of these fields:
• User Name The account used to log on.
• Domain The domain associated with the user name. If the user name is a local account, this field will contain the system’s host name.
• Logon ID A unique session identifier. You can use this value as a search term or filter to find all event log entries associated with this specific logon session.
• Logon Type A code referencing the type of logon initiated by the user. The following table provides further detail on the Logon Type field and its possible values:
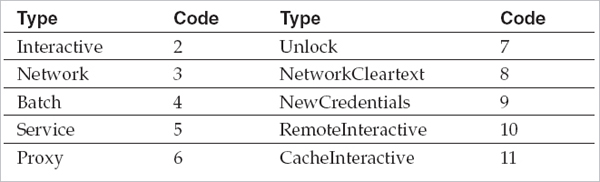
• Interactive The user logged on from the console (for example, from the host machine’s keyboard), via the RunAS command, or from a hardware-based remote access solution (such as KVM).
• Network The user logged on over the network. Mounting a share through the “net use” command or logging on to a web server via IIS integrated authentication are both examples of activity that would generate a Network logon.
• Batch The logon session generated by a scheduled task.
• Service The Windows service logged on using its configured credentials.
• Proxy Microsoft defines this as “a proxy-type logon.” We have yet to see this type of event in the wild, or any documentation explaining how it may be generated.
• Unlock The user unlocked the system (for example, after resuming from the screensaver).
• NetworkCleartext Typically generated by basic authentication logins on web servers.
• NewCredentials The user assumed a different set of credentials for a remote connection (such as through the use of the RunAs command).
• RemoteInteractive The user logged on via Terminal Services, Remote Assistance, or Remote Desktop.
• CacheInteractive The user logged on with domain credentials that were validated using locally cached data rather than contacting the domain controller.
Further details are available at the following link:
GO GET IT ON THE WEB
• Logon Process The process that initiated the logon event. Common options include NtLmSsp, Kerberos, User32, and Advapi.
• Authentication Package The security and authentication protocol used to process the logon event. Common options include NTLM, Kerberos, and Negotiate.
• Workstation Name The source system from which the logon originated. This is not always captured in the event log entry.
• Source Network Address The source IP address from which the logon originated. This is not always captured in the event log entry.
The Logon Type field can be a useful data point when searching or filtering the security event log. If you know an attacker accesses the system using stolen credentials via the “net use” command, you may be able to disregard Unlock and Console logons as noise from legitimate system usage. If an application service account is never supposed to log on interactively, you may want to focus on RemoteInteractive logon events with its credentials.
Does your environment use VNC or other screen-sharing remote access programs? If so, be aware that these utilities effectively emulate local access to a system. Logon events during their usage are typically of type Interactive or Unlock, not RemoteInteractive. |
Investigating Lateral Movement
In a compromised Windows environment, attackers typically leverage stolen, valid credentials (either local or domain) to move from system to system—a process called “lateral movement.” Many environments use common local administrator passwords for all systems, or subsets (for example, all workstations within a region), of their environment. If an attacker compromises a single system and obtains such a credential, they can move freely from host to host. Worse yet, if an attacker gains access to a domain administrator or equivalent account, they may be able to access any system within the domain (absent any network-layer restrictions) at will.
One of the challenges with investigating such lateral movement is that it can blend in with normal Windows activity. This is particularly the case for environments where application service accounts or privileged domain accounts are permitted to establish network and interactive logons, as typically used by “humans.” You may find yourself attempting to tease out evidence of attacker logins via such credentials amid a pile of legitimate “noise” from day-to-day operations.
Let’s use what you’ve learned about logon types to illustrate common methods of lateral movement and the evidence resulting from each approach:
• Our attacker, Bob, has interactive access to a Windows 7 workstation, alpha, through a persistent backdoor.
• Alpha is joined to a corporate domain, ACME.
• The backdoor runs under the context of the domain user who owns alpha, ACMEEve.
• Through password dumping and other intrusion activities, the attacker has obtained credentials for two accounts:
• A local administrator, localAdmin, that is configured with an identical password on each workstation in the ACME domain
• A domain administrator, ACMEdomainAdmin, who has full access to all workstations and servers in the environment
Bob uses the backdoor to invoke a command shell under the context of ACMEEve. He then uses various commands, in combination with the credentials for accounts localAdmin and ACMEdomainAdmin, to access four systems, each in a different manner:
1. He mounts the C$ share for workstation beta, from source system alpha, to transfer malware and tools, using the following command:
2. He uses the SysInternals PSExec utility to remotely execute a command on workstation gamma, once again from source system alpha, using the following command:
3. He establishes a remote desktop connection to server zeta, once again from source system alpha, using the Windows built-in RDP client (username ACMEdomainAdmin, password worsePassword).
4. He browses to an IIS intranet web server, delta, that requires NTLM authentication. Bob uses ACMEdomainAdmin credentials.
Each of these actions will result in a login event—but what types, and where would they be logged?
• Action 1 will generate a logon type 3 (network) recorded on beta because a local account was used.
• Action 2 will generate a logon type 3 recorded on beta, as well as on the ACME domain controller, because a domain account was used. In addition, a “Logon attempt using explicit credentials” event (EID 4648) will be recorded on alpha and reference both the attacker’s use of the credentials ACMEdomainAdmin and the target system beta. This event is generated due to the use of PsExec under a different set of domain credentials than the attacker’s current session (ACMEEve).
• Action 3 will generate a logon type 10 (RemoteInteractive) recorded on zeta as well as on the ACME domain controller.
• Action 4 will generate a logon type 3 (due to using IIS authentication) recorded on delta as well as on the ACME domain controller.
These examples illustrate the impact of different login mechanisms and the usage of local versus domain accounts on both the types of events generated, as well as the systems on which you can find this evidence. This can have significant ramifications when you are conducting investigations in large environments—particularly if the attacker has heavily leveraged local accounts—because tracking lateral movement may entail examining logs on every system.
Kerberos authentication events for lateral movement typically will not include the source system or IP address. However, network logons using Kerberos are often immediately preceded by a login from the source system’s machine account. Keep an eye out for these events to help identify the origin of a Kerberos authentication attempt. |
It can be difficult to ascertain legitimate versus suspect activity in an event log, especially at the early stages of an investigation when you may have minimal leads. When examining logs over a specific period of time and identifying events of interest, be sure to check against the entire log history to determine just how common or uncommon they are. For example, a service event that conveniently falls within the time frame of attacker activity may happen to occur on a frequent basis—context that is often missed when focusing too exclusively on a single window of time. It is also often helpful to aggregate and search logon events to determine the source systems and accounts most frequently used during normal activity. This can help make anomalous logons using valid credentials more obvious amid all the noise on a busy system.
Auditing Changes to Accounts and Security Settings
Several types of events within the Security log record changes to user accounts and security policies. Reviewing these events can help you determine whether an attacker has tampered with a system’s security settings:
• Account management events indicate whether a user account has been created, deleted, enabled, or disabled, as well as similar changes to account groups.
• Policy change events capture changes to system security settings, including the audit policies that specify what is recorded in event logs.
• An event noting “The audit log was cleared” is recorded whenever a user clears the event logs, irrespective of audit settings. This message includes the username responsible for the change.
Process tracking, also known as detailed tracking or process auditing, generates an event in the Security event log every time a process is executed or terminated. These events include the full path to the executable on disk, the process ID, the parent process ID, and the associated logon ID under which it executed. This evidence can provide a detailed account of everything that a user executed within a specified period of time. By default, this audit setting is not enabled—you’ll have to turn it on in either local audit policy or through Group Policy Objects.
Sometimes we wish process tracking logged a few more details. Notably, the process arguments and the parent process name are not included as part of the process tracking event. There are many cases where those two pieces of information would be invaluable, especially when attackers use command-line tools. For example, if an attacker used a command-line tool to compress data prior to theft, you would see the source and destination directories and perhaps even a password, if one was used.
Figure 12-10 displays an example of a Process Created event in which account winterfell
yankaz executed C:Windowssystem32mmc.exe.

Note that audit process tracking will result in a significantly higher volume of logged events. If you are enabling this feature, make sure you increase the Maximum Security Event Log setting to ensure that the log does not reach capacity and roll over too frequently. In some cases, process tracking may have a severe performance impact, so be sure to test this setting prior to enabling it on any critical systems. |
Analyzing Service Events
Windows services are frequently utilized as persistence mechanisms for both commodity and targeted malware. In addition, nonpersistent malware will often install itself as a “temporary” service to run under a privileged context. Fortunately, every time a service is started or stopped, the Service Control Manager (SCM) creates an entry in the System event log.
When a service is explicitly started (such as upon its initial installation), SCM logs an event indicating “The [servicename] service was successfully sent a start control.” This event usually includes the user account responsible for initiating the service. Once the service begins running, SCM logs “The [servicename] service entered the running state.” The log entries for service stoppages follow a similar pattern. As an example, the SysInternals PsExec utility installs itself as a Windows service on the remote system receiving a connection. When the PsExec session ends, the service is terminated and subsequently uninstalled. The following table illustrates how the System event log would capture this sequence of events.

When conducting investigations, we’ll often use the username recorded along with EID 7035 events as an important data point or indicator of compromise. For example, in one case we were able to distinguish between legitimate and unauthorized usage of the PsExec utility based on the user account that started the service, as recorded in these System event log entries. |
There are hundreds of Windows services on an average system, and many change, start, and stop frequently during normal system operations. In our experience, it’s fairly difficult to find a “suspicious” service by simply reviewing every event in an entire log. However, if you have a known period of attacker activity, perhaps near a series of logon events, you may find that there are far fewer events to parse and review. It is definitely worthwhile to follow up on any new services that start for the first time during such periods of activity.
If Process Tracking is enabled, the Security event log will record whenever a new service is created through the SCM (EID 601 or 4697). |
You also may be able to search or filter the System event log for “known-bad” service names previously identified during analysis of other systems. Finally, you may find that an attacker, or sometimes antivirus, deleted a malicious service binary at some point after it was installed—but did not remove the corresponding service configuration keys in the registry. This will result in the SCM logging failure events each time it unsuccessfully attempts to load the service.
From our earlier example, if PsExec was not legitimately used in our sample environment, this service event could be a useful indicator of compromise when analyzing other systems or searching aggregated log data. The same principle goes for any service name used for malware persistence by an attacker—if it’s unique, use it as an indicator when reviewing event logs. For example, some versions of the popular password dumping and hash-replay toolkit Windows Credential Editor create a service named WCE Service upon run time, which can serve as a simple and effective IOC.
Other Log Analysis Tips
Here are some additional tips concerning log analysis:
• If you’re tracking down suspicious but yet-to-be-categorized activity on a system, be sure to check the Application event log to see if any antivirus alerts were generated during your period of interest. This may help point you in the direction of suspicious files, and even help you determine whether your investigative leads were due to a common, nontargeted malware infection or something warranting further review.
• This section has highlighted some of the forensic value of evidence in the event logs. However, if the maximum log sizes are so small that they roll frequently, you may find that you have insufficient information available for analysis. Disk space is inexpensive—most users won’t notice a missing 500MB or 1GB of data—so consider reviewing and increasing your log size limits to improve retention on all Windows endpoints.
• If you acquire event logs from a Windows XP or Server 2003 system, you may find that Event Viewer or other analysis tools report that the EVT files are corrupted. This is a widely known issue that can easily be repaired by the free FixEVT utility available at the following website:
GO GET IT ON THE WEB
Event Log Analysis Tools
Event log analysis tools provide the ability to acquire, view, search, sort, and filter EVT and EVTX files since they are not intrinsically “human readable.” We’ve summarized some of our favorite tools in the following table.
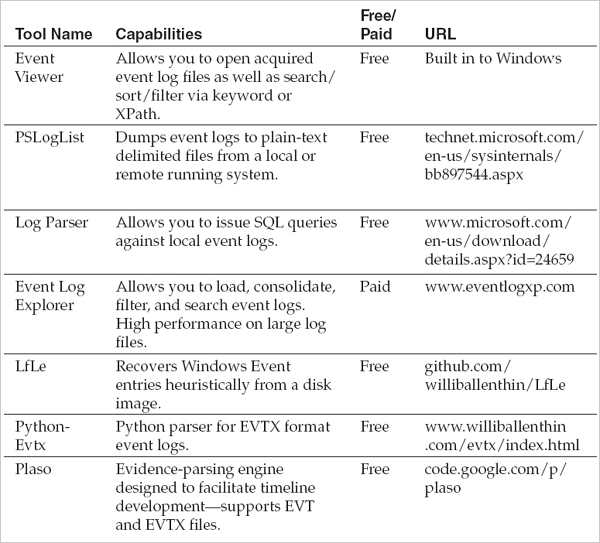
Note that some of these tools, such as PSLogList, only can acquire and parse event logs from a running system. Others, such as Event Viewer, can load raw log files that were copied from a forensic acquisition.
It’s worthwhile to note that Microsoft’s own built-in Event Viewer was significantly enhanced in Windows Vista and later versions of the operating system. Although it still struggles to display and search large log files, it has excellent search and filtering capabilities—especially compared to the old version—and does a fine job in a pinch.
Time to get confused! Event log entries are stored in UTC time. However, different event log analysis tools convert these timestamps in different ways—which can lead to trouble if you’re trying to line up various sources of evidence. For example, the Windows Event Viewer displays events in your local system time, regardless of the log’s original source. To avoid headaches and errors, always double-check how your tools deal with timestamps—and set the time zone of your forensic analysis system to UTC time to make things easier. |
SCHEDULED TASKS
The Windows Task Scheduler provides the ability to automatically execute programs at a specific date and time or on a recurring basis. It is functionally similar to the cron utility built in to most Unix-based operating systems. Applications can programmatically create scheduled tasks through the Windows API; in fact, many do so to enable features such as periodic checks for software updates. Users can create scheduled tasks through the console via the “at” command or the “schtasks” command. Windows Vista and later versions also provide an updated implementation of the Task Scheduler that includes a Management Console snap-in for creating, editing, and deleting tasks.
Attackers often use scheduled tasks to execute malware on a remote compromised system without the need for “helper” utilities such as PsExec, which may increase the likelihood of detection. This technique is especially common when the attacker’s access is limited to a command shell.
Creating Tasks with the “at” Command
Using the “at” command is the simplest way to create a scheduled task. Let’s look at a few simple examples to illustrate its usage. Note that use of the “at” command requires a minimum of local administrator privileges on the local host (for locally created tasks) or the target host (for remotely created tasks):
• 
Run “evil.exe” once at the next time the clock is 16:25.
• 
Run “beacon.exe” at 10:25 on Monday, Tuesday, and Wednesday on a recurring basis.
• 
Run “C:RECYCLERpassdump.bat” on “alpha” the next time its local system time is 08:00.
Notice anything interesting about the third example? It creates a task on a remote system (alpha) rather than running it locally—yes, you can do that. Note that C:RECYCLERpassdump.bat must be present on alpha, not the source system, for this to work. Also be aware that creating a remote scheduled task requires Administrator privileges on the remote system; if you haven’t already authenticated with the appropriate credentials, the “at” command will return a Permission Denied error.
In the preceding examples, you may have wondered what time zone the “at” command uses. The times specified are the local time on the system the “at” job is scheduled on. In some cases, you may not even know what the time zone of the system is—especially for remote systems that are part of a global infrastructure. Attackers often run the command net time \targetHost prior to scheduling a remote task, to check the system’s local time. That’s an effective way to go about scheduling tasks—there is no need to determine or know what the time zone is on any system.
After you’ve created some scheduled tasks, you can list existing tasks on a local or remote system by running the “at” command without any additional parameters (for example, “at” or “at \targetSystem”).
Scheduled tasks created via the “at” command—either local or remote—run under the context of the SYSTEM built-in account. Attackers often exploit this to execute malware, such as certain password dumpers, that may require greater privileges than a normal Administrator user would have on Vista and later versions of Windows. |
Finally, you’ll notice that scheduled tasks created by “at” are each assigned an ID—starting with “1” for the first active scheduled task, and subsequently incrementing for subsequent created tasks. You can list the details of an existing job by running
where # is the ID of interest. You can also delete a job by running
What’s in a name? Scheduled tasks created using the “at” utility are always unnamed. Such jobs are instead referenced based on their ID (At1, At2, and so on). In contrast, tasks created through the Windows API or “schtasks” can have descriptive names. It goes without saying that unnamed tasks are not always malicious—system administrators often use the “at” command for a variety of maintenance and automation purposes. |
For further reference on the syntax for the “at” command, refer to Microsoft’s TechNet page:
GO GET IT ON THE WEB
Creating Tasks with the schtasks Command
The “schtasks” command is a more robust command-line utility for managing scheduled tasks that Microsoft added to Windows XP Professional, Windows Server 2003, and all subsequent versions of the operating system. It supports the ability to create tasks with descriptive names, configure the account context under which they execute, enable complex schedules, and many more features.
Attackers use “schtasks” less frequently than “at”—it’s a more complicated command, and most of its advantages only apply to legitimate usage. Refer to Microsoft’s TechNet page on “schtasks” for further details on its usage:
GO GET IT ON THE WEB
Be aware of an important distinction between the “schtasks” command and the “at” command. Running “schtasks” without any parameters lists all scheduled tasks created by both “schtasks” and “at”. However, running “at” without any parameters only lists scheduled tasks created by “at”. |
The Evidence
Evidence of currently scheduled tasks, as well as records of those that previously executed, is readily available from a running Windows system or a “dead” drive image. The files and logs you’ll need are detailed in this section.
.job Files
Configuration data for scheduled tasks is stored in .job files—one per task—within the %SYSTEMROOT%Tasks directory. These files are encoded in a proprietary file format documented in the following TechNet article:
GO GET IT ON THE WEB
In older versions of Windows (prior to Vista), the Task Scheduler service deleted .job files after a task successfully completed, thus significantly reducing the likelihood of recovering these artifacts from previously executed tasks. On Vista and later versions, .job files can remain until the Task Scheduler service stops or restarts, typically upon shutdown or reboot.
Task Scheduler Logs
The Windows Task Scheduler service logs the start time and completion of previously executed tasks to a plain-text file named SchedLgU.txt. This file grows to a maximum of 32KB before rolling.
• %SYSTEMROOT%SchedLgU.txt Windows 2000, Server 2003, and XP
• %SYSTEMROOT%TasksSchedLgU.txt Windows Vista, 2008, and later
Windows Vista, 7, and Server 2008 added a number of specialized event logs—including one that is responsible for tracking the Task Scheduler service activity: Microsoft-Windows-TaskScheduler%4Operational.evtx. As we’ll discuss in the next section, this log contains far more evidence than SchedLgU.txt, including the full path to processes executed by a scheduled task as well as the user account that registered or created the task.
You can easily enable the Task Scheduler log via the wevtutil utility: wevtutil sl Microsoft-Windows-TaskScheduler/Operational /e:True. |
Finally, be sure to acquire the system security event log (Security.evt or Security.evtx). It can be another useful source of evidence for scheduled tasks if Process Tracking has been enabled.
Analysis
Now that you know how to acquire all the scheduled task-related artifacts from a system, we can focus on how to parse and interpret their contents. In this section, we discuss analysis of .job files and entries within both kinds of scheduled task logs.
Analyzing .job Files
As mentioned earlier, you’re most likely to recover .job files from scheduled tasks that are set to run in the future or on a recurring basis. So given a task of interest, how do you analyze its corresponding .job file?
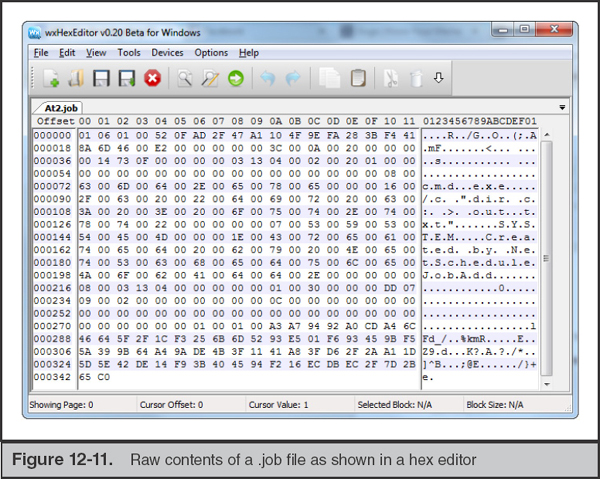
In a pinch, you can always use a hex editor or the “strings” command to view the contents of a .job file (see Figure 12-11). Key items such as user information and the full path to whatever is being launched by the task are normally “human readable” and will stand out.
However, we recommend that you use a tool that properly parses the .job file format and reconstructs the configuration data therein. Jamie Levy’s jobparser.py, recently released as of this writing, does an excellent job of analyzing .job files across all major versions of Windows (see Figure 12-12).

GO GET IT ON THE WEB
Looking for other evidence that a scheduled task executed on a system of interest? The Last Modified time for the %SYSTEMROOT%Tasks directory often corresponds to the most recent creation or completion of a task (resulting from the addition or deletion of the .job file). You may also find that registry keys for the Task Scheduler service are last modified during the most recent task execution. |
Analyzing SchedLgU.txt
The SchedLgU.txt log can be a useful source of evidence for previously executed tasks, and is in fact the only such resource at your disposal when analyzing Windows 2000, Windows XP, and Server 2003 systems. Fortunately, analyzing this log is straightforward and requires no special tools (although you should be aware that its contents are encoded in Unicode). Figure 12-13 is an excerpt of SchedLgU.txt taken from a Windows XP system.
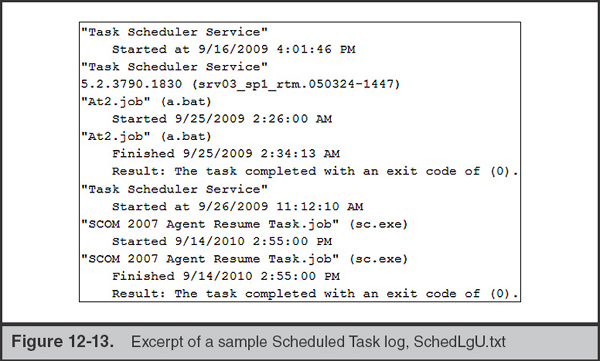
• An unnamed scheduled task, At2.job, executed a.bat on September 25, 2009 at 2:26:00 A.M. and ran until completing at 2:34:13 A.M.
• Based on our understanding of task-naming conventions, we can further infer that an additional job, At1.job, must have existed at the time At2.job was created.
• A named scheduled task, SCOM 2007 Agent Resume Task.job, executed sc.exe on September 14, 2010 at 2:55:00 P.M. and completed on the same second.
• Both jobs ran without returning errors, indicated by the exit code 0 referenced in the log.
So what’s missing? Many important details, unfortunately. SchedLgU.txt does not record the user account that created a scheduled task. The log only captures the file name of whatever the task executed (for example, a.bat)—there is no path information or arguments. Similarly, we have no way of knowing whether the other task executed the legitimate sc.exe in %SYSTEMROOT%system32 or a different program in a different path.
Be aware that scheduled tasks can also indirectly execute other programs through the use of the command interpreter. For example, the following task would launch cScript.Exe Through Cmd.Exe, Which in turn would interpret the VBS script: at 12:34 \beta “cmd.exe /c cscript.exe c: empfoo.vbs”. In this case, SchedLgU.txt would only record that a task executed cmd.exe. |
One more quirk of SchedLgU.txt to keep in mind: it does not log events in UTC, but rather the local system time. In the interest of keeping your evidence consistent, you may have to do some time-zone conversions (and account for daylight savings). Also, you may observe that although the log is generally in chronological order, from earliest task to most recent, occasionally it “rolls” at a midpoint in the file. Given that the log is small, be sure to briefly scan over it from beginning to end so that you can correctly ascertain the date range covered by its events.
Despite its limitations, SchedLgU.txt is a useful source of evidence well suited for large-scale analysis due to its small size and simple format. We often acquire this file from every system within an enterprise under investigation in order to proactively look for indicators of compromise. Unnamed scheduled tasks, tasks to run oddly named batch scripts, and tasks that run the cmd.exe interpreter are often atypical in managed corporate networks. Identifying such tasks can produce useful leads for further analysis.
The Windows Task Scheduler Operational log Microsoft-Windows-TaskScheduler/Operational.evtx provides more detailed evidence than SchedLgU.txt and nicely covers its shortcomings as a source of evidence. Let’s look at how this log captures the creation and execution of a simple task on a Windows 2008 Server named DCSERVER2008, as summarized in the following table:

Rows 1 and 2 occurred when user CORPDOMAINsuperuser created a new unnamed scheduled task (At1) on March 1, 2012 at 10:03:40 UTC. Rows 3 through 9 provide granular detail on the task executing and completing at 10:05:00. Notice that the event ID 200 in row 6 provides a full path to what At1 actually launched, c: empa.bat, and row 7 provides the corresponding process ID for what executed, the command interpreter cmd.exe. These key pieces of information can help you determine whether a suspicious task warrants further investigation, as well as serve as indicators of compromise should they be confirmed as malicious.
The Security event log will also log the creation of scheduled tasks if Process Auditing is enabled. (Yet another reason to enable this extremely useful audit setting.) Process Auditing logs the creation of scheduled tasks under event ID 602 in Windows XP and Server 2003, and event ID 4698 in Vista, Server 2008, and Windows 7. An example of an EID 602 event from a Windows Server 2003 system is shown here:
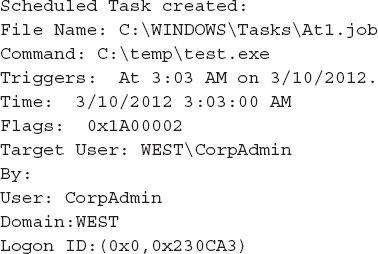
This single entry covers all the key details about a scheduled task: the full path to the command, the time it launches, and the user who created it.
THE WINDOWS REGISTRY
The registry serves as the primary database of configuration data for the Windows operating system and the applications that run on it. It was initially designed to do away with the multitude of .ini and other text-based configuration files that programs would maintain (often in inconsistent formats and locations) and scatter throughout a system. As the operating system and applications have grown in complexity, so too has the scope of information tracked in the registry—as well as the forensic evidence that can be gleaned from it.
Entire books can and have been dedicated to exploring all the forensic artifacts within the registry. For the purposes of this chapter, we’ll quickly get you up to speed on how the registry is structured and some “key” terminology (pun intended). We’ll then highlight some of the most useful sources of registry-based evidence we’ve utilized when investigating Windows systems.
We begin this section by introducing the sources of evidence that make up the registry—namely, what files and data you need to acquire for subsequent analysis. After providing an overview of the registry’s structure, we explore the differences between how it is stored on disk versus how it is accessed on a live running system. Next, we discuss the time metadata that is available in the registry and how you can incorporate it into your analysis. We conclude with some important caveats regarding how 32-bit applications access the registry on 64-bit systems. Once all that’s out of the way, you’ll be set to proceed into the fun stuff—analysis.
Introduction to the Registry
The registry is organized into a number of system and user-specific “hives.” A hive is typically stored in a single file on disk. These hive files are not human readable, but can be parsed using a variety of tools that we’ll cover in this section. As you’ll come to see, both system and user hives can contain a wealth of forensic evidence, so it’s important to acquire all of them. This is especially true when a user account of interest logged on to the system interactively, because the registry hive within their user profile can provide significant insight into their activity.
Windows maintains five main registry hives in the path %SYSTEMROOT%system32config: SYSTEM, SECURITY, SOFTWARE, SAM, and DEFAULT. Note that these are the actual hive file names—they do not have an extension. We’ll provide more detail on these hives and their contents later in this section.
As you might expect, user-specific registry hives are stored within each user’s respective profile directory. Two user hives, NTUSER.DAT and USRCLASS.DAT, are stored in different locations, depending on the version of Windows, as listed next.
Windows XP and Server 2003
• Documents and Settings<user>NTUSER.DAT
• Documents and Settings<user>Local SettingsApplication DataMicrosoftWindowsUSRCLASS.DAT
Windows Vista, 7, and Server 2008
• Users<user>NTUSER.DAT
• Users<user>AppDataLocalMicrosoftWindowsUSRCLASS.DAT
Note that you’ll need to use a forensic imaging or acquisition tool with raw disk access to copy registry hive files while a system is booted. You cannot simply copy them with Windows Explorer.
Remember that Windows only maintains profile data for users who have interactively logged on to a system. If a user has only established a network logon (such as when mounting a share), the system will not contain a profile directory or registry hive for that specific account. As a side note, that means the absence of a user profile directory does not indicate that user has never authenticated to the system. |
Information within the registry is stored in a tree structure that can be broken down into three components: keys, values, and data. If compared to a file system, consider a key analogous to a directory path, a value to a file name, and data to the contents of a file.
Figure 12-14 displays an example of a registry’s key, value, and data in the Windows native registry editor (regedit.exe). As shown, HKEY_LOCAL_MACHINESOFTWARECygwinsetup is the key, rootdir is the selected value, and C:cygwin64 is the data.

Registry data can be stored in a variety of encodings—in fact, the registry stores a “value type” field along with each value that specifies the structure of its accompanying data. These types include everything from simple numbers and strings, to lists and even binary-encoded data. As a result, whereas some registry values and data are human readable, others require the use of specialized decoding tools. We’ll discuss such tools throughout this section and provide a summary of recommended registry analysis tools at the end. You can learn more information about registry value types at the following website:
GO GET IT ON THE WEB
We previously noted that the registry is maintained across multiple “hive files,” including both user-specific hives and system-wide hives. A running instance of Windows, however, maps the contents of these hives into a tree structure that begins with a set of “root keys.” If you obtain the contents of the registry from a running system, such as via a live response toolkit, you’ll likely spend most of your time reviewing evidence within this hierarchy of keys. The root registry keys are as follows:
• HKEY_LOCAL_MACHINE (aka HKLM)
• HKEY_USERS (aka HKU)
• HKEY_CURRENT_USER (aka HKCU)
• HKEY_CURRENT_CONFIG (aka HKCC)
• HKEY_CLASSES_ROOT
So where do the various hive files get represented within these root keys? We’ll start with HKLM because it’s pretty straightforward: the HKLMSoftware, HKLMSecurity, HKLMSystem, and HKLMSAM subkeys contain the contents of the SOFTWARE, SECURITY, SYSTEM, and SAM hives, respectively.
HKEY_USERS contains the following subkeys:
• HKU.DEFAULT maps to the DEFAULT hive.
• HKU{SID} exists for each user security identifier (SID) on the system. The subkey for each SID maps to the corresponding user’s NTUSER.DAT hive file.
• HKU{SID}_Classes exists for each user SID on the system. The subkey for each SID maps to the corresponding user’s USRCLASS.DAT hive file.
HKEY_CURRENT_USER is simply a symbolic link to HKEY_USERS{SID} for the user currently logged in to the console.
HKEY_CURRENT_CONFIG maps to HKEY_LOCAL_MACHINESYSTEMCurrentControlSetHardware ProfilesXXXX, where XXXX is a four-digit number representing the active profile. CurrentControlSet, referenced within the aforementioned path, is itself a link that points to HKLMSYSTEMControlSetXXX, where XXX is a three-digit number representing the active configuration control set.
Finally, HKEY_CLASSES_ROOT is presented as a merged set of subkeys from HKLMSoftwareClasses and HKEY_CURRENT_USERSoftwareClasses. For the details on how this merged view is created, refer to the following web page:
GO GET IT ON THE WEB
Don’t worry about trying to keep that all straight in your head—it’s a lot to track. But be mindful of these mappings when reviewing registry evidence from a system. If you’re dealing with “dead” hive files, you won’t be able to find any of the virtual key paths, such as HKEY_CURENT_CONFIG or HKEY_CURRENT_USER, or even some subkeys, such as HKEY_LOCAL_MACHINESYSTEMCurrentControlSet, that only exist on a live system.
Registry Timestamps
Unlike file system metadata, registry keys contain only a single timestamp. Each key has an associated LastWriteTime that is set when it is created and updated whenever any values directly under a key are added, removed, or otherwise changed.
However, changes to a subkey’s values do not affect its parent key’s last modified timestamp. For example, adding the value Test to HKLMPathToSampleRegKey would update the last modified time for RegKey, but not for the keys Sample, To, and Path. |
Note that there are no “created” or “accessed” timestamps. Also, registry timestamps are only associated with keys, not the values or data therein. These limitations mean that absent other context, it is impossible to determine whether a key’s LastWriteTime represents its creation time or a subsequent update, nor is it possible to prove which value within a key changed. An analyst may have to deduce the significance of a key’s LastWriteTime by assessing and correlating other artifacts, such as evidence from the file system or event logs.
For example, let’s look at a common auto-run key that specifies programs that execute upon system startup: HKEY_LOCAL_MACHINESoftwareMicrosoftWindowsCurrentVersionRun.
The table shows three values under the Runkey: VMWare Tools, Adobe Reader Speed Launcher, and winupdat. That last one sounds suspicious—can we ascertain when it was added to the registry? Not without other supporting evidence. The LastWriteTime time in each row refers to the (same) key holding these three values, and will be updated if any of those values or the data therein change (or if another value is added or removed). Of course, if we can use file system metadata or other evidence to prove that C:windowsaddinswinupdat.exe was created at or near 2012-08-30 02:34:30 during a period of known attacker activity, we might reasonably conclude that the key was last modified upon the addition of the winupdat value.
There’s one more drawback to the limited amount of time metadata is available in the registry—Windows frequently updates the LastWriteTime for large swaths of registry keys during system updates and service pack installations, and sometimes even from a reboot. This will often be readily apparent when conducting timeline analysis of the registry and filtering around the LastWriteTime of a key of interest. If you see a significant number of other keys—particularly within the same or nested paths—updated within the same second or minute, it’s likely you’re witnessing a change brought about by the operating system, software update, or even a security application such as antivirus.
What about deliberate changes to LastWriteTime? In our discussion of NTFS and file system metadata, we discussed “time stomping”—the process by which an attacker can manipulate a file’s timestamps to inhibit forensic analysis. The Windows API does not provide a method specifically designed to change a key’s Last Modified time that is equivalent to the SetFileTime function for file metadata. As a result, we rarely see attackers attempt to directly modify registry timestamps. However, as of this writing, at least one proof-of-concept tool has demonstrated that, given SYSTEM privileges, an application can set a registry key’s timestamps to an arbitrary value. It remains to be seen whether this counter-forensic technique sees more widespread use in the future. You can read more about the tool (SetRegTime, by Joakim Schicht) at the following website:
GO GET IT ON THE WEB
Registry Reflection and Redirection
Before diving into some examples of useful registry keys, we need to cover one last and important topic—reflection and redirection. The Windows WoW64 subsystem, responsible for ensuring 32-bit compatibility on 64-bit operating systems, “reflects” or “redirects” a 32-bit application’s attempts to access certain registry paths. This occurs transparent to the application, allowing it to continue to use the same hard-coded registry paths that it would expect to exist on a 32-bit operating system.
We’ll use one of the most common affected paths as an example of how this works. On a 64-bit version of Windows, 64-bit applications can access the registry path HKEY_LOCAL_MACHINESOFTWARE. A 32-bit application may attempt to access the same path, but WOW64 will instead transparently redirect it to the path HKEY_LOCAL_MACHINESOFTWAREWoW6432Node. Microsoft helpfully provides a list of each of these redirected registry paths in the MSDN article “Registry Keys Affected by WOW64”—they all use the same naming convention WoW6432Node for the 32-bit compatible subkeys:
GO GET IT ON THE WEB
To further complicate matters, WOW64 performs “reflection” instead of (and in addition to) redirection on versions of Windows prior to Windows Server 2008 R2 and Windows 7. The reflection process entails synchronizing copies of registry subkeys, values, and data therein that applications may need to share between both the 32-bit and 64-bit registry views. This is further detailed in the MSDN article “Registry Reflection”:
GO GET IT ON THE WEB
Redirection and reflection can have a significant impact on your investigative process. If you use a 32-bit utility to collect and analyze registry data on a live system, you may be missing entire sets of subkeys that WOW64 will render inaccessible. Similarly, it’s important to recognize the meaning of registry paths under subkeys labeled WoW6432Node that you might encounter during timeline analysis or other forensics.
Analysis
So what type of evidence can you recover from the registry? A better question might be, what evidence you can’t get? For the purposes of this chapter, we’ll touch on some of the keys and values we’ve found to be most useful during our incident response investigations. This section is divided into the following parts for easy reference:
• System Configuration Registry Keys
• Shim Cache
• Common Auto-Run Registry Keys
• User Hive Registry Keys
System Configuration Registry Keys
Windows provides the Control Panel and numerous other GUI-based solutions for configuring a system. Fortunately for you, many of these settings are actually retained and organized in a “single” place—the registry, of course. By examining the correct keys, you can recover everything from a computer’s operating system installation date to the current firewall policy or a local user’s group membership. You just need to know where to look, and given the size and complexity of the registry, that’s not always intuitive.
In the following tables, we summarize some of the registry keys we’ve found to be most helpful when gathering basic system information and network, user, and security settings. Some of these keys are encoded and not easily human readable—in such cases, we’ve provided footnotes to additional references, and we’ll also cover a variety of analysis tools that can greatly simplify these tasks at the end of the section on the registry in this chapter.
On a live system, access to the HKLMSecurityPolicy key is restricted to SYSTEM. Refer to “How To Determine Audit Policies from the Registry” at the following web page to decode the contents of the PolAdtEv value:
GO GET IT ON THE WEB
Refer to “Well-known security identifiers in Windows operating systems” for a listing of common SIDs:
GO GET IT ON THE WEB
Shim Cache
The Shim Cache, also known as the Application Compatibility Cache, allows Windows to track executable files and scripts that may require special compatibility settings to properly run. The decoded contents of this key vary by version of Windows, and can include the following data:
• Executable or script file names and full paths
• Standard information last modified date
• Size in bytes
• Whether the file actually ran on the system
The cache is maintained within kernel memory and serialized to the registry upon shutdown. The registry key location varies slightly depending on the version of Windows:
• Windows Vista, Windows 7, Server 2003, and Server 2008 HKLMSYSTEMCurrentControlSetControlSession ManagerAppCompatCacheAppCompatCache
• Windows XP HKLMCurrentControlSetControlSession ManagerAppCompatibilityAppCompatCache
So how is the Application Compatibility Cache potentially more useful than other sources of evidence that track program execution, such as Windows prefetch? One advantage is that the cache can track more items than prefetch, which rolls after 128 files: Windows 7 and Server 2008 maintain up to 1,024 cache entries, and earlier versions of Windows track up to 512 entries. Windows also processes and adds executable files to the cache upon changes to file metadata and path, regardless of whether the file has executed. In other words, the Shim Cache can provide evidence of executable files that never actually ran on a system.
For additional information on how each version of Windows stores and maintains this data, we recommend Andrew Davis’s excellent whitepaper “Leveraging the Application Compatibility Cache in Forensic Investigations.” Andrew’s accompanying free utility ShimCacheParser.py is capable of decoding the contents of the Shim Cache from a live system, an acquired registry hive, and other formats. The whitepaper and utility can be downloaded at the following links:
GO GET IT ON THE WEB
Shim Cache whitepaper www.mandiant.com/library/Whitepaper_ShimCacheParser.pdf
Shim Cache Parser github.com/mandiant/ShimCacheParser
The following table provides an excerpt of ShimCacheParser.py output from a Windows 7 (32-bit) system. Note that Last Update and File Size are not available in this example, due to differences in how each version of Windows implements the Shim Cache.

The output of ShimCacheParser.py preserves the original order of entries in the cache, meaning that rows are presented in order from most recently added or updated files to least recently added or updated. Although there is no formal documentation covering which activities result in updates to a file’s ShimCache entry, we’ve observed that both file execution and file creation have this effect.
As previously noted, the Last Modified date tracked in ShimCache data originates from a file’s Standard Information attribute. We’ve observed that if an executable file’s Last Modified date is time-stomped, the corresponding ShimCache entry will reflect the tampered timestamp. Also recall from the NTFS section of this chapter that the Last Modified timestamp does not necessarily correspond to a file’s creation date. Depending on how a file is copied to or created in its target path, this time may originate from its source system or media.
Auto-Run Keys
Auto-run keys, also known as auto-start extensibility points or persistence mechanism keys, ensure that Windows executable files, DLLs, and other components automatically load upon system boot, user login, and other conditions. Attackers frequently modify existing auto-run registry keys, or add new keys, to ensure that their malware is automatically loaded upon system startup. As a result, it’s important to understand how these auto-run mechanisms are configured, their intended legitimate usage, and how an attacker might subvert them.
Fortunately for both software developers and malware authors, but unfortunately for us analysts, Windows provides hundreds of registry-based persistence mechanisms—some of which still remain undocumented. Providing a comprehensive list of all such known keys is beyond the scope of this section. Instead, we focus on the auto-run keys that we’ve seen attackers target most frequently during the course of our own investigations. We identify the evidence and intended design and functionality of each of these auto-runs to ensure that you know what keys to look for and how to analyze them. Afterward, we provide general analysis techniques that can be applied to quickly review auto-runs, identify suspicious entries, and conduct triage.
Windows Services Services are the most common and widely used persistence mechanism provided by Windows. A service is designed to run in the background, without the need for any user interaction. It can either start automatically during system boot, upon an event, or manually. It can also run under various privileges, such as a local user, a domain user, or a system account. An average Windows system will have dozens of legitimate services that support core operating system features—everything from event logging to file sharing, prefetch, and DHCP. Windows device drivers—critical software used to interact with hardware attached to the system—can also be configured to load as services (but have several technical distinctions in how they are designed and loaded). Finally, third-party applications may install services to ensure that certain components always run in the background (print and scan drivers are a common example).
Services typically run under one of three built-in logon accounts present on all Windows systems:
• Local System has complete, unrestricted control over a system (or an Active Directory domain, if running on a domain controller). If a service under this context is compromised, an attacker can do anything.
• Network Service has similar privileges to an ordinary member of the Users group, and can authenticate over the network using the system’s machine account.
• Local Service is the most restrictive context and cannot access network resources as the machine account. Of course, you can also configure a service to run under any local or domain account, as long as its privileges are sufficient for the corresponding service application to successfully execute.
Microsoft cautions against using privileged domain accounts, especially domain administrators, to run services. If an attacker can gain control over the service or steal its credentials, they can immediately take advantage of these elevated privileges. This often occurs upon the compromise of a SQL server, web server, or other application service that has been poorly configured. |
So how are services configured in the registry? Each service will have its own set of values and subkeys under HKLMCurrentControlSetservices{servicename}, where {servicename} represents the “short” name of a given service. Each service can have a variety of values and subkeys that control their behavior, but you should ensure you’re familiar with the following essential ones:
GO GET IT ON THE WEB
Microsoft provides details on each of the service key values and its effect at support.microsoft.com/kb/103000.
• DisplayName A “long-form” descriptive name for the service. Can be up to 256 characters and include spaces and mixed case.
• Description A comment that may describe the functionality or purpose of the service.
• ImagePath The path to the executable file (for a service) or .sys file (for a driver) to be executed.
• Start How and when the driver or service should be loaded. The data for this key is in the range 0–4. For most malware, this will be set to 2 (Automatic).
• 0x0 Boot (by kernel loader—drivers only)
• 0x1 System (by I/O subsystem during kernel initialization—drivers only)
• 0x2 Automatic (by Service Control Manager upon startup—for services)
• 0x3 Manual (user or application must explicitly request that the service be started)
• 0x4 Disabled
• 0x1 Driver
• 0x2 File system driver
• 0x10 Service that runs in its own process
• 0x20 Service that shares a process
• DependOnGroup or DependOnService Specifies other service groups and individual services that must start before the service can load and run.
• Group Specifies a group to which this service belongs. Services in the same group will start up together.
If you review these values for a few service keys on any given Windows system, you’ll notice that the majority of them are configured with the same ImagePath—C:WINDOWSsystem32svchost.exe. Similarly, if you review a process listing, you’ll find numerous instances of svchost.exe running under the user privilege contexts we mentioned earlier: Network Service, SYSTEM, and so on. What’s going on here?
The majority of Windows services are implemented as DLLs rather than standalone executable files. In order to properly load and execute the code within these DLLs, Windows relies on a hosting process, svchost.exe, which is configured as the ImagePath. The DLL itself must be designed in a specific way to ensure that svchost. exe can load it as a service—for example, it must have an exported function named ServiceMain that defines its entry point.
The following registry subkey and value specify the DLL to be loaded by a hosting ImagePath (see Figure 12-15):
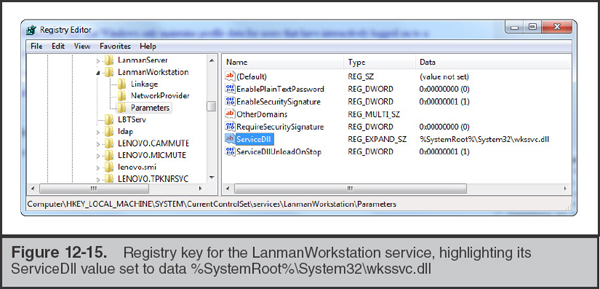
HKLMCurrentControlSetservices{servicename}ParametersServiceDll
As a result of the various ways that a service may execute, you’ll need to ensure you review both the ImagePath and the ServiceDll (if present) when determining whether a service may be configured to load a malicious file. In previous investigations, we’ve found that attackers typically prefer to install malware as a ServiceDll that gets loaded by svchost.exe—it is easier to hide it in a process listing and blends in with all the other similarly loaded services. An attacker can either create a new service to do so, or simply reconfigure the ServiceDll parameter for an existing but disabled or noncritical service to load their malware.
Runtime Analysis of Services The Windows Service Control Manager (SCM), services.exe, is responsible for launching Windows services upon startup (based on the configuration of the aforementioned registry keys). Windows provides several commands you can use to retrieve information from the SCM; some live response toolkits that rely on the Windows API use these methods to enumerate services.
You can use the “sc” console command to interact with the Service Control Manager on a running Windows system. For example, “sc query” (or “sc queryex”, for extended detail) will enumerate the currently configured services and their state (for example, running or disabled) on a system. Figure 12-16 illustrates an example of the output of the “sc query” command. The “sc” command can also start, stop, and create services on the local system or a remote system (provided you have the ability to establish a network logon to the host with Administrator privileges). Details on how to use the “sc” command can be found at the following web page:

GO GET IT ON THE WEB
You can also invoke the Services Management snap-in, services.msc, from the Run menu to review and edit the configuration of existing services.
One significant limitation of both the “sc” command and the services.msc snap-in is that neither will allow you to review or edit the ServiceDLL value for any hosted services. However, you can use a registry editor, such as regedit, to view or edit the ServiceDLL parameter.
If you’ve obtained a process listing through the Windows API or by parsing a memory image, you can also review running services—each service’s ImagePath will correspond to a running process name, whose parent process will typically be services. exe. But what about all of the grouped, hosted services running under instances of svchost.exe? How can you tell which PID of svchost.exe is running which service?
Several memory analysis tools, such as Volatility Framework, can parse service configuration data out of memory and correlate running service names to process IDs. You can also use the tasklist /svc console command (native to Windows) to list the services running under each svchost.exe process. As an example, in Figure 12-17, note that two services run under svchost.exe (PID 532): RpcEptMapper and RpcSs.
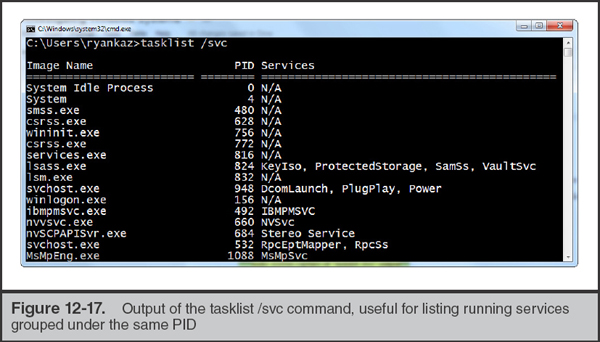
Run and RunOnce Keys “Run” keys are simple and intuitive—they point to an executable file that will be launched either upon bootup (if within the HKLM hive) or upon user login (if within a user’s NTUSER.DAT hive). Here are four common Run keys:
• HKLMSOFTWAREMicrosoftWindowsCurrentVersionRun
• HKLMSOFTWAREMicrosoftWindowsCurrentVersionRunOnce
• HKEY_USERS{SID}SOFTWAREMicrosoftWindowsCurrentVersionRunOnce
• HKEY_USERS{SID}SOFTWAREMicrosoftWindowsCurrentVersionRunOnce
The values under these keys specify an (occasionally) descriptive name for the Run item, and their respective data supplies the path to the executable file and any desired arguments. For example, Figure 12-18 depicts seven values under the HKLMSOFTWAREMicrosoftWindowsCurrentVersionRun key, each of which will execute upon bootup.
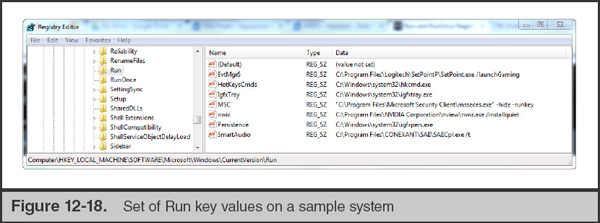
Similarly, RunOnce does exactly what it sounds like. A value added to this key will execute once and subsequently be removed.
Active Setup Active Setup is a mechanism provided by Windows to facilitate software installation and update across all users on a system. It has been in place since Windows 98, and still remains utilized by many legitimate applications, as well as by malware attempting to maintain persistence. Active Setup keys are located in two locations:
• HKLMSOFTWAREMicrosoftActive SetupInstalled Components
• HKEY_USERS{SID}SOFTWAREMicrosoftActive SetupInstalled Components
If you look under the Installed Componentskey on a typical system, you’ll find that it contains subkeys that are named after GUID values. Applications typically generate and utilize these GUIDs to avoid inadvertently overwriting one another’s settings. Attackers, however, often get lazy and reuse the same GUID across multiple generations of malware that take advantage of these keys. You may be able to research these GUIDs (we often try simply searching for them on Google) and find that they correspond to malware that has been discovered and documented within public sandbox sites, antivirus bulletins, security blogs, or user forums, which can make it easier to research and identify known-bad ones.
A given GUID subkey for a legitimate Active Setup item can have many values, such as Version, IsInstalled, and StubPath. Figure 12-19 depicts an Active Setup key for the .NET Framework as an example. These subvalues help support the intended functionality of Active Setup keys—upon user login, an application can check whether a given Active Setup key in HKLM is also present in HKCU, compare the values, and determine what to do next (such as install or update itself).

However, the most critical value within these keys—and the only one that attackers typically use—is StubPath. The data within this value contains the path to an executable along with any required arguments. Malware authors can therefore generate a key under Active SetupInstalled Components{GUID}, set the value StubPath, and thereby ensure that their file will run upon system startup or user login (depending on the chosen hive).
As an example, one of the default configurations for the Poison Ivy backdoor uses an Active Setup key for persistence (see Figure 12-20). |
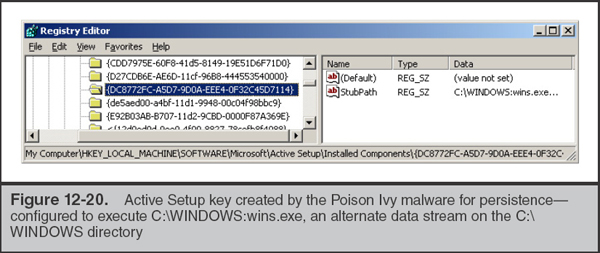
AppInit_DLLs The AppInit_DLLs registry value contains a list of DLLs that will be automatically loaded whenever any user-mode application that is linked to user32.dll is launched. If an attacker adds a malicious DLL to this value, its code will effectively be injected into every subsequently launched application:
HKLMSoftwareMicrosoftWindows NTCurrentVersionWindowsAppInit_DLLs
Both the version of Windows and certain configuration settings can have an impact on whether the system will actually load a file that is specified as in AppInit_DLLs. You can globally disable the loading of all AppInit_DLLs by setting the registry value HKLMSOFTWAREMicrosoftWindows NTCurrentVersionWindowsLoadAppInit_DLLs to 0x0. In Windows Vista, 7, and Server 2008, you can also require that all loaded AppInit_DLLs be digitally signed by setting the value RequireSignedAppInit_DLLs (within the same key) to 0x1. On Server 2008 R2, this requirement is now enabled by default.
LSA Packages Three registry keys configure the Windows Local Security Authority (LSA) and how it handles authentication events. Windows automatically loads the DLLs specified within these values upon system bootup:
• HKLMSystemCurrentControlSetControlLsaAuthentication Packages
• HKLMSystemCurrentControlSetControlLsaNotification Packages
• HKLMSystemCurrentControlSetControlLsaSecurity Packages
Note that malware configured to load as an LSA package does not necessarily have to implement any LSA functionality—it just has to load successfully to result in the execution of malicious code.
Authentication packages implement the code necessary to authenticate users under various protocols. Common defaults under this value include msv1_0 (NTLM local and domain logons), kerberos (Kerberos authentication), wdigest (digest authentication), and tspkg (Terminal Services single sign-on package). Security packages implement underlying authentication security protocols recognized by the operating system, and can have similar default values as authentication packages. Finally, notification packages are invoked when passwords are set or changed. Common default data for this key includes the packages FPNWCLNT (File and Print Services for NetWare), RASSFM (Remote Access Subauthentication), KDCSVC (Kerberos Key Distribution Center Service), and scecli (Security Configuration Engine client). Microsoft has documented these packages at technet.microsoft.com/en-us/library/cc951687.aspx.
Each of these values is of type REG_MULTI_SZ, meaning that the data will be a set of null-terminated strings. Moreover, packages can be referenced without supplying the .DLL file extension. For example, if Security Packages is set to wdigest msv1_0 kerberos, Windows will automatically attempt to load wdigest.dll, msv1_0.dll, and kerberos.dll from %SYSTEMROOT%system32.
An attacker can therefore exploit these keys for the purposes of malware persistence. For example, adding “evil” to the REG_MULTI_SZ list under the Authentication Packages value will cause the system to automatically load %SYSTEMROOT%system32evil.dll upon bootup. The highly sophisticated and well-publicized Flame malware used this persistence mechanism by adding a reference to its file name (mssecmgr.ocx by default) to the Authentication Packages value.
Browser Helper Objects Browser Helper Objects (BHOs) serve as add-ons or plugins for Internet Explorer. They have the ability to interact with and manipulate web content displayed by the browser, as well as to extend the Internet Explorer user interface. If you’ve ever had to fix a friend or relative’s computer, you probably have encountered BHOs in the form of “useful” browser toolbars that came bundled along with software installation packages. Because BHOs are automatically loaded by Internet Explorer, they are a popular persistence mechanism for malicious software—particularly “adware” and “scamware” that may embed advertisements within web page content, redirect victims to other sites, or monitor browser usage.
How do they work? BHO DLLs are Component Object Model (COM) components that get loaded into the Internet Explorer process space each time a new instance of iexplore.exe executes. Internet Explorer provides hooks that allow these loaded BHOs to interact with various aspects of browser functionality. All COM objects, including BHO, have a Class ID (aka CLSID—basically a GUID) that serves as a unique identifier. You can enumerate the BHOs on a system by reviewing the following key:
HKLMSoftwareMicrosoftWindowsCurrentVersionExplorerBrowser Helper Objects{CLSID}
Next, for each CLSID of interest, refer to HKEY_CLASSES_ROOTCLSID{CLSID}InprocServer32(Default). The data for this registry value will point to the DLL file associated with the COM object.
CLSIDs for common BHOs (as well as some malware) are typically consistent from system to system. So if you encounter an unknown one, try searching for the CLSID on Google. Of course, an attacker can always install a malicious DLL under a CLSID for a legitimate BHO, so you should still check that the associated file is digitally signed, has a known-good hash, or can otherwise be triaged and verified. |
Internet Explorer 7 and later also provide a menu option, Manage Add-Ons, that can be used to review and enable or disable individual BHOs.
Shell Extensions Shell extensions are to Windows Explorer as Browser Helper Objects are to Internet Explorer. They provide the ability to extend the Windows Explorer with additional functionality, such as context menu items that appear when right-clicking a file or folder. Like Browser Helper Objects, shell extensions are COM DLLs and must therefore implement certain interfaces and have specific exported functions.
Each shell extension COM DLL will be listed under the key and value HKCRCLSID{CLSID}InprocServer32(Default). A shell extension must also register itself to handle whichever types of Explorer items it wants to extend—files, directories, drives, printers, and so on. The handlers for each of these items are listed under HKCR{sub-key}shellex.
Windows provides an option to blacklist specific shell extension CLSIDs via the key HKLMSoftwareMicrosoftWindowsCurrentVersionShell ExtensionsBlocked. Similarly, if you set HKLMSoftwareMicrosoftWindowsCurrentVersionPoliciesExplorerEnforceShellExtensionSecurity to 1, Windows will only load shell extensions specified under the key HKLMSOFTWAREMicrosoftWindowsCurrentVersionShell ExtensionsApproved. |
The MSDN article “Registering Shell Extension Handlers” provides more detail on the different ways that shell extensions can be configured on a Windows system and the associated subkeys.
GO GET IT ON THE WEB
Winlogon GINA The Graphical Identification and Authentication (GINA) service, present in Windows 2000, XP, and Server 2003, was designed to allow third-party software developers to extend and customize the Windows logon prompt. The intent was largely to support alternative authentication mechanisms. Utilizing this feature is as simple as implementing a DLL with the required export functions expected by the GINA service, and configuring the GinaDLL registry value to point to the file. The winlogon.exe process automatically loads this file upon logon time: HKLMSoftwareMicrosoftWindows NTCurrentVersionWinlogonGinaDLL.
Not surprisingly, attackers quickly discovered that this functionality could be abused. A malicious GINA DLL can effectively perform man-in-the-middle attacks on Windows authentication. Most of the GINA malware we’ve encountered simply log Windows credentials supplied at the logon prompt to an output file.
Microsoft eliminated custom GINA providers in favor of a new credential provider service model in Windows Vista, Server 2008, and later versions.
Winlogon Notification Similar to GINA, WinLogon Notify packages were another component of the legacy logon system in Windows 2000, XP, and Server 2003. DLLs listed in the following registry value would receive notifications from the winlogon.exe process for events such as user logon, logoff, screen lock, and screensaver start:
HKLMSoftwareMicrosoftWindows NTCurrentVersionWinlogonNotify
By setting this registry value to point to a malicious DLL, an attacker can load and execute malicious code whenever these Winlogon events occur. Microsoft eliminated the Winlogon Notify functionality in Windows Vista, Server 2008, and later versions.
Winlogon Shell Windows provides users with the ability to customize the shell that is loaded upon user logon. By default, this is set to Explorer.exe; however, you can modify the WinlogonShell registry value to point to any executable file. Use of custom shells is relatively uncommon, so analysts should take the time to validate any executable files to which these keys point:
• HKLMSOFTWAREMicrosoftWindows NTCurrentVersionWinlogonShell
• HKEY_USERS{SID}SOFTWAREMicrosoftWindows NTCurrentVersionWinlogonShell
Note that the “WinLogonShell” key and value can exist under both HKLM and individual user hives, allowing for per-user customization of the startup shell.
Winlogon Userinit The Winlogon process automatically executes the executable file(s) specified by the Userinit registry value:
HKLMSOFTWAREMicrosoftWindows NTCurrentVersionWinlogonUserinit
By default, this is set to userinit, which ensures that %SYSTEMROOT%system32userinit.exe will execute. In turn, userinit.exe is responsible for loading logon and group policy scripts, several other auto-runs, and the Explorer shell. However, it is possible to append additional executable paths and file names (delimited by commas) to this value.
For instance, if Userinit was set to userinit, “C:path omalware.exe” then malware.exe would automatically execute upon user logon.
Identifying Malicious Auto-Runs Reviewing the enormous list of registry keys that can be hijacked for the purposes of malware persistence can be a little intimidating (or depressing). The task of identifying an evil auto-run key within a haystack of other keys can be difficult, but there are several analytical techniques that can help you do some rapid data reduction and triage. In most cases, note that these techniques apply to any type of registry-based auto-run—after all, they all essentially boil down to a key-value pair pointing to an executable file or DLL on disk.
When examining a set of auto-run keys, many analysts will initially attempt to “eyeball it” to find suspicious-looking entries—files in unusual paths, spelling errors, broken English descriptions, or similar anomalies. This approach can be risky, especially given the enormous variety of third-party applications, some of which may not be “ideal” models of good software development practices, that install themselves under the same types of auto-run keys used by malware. Conversely, consider that a targeted attacker may exercise deliberate care to ensure that malicious software is configured to be persistent using keys and file names that blend in with legitimate Windows components.
To illustrate this point, take a look at the four Windows services listed next. Based solely on the information provided, which (if any) do you think are malicious? Hint: at least one of them is.
ServiceName: hpdj |
Description: [none] |
ImagePath: C:Documents and SettingsjohncdLocal SettingsTemphpdj.exe |
ServiceName: iprip |
Description: Listens for route updates sent by routers that use the Routing Information Protocol |
ImagePath: C:Windowssystem32svchost.exe |
ServiceDll: C:Windowssystem32iprinp32.dll |
ServiceName: rfalert |
Description: A module which sends alerts and notifications of monitered events |
ImagePath: D:AppsRightFaxBinAlertmon.exe |
ServiceName: synergy |
Description: Allows another computer to share its keyboard and mouse with this computer |
ImagePath: C:Program FilesSynergysynergyc.exe |
You may have observed that the rfalert service has a spelling error (“monitered” vs. “monitored”) in its description. The hpdj service looks suspicious for quite a few reasons—especially because it has no description and runs out of a user profile’s temp directory. The “synergy” service has a punctuation error (“it’s” vs. “its”). But you might be surprised to learn that all three are actually legitimate services created by third-party applications (the strangest one of the bunch, hpdj, is an artifact of HP printer software). In this example, the iprip service is malicious. The service name and description are both identical to the legitimate iprip service built in to Windows. However, an attacker has modified the ServiceDll to point to a malicious file, iprinp32.dll, rather than the correct DLL file name, iprip.dll.
Because “eyeballing” it clearly has risks, what’s a more consistent, reliable approach? Given a set of registry-based persistence mechanisms—that is, registry keys and the associated files that they are designed to automatically load—we recommend the following steps:
1. Exclude persistent binaries signed by trusted publishers—though don’t completely dismiss signed binaries. We’ll talk more on that in a minute.
2. Exclude persistent items created outside the time window of interest (if such a time frame is known to a high degree of confidence). Sources of time information can include the registry key last modified times, as well as the MACE times for associated files.
3. Examine the paths of the remaining persistent binaries. This may help identify malicious files in suspicious locations, such as a persistent executable running out of a user’s temporary files directory. It may also allow you to exclude persistent binaries in paths the attacker is unlikely to utilize. This should be performed at the discretion of the analyst and based on an existing understanding of an attacker’s tactics and procedures. Attackers tend to use common directories, such as paths within %SYSTEMROOT%, more frequently than deeply nested directories specific to obscure third-party applications. Of course, a sophisticated attacker that has performed extensive reconnaissance of a compromised system or environment may deliberately utilize such paths—so be wary.
4. Research the MD5 hashes for any remaining persistent binaries, using repositories of known-good software (such as Bit9 File Advisor) or known-bad (such as VirusTotal).
5. Compare any remaining “unknowns” against a known configuration, such as a “gold image” used to install systems in an environment.
Of course, neither digital signature information nor file hashes are stored in the registry—they have to be obtained through analysis of the persistent files themselves. This would be a tedious process if conducted manually; fortunately, several tools can automate this process. We’ll cover registry and auto-run analysis tools later in this section; however, as a quick reference we recommend the SysInternals Autoruns utility and Mandiant Redline (using the “services” and “persistence” collector modules). Both of these tools will enumerate Windows services, collect digital signature information, and calculate MD5 hashes for each service binary.
Figure 12-21 displays a view of Persistence data in the Mandiant Redline tool. Note that the tool displays a combination of data from both the registry and file system to facilitate review.

Keep in mind that “trusting” digital signatures is a data-reduction technique intended to help focus your analysis and triage efforts. Digital signatures are not foolproof! Based on our investigative experience, sophisticated attackers have been targeting digital certificates and code-signing infrastructures at an increasing number of compromised organizations. Such assets can—and have—been used to sign malware. That doesn’t mean you should automatically mistrust any signed file; rather, be open to the possibility of signature abuse, if so directed by other supporting evidence.
Likewise, you shouldn’t expect that all legitimate persistent files—such as those used to support Windows services—will always be signed. This is especially true for third-party applications, but we’ve even seen core operating system files that are unsigned or “lose” signature data following an update or service pack. However, note that in Vista 64-bit and versions of Windows thereafter, all drivers must be digitally signed.
Earlier on, we mentioned using timeline analysis to help eliminate auto-run keys and associated files that were created outside a known period of attacker activity. We can also use time metadata in other ways to identify suspicious persistence mechanisms. For example, if while timelining registry keys and file metadata on a system, you observe that a known auto-run key was last modified during a period of interest, you might want to check the file to which it points to determine whether or not it is legitimate. Conversely, if you identify a known malicious file through other means, you should check whether any auto-run keys reference it by name or full path—regardless of when they were last modified. These approaches can help you leverage timeline analysis without getting “tunnel vision”—for example, being so focused on a single known time frame that you miss other evidence.
Speaking of time, recall that registry keys hold the Last Modified date, not values or data. Unfortunately, some auto-runs are configured as values within paths that are frequently “touched” by the operating system or other software. For example, values within HKLMSoftwareMicrosoftWindowsCurrentVersionRungo directly under the Runkey, which means that the addition or change of any auto-run that uses this mechanism will update the only available Last Modified time for this path. The same goes for the root paths of Windows services (for example, HKLMSystemCurrentControlSetServices{servicename}. Windows updates and service packs frequently “touch” all service keys, updating their Last Modified time. Fortunately, the Parameters and Security subkeys, both of which are present on many services, are less frequently impacted by such updates. As a result, their Last Modified date can be more resilient to change and hold more forensic significance.
Finally, if you’ve identified evidence of a malicious service through registry analysis, don’t forget to review the System event log. The Service Control Manager can log events such as service creation, stop, and start events. Caveats (as always): note that this only applies to services—the System event log will not record events related to the other registry-based persistence mechanisms we discussed in this chapter. Also, an attacker can configure a service without using the SCM, thereby omitting the Service Created event that would otherwise be logged. Similarly, be aware that a persistent malicious service will typically start on bootup and stop during shutdown, which means that each service start and stop event recorded in the System event log may not be a reflection of attacker activity, but rather the normal cycles of system usage. However, we do find it useful to identify the earliest known and most recently logged event associated with a known-bad service to better establish a time frame of compromise. For more information on the types of log entries generated by service activity, refer to the “Event Logs” section of this chapter.
User Hive Registry Keys
In contrast to the registry evidence we’ve discussed to this point, the user hives contain evidence specific to the settings and behavior of individual accounts on a Windows system. This can include everything from records of previously executed applications to artifacts created during access to local and remote directories via Windows Explorer.
So if each user has their own registry hive(s), how do you select which ones to review? “All of them” may not be an ideal option when trying to conduct triage and focus your efforts. Your first priority should be to acquire and analyze the NTUSER.DAT and USRCLASS.DAT hives for any compromised account on a given system. If your lead is solely a time period of suspicious activity on a system (perhaps through event logs or other sources of evidence), you should consider reviewing any user hives containing keys that were last modified during the same period. Finally, be careful not to rule out machine accounts, such as NetworkService and LocalSystem (both used by the Service Control Manager), within your scope of analysis. We’ve often seen malware execute under the context of these accounts and yield evidence in their corresponding registry hives.
In this section, we focus on several user-specific keys that we’ve found to be the most helpful during our incident response investigations: Shellbags, UserAssist, MUICache, Most Recently Used (MRU), TypedURLs, and TypedPaths.
Shellbags Have you ever noticed that Windows Explorer will consistently restore previously open windows with the exact same size, position, and view configuration (including visible columns)? If so, you’ve seen shellbags at work: the data necessary to support this functionality is stored within a special set of keys within your user profile registry hive. These keys are set each time a user browses to a local or network folder in Explorer; moreover, they persist even if a directory is subsequently deleted. Shellbag registry keys are present in the following locations:
Windows Vista, 7, Server 2008
• HKEY_USERS{SID}_ClassesLocal SettingsSoftwareMicrosoftWindowsShell
Windows XP and Server 2003
• HKEY_USERS{SID}SoftwareMicrosoftWindowsShell
• HKEY_USERS{SID}SoftwareMicrosoftWindowsShellNoRoam
Analyzing shellbag keys can provide an investigator with the following information:
• Full directory paths accessed via Explorer
• The date and time at which access to each path occurred, obtained by referencing the Last Modified time of the corresponding shellbag key, under certain circumstances (refer to the following note)
• The Modified, Accessed, and Created times of each path tracked in shellbags, recorded as of the time at which the access occurred
This evidence can be invaluable when trying to determine whether an attacker accessed specific directories in order to steal data, stage malicious files, or simply survey what’s available. Figure 12-22 provides an example of decoded shellbag evidence generated by a Python script, shellbags.py, that we cover later in this section.
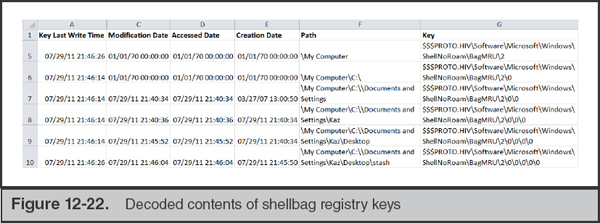
Be mindful of the distinction between the decoded dates within a shellbag key’s data and the Last Modified time of the key itself. Also, note that due to the complex structure of shellbag keys, the Last Modified time may not always correspond to the time at which access to a path occurred. Dan Pullega has an excellent analysis of shellbags that further explains these challenges on his 4n6k blog: www.4n6k.com/2013/12/shellbags-forensics-addressing.html. |
The structure of shellbag keys and their behavior is a rather complex topic in and of itself. “Using shellbag information to reconstruct user activities,” by Zhu, Gladyshev, and James, was one of the first studies that thoroughly documented how shellbags work, and comes as highly recommended reading. Chad Tilbury provided more recent insight into shellbags and Windows 7 in his blog post “Computer Forensic Artifacts: Windows 7 Shellbags.”
To perform analysis on shellbag values, you can use a number of free and commercial tools. The following free tools are widely used and can extract and decode shellbag keys given an acquired NTUSER.DAT or USRCLASS.DAT registry hive. Their output is well suited for integrating into timelines of attacker activity:
GO GET IT ON THE WEB
Shellbags research paper www.dfrws.org/2009/proceedings/p69-zhu.pdf
SANS shellbags blog computer-forensics.sans.org/blog/2011/07/05/shellbags
shellbags.py by Willi Ballenthin github.com/williballenthin/shellbags
sbag by TZWorks www.tzworks.net/prototype_page.php?proto_id=14
UserAssist The UserAssist key tracks applications that a user has launched through the Windows Explorer shell:
HKEY_USERS{SID}SoftwareMicrosoftWindowsCurrentVersionExplorerUserAssist
This data is used to populate a user’s Start Menu with a customized list of frequently launched programs. The decoded contents of UserAssist keys include the following:
• Full paths to each executable
• Number of times each program ran
• Last execution time
Sounds a lot like Windows prefetch, right? Well, mostly. One major distinction is that UserAssist only tracks items opened via Explorer. That includes programs launched from the Run menu and even link files opened through the Start Menu, but does not include programs launched from a command shell. Conversely, prefetch files do not provide context as to who executed a specific program, nor whether it was executed during an interactive session or otherwise.
As is the case with shellbags, UserAssist values and data must be decoded to yield human-readable evidence. The value names—one for each executable file—are ROT13-encoded versions of their respective full paths. Figure 12-23 shows the raw and decoded contents of a sample UserAssist key. Note that the entries displayed between these two screenshots are not one-for-one matches due to the different sort order that occurs when viewing the decoded data.

The following free tools can extract and decode UserAssist keys from a live system, or given an acquired NTUSER.DAT registry hive:
GO GET IT ON THE WEB
UserAssistView by NirSoft www.nirsoft.net/utils/userassist_view.html
UserAssist by Didier Stevens blog.didierstevens.com/2012/07/19/userassist-windows-2000-thru-windows-8/
MUICache The MUICache registry key provides yet another source of evidence for programs that were previously executed by a user. Windows populates this key with values containing the full paths to executable files and batch scripts launched via Explorer (see Figure 12-24). The MUICache key values and data are stored in the following locations:

• Windows Vista, 7, Server 2008 HKEY_USERS{SID}_ClassesLocal SettingsSoftwareMicrosoftWindowsShellMuiCache
• Windows XP and Server 2003 HKEY_USERS{SID}SoftwareMicrosoftWindowsShellNoRoamMUICache
The data associated with each respective value contains either the executable file’s FileDescription from its Version Information Resources section, or simply its file name if FileDescription is not present. Remember that FileDescription and other PE Resource Version Information strings can be set to any value—there’s nothing stopping malware authors from filling these fields with legitimate-looking values.
Although the forensic utility of this key has been known for quite some time, Microsoft provides minimal documentation on its behavior. It is unclear whether there is a limit on the number of executable files that can be tracked by MUICache and whether this changes based on the version of Windows. Also note that unlike UserAssist and Prefetch, MUICache does not record an execution time or frequency of execution data.
The MUICache key values and data are human readable and require no special decoding for analysis. NirSoft provides a freeware utility, MUICacheView, that can be used to quickly view the contents of this key on a live system:
GO GET IT ON THE WEB
Most Recently Used (MRU) Keys Windows operating system components and applications all can use registry keys to track most recently used (MRU) items. You’ve probably encountered MRUs whenever you see a File or Open menu that is prepopulated with recently accessed files. Because they reflect user-specific activity, MRU keys are typically stored within the NTUSER.DAT hives rather than system-wide registry hives.
Applications don’t need to adhere to any standard registry path or value naming convention for MRU keys; as a result, a system may have hundreds of such keys in different locations depending on what’s installed. Rather than attempt to catalog all of the known MRUs for the myriad of applications out there, we’ll focus on some of the most important ones for core Windows applications.
Explorer Open and Save MRU Windows Explorer maintains several sets of registry keys under ComDlg32 that track the files and directories most recently accessed in the Open and Save As dialog menus:
Windows Vista, 7, and Server 2008
• HKEY_USERS{SID}SoftwareMicrosoftWindowsCurrentVersionExplorerComDlg32OpenPidlMRU
• HKEY_USERS{SID}SoftwareMicrosoftWindowsCurrentVersionExplorerComDlg32LastVisitedPidlMRU
• HKEY_USERS{SID}SoftwareMicrosoftWindowsCurrentVersionExplorerComDlg32CIDSizeMRU
Windows XP and Server 2003
• HKEY_USERS{SID}SoftwareMicrosoftWindowsCurrentVersionExplorerComDlg32OpenSaveMRU
• HKEY_USERS{SID}SoftwareMicrosoftWindowsCurrentVersionExplorerComDlg32LastVisitedMRU
Numerous applications utilize these dialogs for file operations; as a result, this evidence can help an analyst determine whether a user of interest created or opened a specific file.
OpenSavePidlMRU (OpenSaveMRU in older versions of Windows) tracks file names and paths that have been opened or saved using Explorer’s Open or Save As dialog. This key is organized into subkeys for each file extension with which the user has previously interacted—for example, (…)OpenSavePidlMRUdocx contains the most recently opened or saved .docx files. A wildcard subkey, (…)OpenSavePidlMRU*, contains the last 20 opened or saved files regardless of extension.
LastVisitedPidlMRU (LastVisitedMRU in older versions of Windows) tracks programs that have launched an Open or Save As dialog and the most recent directory accessed by each. This is how programs can reopen the Open/Save As dialog in the same location where it was previously used.
CIDSizeMRU (only present in Vista and later) tracks the size and screen position of Explorer dialog windows for previously executed applications.
Harlan Carvey’s RegRipper (regripper.wordpress.com) includes a ComDlg32 plugin that, given an NTUSER.DAT registry hive, can identify and parse the contents of these keys.
Start Menu Run MRU This key tracks a list of applications that have been previously executed through the Start menu’s Run dialog:
HKEY_USERS{SID}SoftwareMicrosoftWindowsCurrentVersionExplorerRunMRU
The values and data within this key are in human-readable plain text. Figure 12-25 displays the sample contents of a user’s Start Menu RunMRU key, illustrating that the user has executed ZoomIt64.exe, services.msc, cmd.exe (with arguments included), and iexplore.exe.
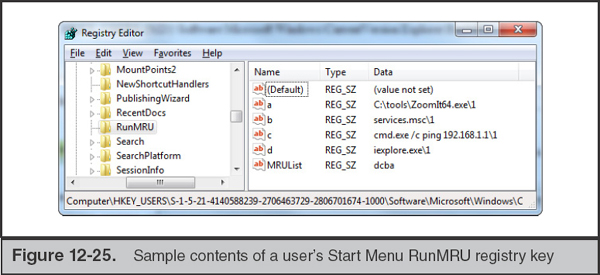
RecentDocs The RecentDocs key contains a list of recently opened files (not just documents—any extension) used to populate the File menus of various applications:
HKEY_USERS{SID}SoftwareMicrosoftWindowsCurrentVersionExplorerRecentDocs
The values within this key mirror the link (.lnk) files tracked within C:Documents and Settings\%USERNAME%Recent; in fact, deletion of a link file will result in automatic deletion of the corresponding value within RecentDocs.
RecentDocs has additional subkeys that group previously opened files by extension—up to 10 apiece—similar to the structure of subkeys under OpenSavePidlMRU. Analysis of the values within these keys may yield evidence of other files no longer present on the system—particularly for those with uncommon extensions that are less likely to fill up their respective subkey’s “history” of values and cause older entries to be overwritten.
Internet Explorer TypedURLs and TypedPaths Internet Explorer maintains a list of recently accessed URLs that populate the address bar drop-down menu and support its auto-complete feature:
• All versions of Windows HKEY_USERS{SID}SoftwareMicrosoftInternet ExplorerTypedURLs
• Windows Vista and later HKEY_USERS{SID}SoftwareMicrosoftInternet ExplorerTypedPaths
This evidence can help support assertions that a user truly intended (manually typed in) to visit a particular URL, rather than simply “clicking a link by accident.” As its name implies, the TypedURLs registry key tracks URLs that a user either explicitly entered into the address bar (via typing or copy and paste) or selected from auto-complete suggestions while entering a URL. It does not track URLs visited by clicking links or following bookmarks. Prior to Internet Explorer 10, Windows tracked up to 25 values under TypedURLs—url1 (most recently visited) through url25, each of which records a single URL. In Internet Explorer 10 and later, this maximum was bumped up from 25 to 50. The data within these values is human-readable plain text and does not require any further decoding.
Prior to Internet Explorer 10, these keys did not provide sufficient evidence to indicate when a given url# value was added. The Last Modified time for the TypedURLs key is updated upon a change to any of its subvalues; therefore, you can only determine the access time of the most recently added URL. However, Internet Explorer 10 introduced an additional key, TypedURLsTime, that contains matching sets of url# values and data indicating when each was added to TypedURLs. The Digital Forensics Stream blog has a useful post describing how the TypedURLsTime key behaves: dfstream.blogspot.com/2012/05/windows-8-typedurlstime.html. Figure 12-26 displays an example of the TypedURL registry key.

If you examine the TypedURLs key on a Windows XP system, you might be surprised to see local paths (for example, C:Windows) mixed in with Internet URLs. Due to the tight linkages between Explorer and Internet Explorer, the operating system actually tracks explicitly typed local directories and UNC paths in the same manner as Internet addresses. Analyzing this key can therefore provide evidence of a user accessing various paths, albeit without the granularity to provide specific timestamps for each.
On Windows Vista and later versions, TypedURLs no longer tracks any local or UNC paths. However, fear not—Microsoft added an entirely separate key solely for this purpose: HKEY_USERS{SID}SoftwareMicrosoftInternet ExplorerTypedPaths. The structure of TypedPaths matches that of TypedURLs: subvalues named url#, ranging from 1 to 25, where url1 is the most recently accessed directory.
Remote Desktop MRU The Remote Desktop Connection utility (also known as the Terminal Services or Server Client) provides users with the ability to establish Remote Desktop Protocol (RDP) sessions to other Windows systems. This application maintains a history of recent connections as well as configuration data specific to each connection under the following registry keys:
• HKEY_USERS{SID}SoftwareMicrosoftTerminal Server ClientDefault
• HKEY_USERS{SID} SoftwareMicrosoftTerminal Server ClientServers
Within the context of an investigation, this can be a useful source of evidence documenting attempted lateral movement to other systems.
The Terminal Server ClientDefault key contains values that follow the naming convention MRU#, where MRU0 contains the most recently accessed IP address or host name. Windows only adds items to the MRU list upon a successful connection—in other words, if an entered address is unreachable or cannot resolve, it will not be present.
The Terminal Server ClientServers key contains subkeys for each address tracked in the MRU values under Default. For instance, if the value Terminal Server ClientDefaultMRU0 is set to 192.168.1.1, a corresponding subkey (Terminal Server ClientServers192.168.1.1) will also exist. Each subkey under Servers can contain a UsernameHint value, which records the default username for the remote connection, as well as a CertHash value, if the remote system provided a certificate upon initial connection. As a result, these keys may tell you where a user connected via RDP and who they attempted to log in as. The Last Modified time of the subkeys under Servers may also indicate when configuration data specific to an address was last updated.
Registry analysis tools typically fall under two categories—those that are designed to process and decode multiple types of evidence, and those that are designed for a single registry artifact. It’s often best to begin with the former; all-in-one tools can be helpful when you’re not quite sure what you’re looking for, or if you don’t want to have to juggle lots of scripts and utilities to examine your evidence. Nevertheless, it’s always helpful to compare output from multiple tools to ensure you’re getting a complete (and accurate) interpretation of the evidence.
The following tools are all freely available and capable of parsing multiple artifacts from the Windows registry:
• RegRipper regripper.wordpress.com
Developed by Harlan Carvey, RegRipper is among the most widely utilized registry forensics tools available. It is designed around a collection of plugins—many of which are frequently updated by Harlan and other members of the Digital Forensics and Incident Response (DFIR) community—that can recognize and decode a large variety of registry artifacts in both system and user-specific hives. Nearly every registry-based source of evidence covered in this section of the chapter (and many more that we did not include due to space limitations) can be processed by RegRipper. However, in some cases you may find that tools dedicated to specific types of artifacts have more flexibility with input formats or produce more robust output (for example, we prefer ShimCacheParser’s handling of the Application Compatibility Cache keys). Nevertheless, it’s hard to beat the convenience and broad support of this all-in-one utility.
• Windows Registry Decoder www.digitalforensicssolutions.com/registrydecoder
Registry Decoder is another utility designed to integrate multiple analysis plugins into a single user interface. Although it does not support as many registry artifacts as RegRipper, it does handle some of the core sources of evidence, such as common auto-run keys, system configuration keys, shellbags, and other artifacts of interactive user activity. It also provides the ability to search and navigate a registry hive’s contents, as well as the decoded or parsed output of its various plugins, via a user interface (although we’ve found that it can sometimes be a little unstable). Note that as of this writing, Registry Decoder was last updated in late 2012.
AutoRuns and its accompanying console utility, autorunsc, are components of the popular SysInternals suite of utilities offered by Microsoft. Although not strictly a registry analysis tool, AutoRuns is designed to identify and consolidate dozens of common persistence mechanisms across a Windows system—including the myriad of keys we referenced earlier in this section. Moreover, it can check the digital signatures, calculate hashes, and retrieve resources information (such as the publisher name) for any executable files determined to be persistent. This can significantly reduce the level of effort required to identify malicious auto-runs. However, note that AutoRuns can only run on a live system—you cannot use it to analyze “dead” acquired registry hives or forensic images obtained from another source.
Mandiant’s Redline live response utility includes several audit modules, available when building a collector script, that can examine and parse the registry. The Registry module simply produces a flat table of every key, value, and data, along with the respective Last Modified times of each key. The Services module combines service information from the Service Control Manager, registry, and file system—this allows you to check the MD5 hashes and digital signatures for a given service’s binaries, review its running state and process ID, and examine other attributes such as description and name. Finally, the Persistence module operates in a similar manner as the SysInternals AutoRuns utility. It identifies numerous auto-run registry keys (as well as some other non-registry-based persistence mechanisms), examines the supporting binaries to which they point, and provides metadata such as file timestamps, hashes, and digital signature information. Note that all three of these collector modules can only run against a live, running system—they cannot parse data from a “dead” acquired registry hive. Also note that aside from services and auto-runs, Redline does not natively decode any other types of registry keys.
Throughout our discussion of the registry in this chapter, we’ve referenced a number of standalone, single-purpose utilities. In many cases, these tools may do a better job of parsing the types of values for which they’re designed—or at least provide more input and output options than the all-in-one tools. In the following list, we include the previously cited utilities and suggest a few others:
• ShimCacheParser github.com/mandiant/ShimCacheParser
A Python script designed to parse the Shim Cache (also known as the Application Compatibility Cache). The script can accept multiple inputs, including “dead” or acquired registry hives, a system’s own local hives, the binary key/value data, and Mandiant Intelligent Response and Redline Collector output formats.
• shellbags.py github.com/williballenthin/shellbags
A Python script designed to parse shellbag artifacts of interactive Explorer usage. Only processes “dead” and acquired registry hives.
An alternative shellbag-parsing utility. Note that as of this writing, TZWorks utilities are licensed for noncommercial, personal use only.
• UserAssist, by Didier Stevens blog.didierstevens.com/2012/07/19/userassist-windows-2000-thru-windows-8/
A utility for parsing the UserAssist registry key from a user hive.
Nirsoft provides a large suite of free-to-use forensics tools. Their registry utilities include parsers for the MUICache, ShellBags, and UserAssist keys as well as Internet Explorer COM objects. Note that these utilities only run on Windows, and only can display information from the current system’s registry hives—they cannot parse “dead” or acquired hives.
OTHER ARTIFACTS OF INTERACTIVE SESSIONS
In the “Event Logs” section of this chapter, we introduced the different ways a user can log on to a Windows system and the accompanying “logon type” codes recorded by the Security event log. We categorized several types of access as “interactive”—that is, utilizing the Windows Explorer GUI, rather than being restricted to the command line. Although “Interactive” specifically refers to a specific logon type (2) when the user is at the console, for the purposes of this chapter we also use the term to encompass Remote Desktop sessions (logon type 10) and screen sharing (such as via VNC or similar software).
“The Windows Registry” section of this chapter also included a subsection titled “User Hive Registry Keys,” detailing many of the keys that are created and modified when a user interactively logs on to a system. These keys help maintain the “state” of a user’s profile upon subsequent logins. However, these artifacts of interactive access are not just limited to the registry. Windows also maintains a number of file system artifacts—once again, typically associated with a specific user profile or SID—that support various operating system functions. If an attacker gains interactive access to a system, we can use these artifacts to build a more complete picture of their activity.
In this section, we will highlight three file system artifacts that are exclusively generated through interactive activity: LNK files, Jump Lists, and the Recycle Bin.
LNK Files
Windows shortcut files, also known as “link files” due to their extension (.lnk), act as pointers to other files or folders on a system. Link files differ from symbolic links insofar as they only serve as extensions for Windows Explorer, whereas a symbolic link can be transparently acted upon as if it were its target file by any program.
Several common scenarios can lead to the creation of link files. A user may explicitly choose to create a link by selecting a file in Explorer and choosing the Create Shortcut option in the right-click context menu. This will generate a link file named “[original filename] – Shortcut.lnk” within the same directory. Windows can automatically generate links, stored within the acting user’s profile directory, whenever a file is opened via Explorer. This supports the Recent Files functionality offered by the operating system. Finally, Microsoft Office generates its own set of link files for Recent Documents within each user profile, reflecting anything opened by its own suite of applications.
The Evidence
Link files will always have the extension .lnk. They may reside in the following directories:
Windows Vista, 7, and 2008
• C:Documents and Settings\%USERNAME%Recent
• C:Documents and Settings\%USERNAME%Application DataMicrosoftOfficeRecent
Windows XP and 2000:
• C:Users\%USERNAME%AppDataRoamingMicrosoftWindowsRecent
• C:Users\%USERNAME%AppDataRoamingMicrosoftOfficeRecent
Analysis
Link files are more than “dumb” references to another file on disk—they contain a significant amount of useful forensic evidence. Each link file contains the following metadata for the target file to which it points:
• Full file path (at the time the link was created)
• Network share name (if target file originated from such a source)
• Serial number for the source volume
• Attributes and logical size
• Standard Information Modified, Accessed, and Created timestamps for the referenced file at the time it was last opened
• A unique object identifier (ObjectID), also stored in the target file’s MFT record and used by the Distributed Link Tracking service
This metadata can provide valuable insight into a user’s (or attacker’s) behavior during an interactive session—especially when combined with other sources of evidence and timeline data. For example, in a recent intrusion scenario, the attacker accessed a compromised server via remote desktop and used Internet Explorer to access the company’s intranet portal. Over the course of several hours, the attacker downloaded and examined various Word and Excel documents originating from the website. Each opened file resulted in the creation of a corresponding link file that served as a useful “black box” of activity—recording what the attacker was viewing, when the downloaded files were both created and opened, and where the files were temporarily staged on the file system. These link files remained on the system despite the fact that the attacker went through the effort of clearing web browser history and deleting the copied/downloaded files before logging out.
Although LNK files contain human-readable strings and can be examined in a hex editor, we recommend using tools designed to recognize their format and provide decoded output. Several commercial forensics toolkits, including AccessData FTK and Guidance’s EnCase, can now process and interpret link files. Free tools that facilitate link file analysis include the following:
GO GET IT ON THE WEB
TZWorks “lp” tzworks.net/prototype_page.php?proto_id=11
Simple File Parser code.google.com/p/simple-file-parser/
Jump Lists
Windows 7 added Jump Lists as a new taskbar navigation feature. Right-clicking a taskbar icon produces a pop-up menu that can include recently accessed items, frequently accessed items, and application-specific actions. As an example, Microsoft Outlook provides shortcuts to create new e-mails, appointments, tasks, and contacts within its jump list; Microsoft Word provides a list of recently opened files. These are examples of “automatic destination” jump lists—they are automatically populated by the operating system and application in question. Certain programs let users “pin” recently opened items to their jump lists, which ensures that they persist in the menu—these are examples of “custom destination” jump lists.
Figure 12-27 displays the output of JumpLister, a tool we cover later in this section that can parse jump list evidence. Note that it has identified two Word documents within the application’s jump list file: Secrets.docx and More Secrets.docx.

The Evidence
Jump list data is stored in files with the extensions .automaticDestinations-ms and.customDestinations-ms in the following directories:
• C:Users\%USERNAME%AppDataRoamingMicrosoftWindowsRecentAutomaticDestinations
• C:Users\%USERNAME%AppDataRoamingMicrosoftWindowsRecentCustomDestinations
Up to the first 16 characters of a jump list file name correspond to an Application Identifier. Because most of these identifiers are calculated by the operating system, they remain consistent across systems. Forensics Wiki maintains a useful listing of IDs for common applications at www.forensicswiki.org/wiki/List_of_Jump_List_IDs.
Analysis
Jump lists can serve as another useful source of Most Recently Used (MRU) activity for users who have interactively logged on to a system. During incident response investigations, we can often recover traces of recently accessed directories from the Windows Explorer jump list. The Remote Desktop jump list provides a list of recent connections, which can be invaluable when attempting to construct a history of attempted lateral movement from a known-compromised system. Reviewing jump lists for productivity applications such as the Microsoft Office suite (or even Notepad) may provide evidence of files that were opened and viewed during a period of attacker activity. Such evidence can be compared with (or supplement gaps in) additional sources such as shellbags, MRU registry keys, and LNK files.
Documenting the structure of jump list files is beyond the scope of this chapter; however, several useful free tools are capable of parsing and decoding them, including the following:
GO GET IT ON THE WEB
JumpLister, by WoanWare www.woanware.co.uk/forensics/jumplister.html
JumpListParser (jmp), by TZWorks tzworks.net/prototype_page.php?proto_id=20
The Recycle Bin
The Recycle Bin is a temporary storage location for files that a user has deleted through Windows Explorer. First introduced in Windows 95, it allows users to change their mind and restore “deleted” files before they are truly deleted from disk. However, users can bypass the Recycle Bin by holding the shift key while pressing del—this will immediately delete the selected files. Because the Recycle Bin is simply a set of directories with specific permissions and privileges, it is trivial for a forensic analyst to recover and reconstruct its contents.
The Evidence
NTFS file systems contain one Recycle Bin per volume in the following default paths:
• Windows XP and Server 2003 Recycler
• Windows Vista, 7, and Server 2008 $Recycle.Bin
Windows does not enable Recycle Bin functionality for devices classified as removable storage—this includes memory cards and USB flash memory drives. External hard drives will, however, retain their own Recycle Bin in the directories listed (as long as they’re formatted as NTFS).
The structure of the Recycle Bin changed significantly in Windows Vista and later versions, but several characteristics remain consistent across all versions of Windows. Both Recycler and $Recycle.Bin are hidden directories, and each is organized into subdirectories for each account SID that has used the Recycle Bin. NTFS permissions applied to these directories can restrict users from being able to view one another’s “deleted” files. When users view the contents of the Recycle Bin via Explorer or its desktop icon, they’re actually viewing the contents of the subdirectory associated with their SID rather than the root path. Figure 12-28 illustrates a comparison of how the Recycle Bin paths and naming conventions differ between versions of Windows.
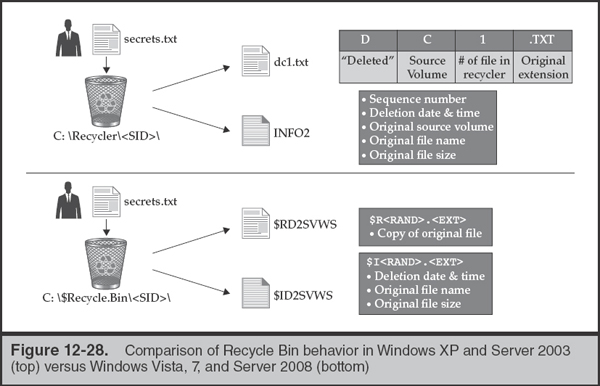
In order to analyze evidence from the Recycle Bin, it’s important to understand the process that Windows follows when a file is “deleted” and placed into it. We cover the different artifacts and metadata available between the Recycle Bin in Windows XP and Server 2003, versus its current implementation in Windows Vista and later versions. Finally, we touch on how attackers can use the Recycle Bin as a staging directory, and provide a brief list of recommended tools you can use to analyze Recycle Bin artifacts.
Analysis of Recycler When a file is placed into the Recycle Bin, Windows renames it using the following convention:
• D is a fixed character and will always be present.
• <DriveLetter> refers to the volume from which the file was deleted.
• <Index#> references a count of the number of deleted files currently tracked by the Recycle Bin. This value increments with each deleted file or folder, and is cleared when the Recycle Bin is emptied and the system rebooted.
• <FileExtension> matches the original extension of the file.
For example, say that user Bob clears the Recycle Bin on his Windows XP system, reboots, and deletes C:haxTracerT.txt. The file would be renamed and moved to C:Recycler[Bob’s SID]DC1.txt—with C referring to the source volume name, 1 referring to the index, and .txt referring to the file’s original extension. If Bob subsequently deletes C: ools
map.exe, the file would be moved to C:Recycler<Bob’s SID>DC2.exe.
So how does Windows know how to rename and restore a file from the Recycle Bin to its original location? Each time a new file is added to the Recycle Bin, its associated metadata is stored in a hidden file named Recycler<SID>INFO2. The INFO2 file tracks the following information for each file currently stored in the Recycle Bin:
• Physical (not logical) file size
• Date and time of deletion (stored in UTC)
• Original file name and path
You therefore can quickly obtain an overview of any user’s Recycle Bin contents on a given NTFS volume by acquiring and parsing their respective INFO2 file. Later in this section, we cover a few tools designed to help you do so.
Finally, what happens if a user places a directory that contains other files into the Recycle Bin? Windows will create a directory named Recycler<SID> DC#, where # is the current Recycle Bin index value. The original directory’s contents will be moved into this new path, but will retain their original file names and will not be tracked in the INFO2 file. Continuing our previous example, if Bob decides to recycle C:secrets and it contains MyPasswords.xlsx, Windows would create Recycler<Bob’s SID>DC3MyPasswords.xlsx.
Analysis of $Recycle.Bin The Recycle Bin in Vista uses some different directory paths and naming conventions, but is otherwise largely similar to the implementation in prior versions of Windows. The operating system creates two files each time a file is placed in the Recycle Bin:
• $Recycle.Bin<SID>$I<ID_STRING>.<FileExtension>
• $Recycle.Bin<SID>$R<ID_STRING>.<FileExtension>
The $I and $R files come in matching pairs, each with an identical <ID_STRING> in their file names. This string is a six-character identifier generated for each file placed in the Recycle Bin. As you might expect, <FileExtension> represents the “deleted” file’s original extension.
The $R file is a renamed copy of the “deleted” file, similar to the DC# scheme used in earlier versions of Windows. The $I file takes the place of INFO2 as the source of accompanying metadata: it contains the original name, path, and date and time deleted for its associated $R file. Behavior when dealing with deleted directories also remains similar: if $R represents a deleted folder, the files contained within this path retain their original names.
Anomalous Usage of the Recycle Bins Attackers often store malware, utilities, and stolen data in the root of the Recycle Bin (Recycler or $Recycle.Bin). Keep in mind that the Recycle Bin is a hidden directory and that Windows Explorer always directs users to the subdirectory within the Recycle Bin that is specific to their SID. The root directory should never contain any files (aside from desktop.ini), but most users would never bother going through the effort of checking its contents, making it a great hiding spot.
During incident response investigations, we’ll often proactively examine the contents of the root Recycler and $Recycle.Bin directories—either on an individual system or at scale throughout an environment. Any persistence mechanism pointing to an executable file or library within the Recycle Bin should also be considered suspicious. However, note that some poorly written applications may also leave benign but malicious-looking artifacts in the Recycle Bin. We’ve seen a few instances where programs moved files directly into C:Recycler in a misguided attempt to delete them.
Recycle Bin Analysis Tools There aren’t many single-purpose tools dedicated to parsing Recycle Bin artifacts; fortunately, one effective tool is all you need. We typically rely on rifiuti2 (code.google.com/p/rifiuti2/). It is an excellent open source utility capable of parsing Recycle Bin INFO2 and $I files alike. And if you’re using commercial tools, both EnCase and FTK can interpret the metadata in these files.
MEMORY FORENSICS
Throughout this chapter, we’ve focused on sources of evidence that are nonvolatile—that is, they can be recovered from both a dead disk image as well as from a live, booted system. However, Windows also maintains a number of important artifacts that can only be recovered while a system is powered on. These volatile sources of evidence are stored in memory rather than on disk, and although many of them are accessible via the Windows API, directly parsing and reconstructing the contents of memory yields the most reliable, tamper-resistant results.
What kinds of evidence can you obtain from memory? The list is extensive and ever-growing as memory forensics toolkits continue to evolve, but it includes the following:
• Running processes and the system objects/resources with which they interact
• Active network connections
• Loaded drivers
• User credentials (which may be hashed, obfuscated, or even appear in clear text)
• Portions of nonvolatile sources of evidence such as the registry, event log, and Master File Table
• Remnants of previously executed console commands
• Important data structures within the kernel that provide insight into process accounting, behavior, and execution
Like NTFS or the Windows registry, memory forensics is another complex topic that could easily span the contents of an entire book. In this section, we first go over the fundamental components that make up “memory” and what you need to collect in order to perform analysis. We then explore a few of the artifacts you can decode out of memory, such as running processes, handles, and memory sections. Finally, we touch on a few sophisticated malware techniques, such as process injection, that can only be effectively analyzed through memory forensics.
The Evidence
Like most modern operating systems, Windows provides a virtual memory subsystem that can use both RAM and hard disk space together as a single source of “memory” for running processes. “Memory” on a Windows system therefore is composed of two fundamental components: physical memory and the pagefile. We therefore begin by discussing the structure and acquisition process for each of these important sources of evidence. We also cover two additional memory-related sources of evidence—crash dumps and the hibernation file—that you’ll likely encounter when analyzing Windows systems.
Physical Memory
The term “physical memory” simply refers to the contents of RAM. We acquire the contents of physical memory by taking an image of it—similar in principle (although much different in execution) to an image of a hard drive. If you have 4GB of RAM installed on your system, an image of physical memory will be exactly 4GB.
In most cases, you’ll use software-based tools to acquire memory from a Windows system, in much the same way you’d collect live response data or other forensic evidence. Most memory forensics software can run in portable mode (that is, on a USB drive) or over the network via some sort of previously installed agent software. Some forensic toolkits will also let you acquire physical memory from a target system while connected to a Firewire (IEEE 1394) port, due to the direct memory access provided by this interface. However, as of this writing, Firewire ports are increasingly uncommon on most modern Windows hardware.
So you’ve got a memory image—now what? Ten years ago, the state-of-the-art method was to run “strings” against it, do some searches, and hope for the best.
Fortunately, memory forensics has come a long way in the last decade. Tools such as the Volatility Framework and Redline can analyze an acquired memory image, recognize the intrinsic structures associated with user-land processes and the kernel, and parse them into human-readable format. Figure 12-29 depicts this workflow at a high level. This allows us to review many of the artifacts, such as detailed process listings and the objects loaded by each process, that we alluded to in this section’s introduction. In the upcoming “Analysis” subsection, we explain how you can review these parsed structures, as well as the tools and utilities we recommend using to do so.

The Pagefile
The pagefile is a key component of memory architecture in most modern operating systems. It provides a secondary storage location, typically residing on a slower fixed drive, for data used by running processes that cannot fit within physical memory. Fortunately for application developers, this is all handled behind the scenes by the kernel’s memory management routines. Each running process within user-land is allocated a virtual memory space (effectively a range of memory addresses) that it can use on its own. The kernel maintains a table that tracks where each “page” in virtual memory actually resides—either at a real memory address or within the page file—and shuttles data back and forth as needed. As available RAM dwindles, this “paging” activity occurs more frequently, to the detriment of system performance. Pagefile usage is not solely limited to user-land applications: a portion of the kernel’s virtual memory can also be paged in and out of physical RAM. Figure 12-30 provides a very high-level overview of the relationship among virtual memory, the pagefile, and physical memory. Note that for a given process, data within its virtual memory space may reside in noncontiguous regions throughout the pagefile or physical memory.

Windows stores the pagefile at %SYSTEMDRIVE%pagefile.sys by default, but its name and location can be changed to any volume and even to be split across multiple files. If it’s missing, refer to registry key and value HKLMSYSTEMCurrentControlSetControlSession ManagerMemory ManagementPagingFiles to determine if another path is specified.
The pagefile has the Hidden attribute set and is further protected by the operating system on a running system. If you attempt to copy it using Windows Explorer or the command shell, you’ll get an Access Denied error. You’ll need to use a forensic utility capable of raw disk access to acquire and copy this file from a running system.
Crash Dumps
In the event of a system crash, Windows can automatically generate “crash dump” files that contain some or all of the contents of memory. These files can serve as a sort of black box to help developers debug and troubleshoot the conditions that led to the crash. In some cases, we’ve found that poorly developed malware—particularly device drivers—will cause system instability and result in the creation of these artifacts.
Windows can record three different levels of crash dump data. These settings are exposed to users via the Advanced System Settings control panel shortcut, and selecting Settings under Startup and Recovery. They also can be adjusted through the registry, as detailed here:
• Kernel Memory Dump This is the default setting for Windows Vista, 7, Server 2008, and later. It contains all the kernel’s read/write memory pages at the time of the crash, as well a list of processes and loaded drivers. The size of this file will vary based on the amount of memory on the system, but is typically in the tens to hundreds of megabytes.
• Small Memory Dump (aka Minidump) Contains a limited set of data, including the currently loaded drivers, processor context, kernel call stack, and metadata for the halted process and thread. These files are usually under 5MB in size. Minidump files are stored in %SYSTEMROOT%Minidump by default; this path can be changed by modifying the registry value HKLMSYSTEMCurrentControlSetControlCrashControlMinidumpDir.
• Complete memory dump Contains a full image of physical memory. These files will be the same size as the amount of physical memory installed on the system. Users cannot select this option through the Startup and Recovery UI, but can manually enable it by setting the registry value HKLMSYSTEMCurrentControlSetControlCrashControlCrashDumpEnabled to 1. Complete memory dumps are saved to %SYSTEMROOT%memory.dmp by default; this path can be changed by modifying the registry value HKLMSYSTEMCurrentControlSetControlCrashControlDumpFile.
Beginning in Windows Vista and Server 2008, the Windows Error Reporting (WER) feature can store crash dumps resulting from user-mode applications. These dump files are stored in %LOCALAPPDATA%CrashDumps and can be configured via the registry key HKLMSOFTWAREMicrosoftWindowsWindows Error ReportingLocalDumps. |
Full-memory crash dumps are rarely enabled—but if you encounter one, you’re in luck. Memory analysis tools such as the Volatility Framework and Moonsols Windows Memory Toolkit can readily parse these dumps as if they were any other acquired image of memory. On the other hand, your options and available data are more limited when dealing with kernel or minidump files. Software developers and malware reverse engineers typically review these files using the Windows native debugger, WinDbg.
Hibernation Files
Microsoft implemented the system hibernation feature, beginning in Windows 98, to allow users to preserve the state of a running system while drawing almost no power. The hibernation feature works by first saving the full contents of physical memory to a file on disk, and subsequently powering-down the system. Upon powering up, Windows reads the contents of the hibernation file and writes it back to memory, resulting in a restored and intact user session. The default path of the hibernation file is %SYSTEMDRIVE%Hiberfil.sys.
If that process sounds like memory imaging, you’re right! However, the hibernation file isn’t the same as a raw, bit-for-bit image of physical memory—it is compressed and includes some additional metadata. As a result, if you acquire the hibernation file from a system of interest, you’ll need to convert it to a format readable by other memory forensics tools. The Volatility’s Framework’s imagecopy plugin can be used to parse hibernation files into a standard memory image.
Memory Analysis
Now that we’ve covered the sources of memory evidence on a Windows system, let’s delve into analysis. We’ll focus on some of the fundamental building blocks of memory analysis, and then touch on a few memory-resident attack techniques exploited by malware authors.
Processes
Simply put, a process listing tells you “what’s running” on a system. If you’ve ever used the Windows Task Manager, or the SysInternals Process Explorer and pslist tools, you’ve viewed process listings as obtained via the Windows API. Through memory analysis, we can reconstruct the same sort of data by enumerating kernel data structures, known as Executive Process (EPROCESS) blocks, that account for each running process on a system. If an attacker has used rootkit techniques, such as hooking or kernel object manipulation, to hide a process from common Windows API functions, reconstructing the list of running processes in this manner can ensure that we get an untainted view of the evidence.
Memory forensics tools will typically extract the following information from walking the list of EPROCESS blocks in kernel memory:
• Process ID (PID) A unique numeric identifier assigned upon process startup
• Parent PID The ID of the process that was responsible for executing the current process
• Process name The executable file’s name
• Process path The fully qualified path to the executable file
• Process command line Any argument parameters supplied in the executable’s command line
• Process start and exit times If applicable
• Number of threads and handles
Figure 12-31 shows a typical output from the Volatility Framework’s pslist plugin. By combining data in the EPROCESS blocks with other sources of evidence in the kernel, it is also possible to reconstruct the SID or username under which a given process is running. You can read more about this technique in the following blog post:

GO GET IT ON THE WEB
Note that processes only track their parent PID and not the parent process name or path. It’s up to your analysis tool to walk through all PIDs and map out the parent-child relationships into a hierarchy or tree. This is also why it is not possible to identify a running process’s parent once it has terminated—the parent PID won’t map back to anything that’s currently running.
Handles
If you’ve done any software development, you may recall that handles serve as an abstraction layer through which user-mode applications can obtain indirect access to Windows objects (such as files, registry keys, security tokens, threads, and so on). Whenever an application issues Windows API call to interact with an object—say, by opening a file—the kernel’s Object Manager brokers and tracks the access. Each running process has a handle table, maintained in kernel memory, tracking all the handles it currently owns. By walking the contents of this table, we can identify each handle, its type, and the corresponding object.
The popular SysInternals suite of utilities for Windows includes a simple application called “handle” that can list open handles for all running processes. It’s fast and doesn’t have any dependencies aside from needing to run from an Administrator command shell. The SysInternals Process Explorer application also provides the ability to list handles from a live system. However, note that both tools rely on the Windows API rather than carving the handle tables out of raw memory. |
Reviewing handles can provide detailed insight into a running program’s behavior: the files it’s reading from or writing to, the registry keys it accesses or sets, the devices to which it communicates, and so on. This can be invaluable when trying to determine if a suspicious running process is legitimate or malicious. In Figure 12-32, Redline utility illustrates an example of handles from a system infected with Zeus. Note that the file handles from “winlogon.exe” to “sdra64.exe” and “local.ds” are distinctive artifacts of the malware.
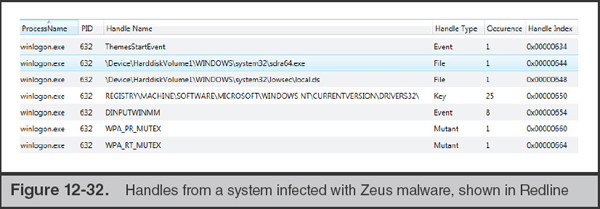
Of course, keep in mind that an application does not need to continuously maintain an open handle to a resource that it uses. A keystroke logger, for example, might buffer captured keystrokes in memory and only periodically flush them out to a file. Like with other volatile sources of evidence, consider a handle’s listing a point-in-time perspective of an executable file’s behavior.
One type of handle that frequently comes up when examining malware is to an object known as a “mutant” (a “mutex” or “mutual exclusion” object). A mutex is similar to a reservation—if you reserve something, no one else can use it until you are done. Applications create mutants in memory to help synchronize and coordinate access to shared resources. Multi threaded programs will often create a named mutant and open a handle to it to indicate that a particular resource is locked. Other threads attempting to access the same resource would first attempt to open a handle to the same mutex, and wait until it is released before proceeding. Named mutants are typically simple strings.
Malicious code—particularly botnets and other forms of mass-malware—sometimes set and check named mutants to avoid infecting a system multiple times (or to check if its code is out of date). For example, early versions of Zeus would create a mutant named_AVIRA_2109 during installation and terminate if it was already present. The infamous Poison Ivy backdoor kit uses a default mutant named “)!VoqA.I4” if not configured otherwise. Many antivirus signatures include these static mutants because they’re an easy way to detect known malware. Memory analysis tools such as Redline and Volatility Framework also make it easy to list all handles to named mutants and identify those that are known to be malicious. As a countermeasure for such security and investigative techniques, many malware samples now programmatically generate mutant names rather than relying on fixed values. Figure 12-33 illustrates a handle to the default Poison Ivy mutant “)!VoqA.I4” from malicious process “WINDOWS:wins.exe”, as shown in Redline. Note that “wins.exe” is running as an ADS to the “C:WINDOWS” directory in this example.
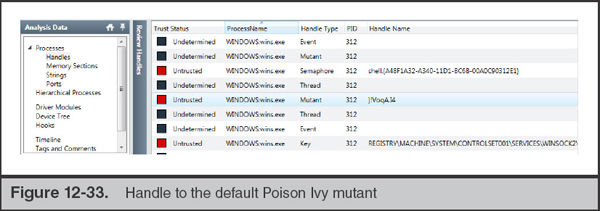
Sections
Each process in memory has its own virtual address space—essentially a range of addresses, allocated by the memory manager, that it can use to read/write data and execute code. Recall that we label this address space as “virtual” because any given portion of it may reside in physical memory or be paged out to disk. From a process’s perspective, it doesn’t know or care which is which—it’s just a contiguous series of addresses. The operating system ensures that data is swapped in and out of physical memory and that any requested memory page is available upon request.
Memory forensics allows us to examine a process’s memory space and determine what is loaded into each region or section. We can do so by making use of another kernel data structure maintained by the memory manager: the Virtual Address Descriptor (VAD) tree. Conveniently, one of the member variables within a process’s EPROCESS structure is a pointer to the root node of its VAD tree. By navigating the nodes of this binary tree, we can identify each section of memory within a process’s address space. A section may be mapped to a file or a loaded DLL (such as via the Windows Process Loader), or it can represent dynamic content such as heap or stack space. The VAD nodes can also indicate the security protections in place for a given section—such as whether it is marked read-only, is writeable, can be executed, and so on. For a more comprehensive explanation, refer to “The VAD Tree: A process-eye view of physical memory,” by Dolan-Gavitt:
GO GET IT ON THE WEB
Figure 12-34 displays a listing of memory sections for a process shown in Redline. How might this be useful? For example, section analysis can allow you to identify all the DLLs loaded by a running process in memory. Through review of these DLLs and their imported functionality, you can draw some preliminary conclusions about an executable’s capabilities. Similarly, you could review file metadata on disk for each DLL found to be loaded in memory, and check for valid digital signatures, known-good (or malicious) hash checksums, and so on, in order to find rogue loaded DLLs. Many memory forensics tools can utilize the detail gleaned from section analysis to extract or dump the contents of specific sections, allowing you to recover portions of mapped files, DLLs, or executables from a memory acquisition. Finally, section analysis can help you identify evidence of process-tampering attacks, whereby malware attempts to surreptitiously load a DLL or run code in memory. We’ll discuss some of those techniques in more detail shortly.
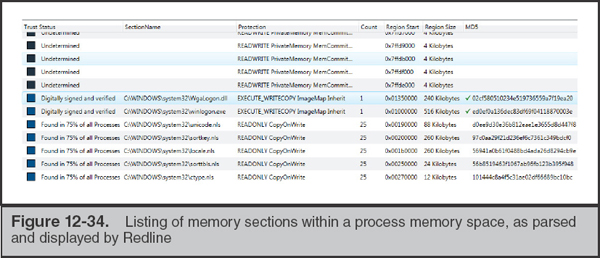
Other Memory Artifacts
As we mentioned at the beginning of this section, the list of artifacts that can be recovered from memory continues to grow as analysts reverse-engineer new structures and forensics tools gain new features. A few additional sources of evidence that we often find useful during our investigations include the following:
• Network connections It is possible to reconstruct active and recently closed network connections through memory analysis—similar evidence as provided by the netstat command-line utility. This data can include the process name, source and destination IP and port, connection state, and socket creation time.
• Loaded drivers Memory forensics tools can enumerate the kernel structures used to track loaded drivers. By design, a malicious driver runs with elevated privileges and access to low-level components of the operating system, which may allow it to subvert your forensic processes—especially those that rely on the Windows API. As a result, it is often important to review loaded drivers for evidence of rogue entries.
• Console command history Several Windows processes retain a history of commands executed via the console (for example, through an instance of the cmd.exe shell). This can be a useful source of evidence if you can acquire memory shortly after an attacker has executed console commands. On versions of Windows prior to Vista, such evidence could be found within the memory space of the Client Server Runtime System (csrss.exe). In Vista and later versions, it can be found within the memory space of the console host process (conhost.exe). The Volatility Framework includes two plugins (consoles and cmdscan) designed to parse and recover this evidence.
• Strings in memory This technique is simple yet often effective during initial triage—most forensics tools will let you search acquired memory for byte sequences or strings. We’ll often use this technique to quickly find processes associated with some sort of “known-bad” that led us to a system. For example, if you know a system is calling out to www.evil.org, it may be worth searching for that string across all running processes’ memory space if you can’t find the malware. If you get a hit, that process and the resources it has loaded (such as DLLs) might warrant further inspection. Of course, there’s no guarantee your search term will be in memory in a clear-text/unobfuscated state at the time of analysis, but it’s always worth a try.
• Credentials The Mimikatz toolkit can recover Windows account passwords, both hashes and clear text, by reading and parsing the contents of the Local Security Authority Subsystem Service (LSASS) memory, commonly running as lsass.exe.
GO GET IT ON THE WEB
Pagefile Analysis
How do you analyze an acquired pagefile.sys? Unfortunately, the pagefile has no intrinsic structure, which significantly limits your available analysis techniques. The most common approach is to run “strings” against the file and search its contents for keywords of interest. Certain search techniques, such as looking for references to cmd. exe or other remnants of command shell usage, are often a good start—but you typically will get the most out of a pagefile after you already have some good leads.
Be careful about drawing incorrect conclusions based solely on evidence of “anomalies” in the pagefile. It’s not unusual to find remnants of signatures for antivirus and host-based intrusion prevention systems in pagefile “strings” output. This may include suspicious IP addresses, domain names, and malware file names that never actually existed on the system you’re analyzing. |
Although it’s not the default behavior, Windows can be configured to clear the contents of the page file upon shutdown. Check the registry value HKLMSYSTEMCurrentControlSetControlSession ManagerMemory ManagementClearPageFileAtShutdown. If it’s set to 1, this option is enabled.
Analyzing Common In-Memory Attacks
Numerous attack techniques rely on manipulating user-land process memory, or structures within kernel memory, to hide malware and evade forensic analysis. We’ll briefly discuss two of the most common techniques we see in the wild: process injection and hooking.
Process Injection In process injection, a malicious injecting process causes a legitimate process (the injected) to load and execute the code of its choice. Once this occurs successfully, the injecting process can terminate and allow the injected process to continue running its malicious code as designed. Because this is purely an in-memory attack, the executable corresponding to the injected process on disk remains unchanged. Moreover, the injected process typically will not contain any evidence indicating which process was responsible for the injection. As you can imagine, this can be difficult to investigate.
An attacker can leverage and abuse a variety of APIs and mechanisms built into Windows to conduct injection attacks, so long as they have the necessary privileges (typically running as Administrator or SYSTEM). There are multiple forms of process injection, ranging from forcing a targeted process to load a malicious DLL from disk, to directly writing malicious code to a target process’s memory and invoking a remote thread to execute it. And in a related technique called process replacement, malware can launch a legitimate executable in a suspended state and subsequently overwrite its process memory with that of malicious code, ultimately causing it to execute once unsuspended.
Fortunately, memory analysis can be an effective approach to identifying evidence of process injection. Many common types of injection techniques result in anomalies in a process memory space that can be programmatically detected. For example, the dlllist plugin for the Volatility Framework can identify DLLs loaded by a process via the basic CreateRemoteThread and LoadLibrary technique, and the malfind plugin can identify evidence of more advanced forms of injection. Similarly, Redline can optionally detect and flag memory sections that show signs of basic process injection. Figure 12-35 shows an example of a memory section marked as “Injected” by Redline.
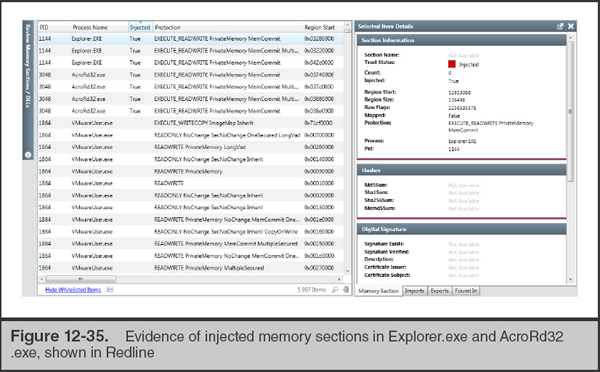
There’s one other way to identify evidence of process injection: find the injecting malware and how it runs on a system. If an attacker wishes to ensure that the injected malicious code survives user logout or system reboot, the injecting malware must maintain persistence. That means you can use all the techniques we describe in this chapter, such as analysis of auto-run keys, DLL load-order hijacking, and so on, to identify persistent malware that performs process injection. The injecting component may no longer be running at the time of analysis—but if you’ve identified the associated persistence mechanism and recovered the file, it doesn’t matter. For example, the Poison Ivy backdoor can use process injection to run its code in an invisible spawned instance of the user’s default web browser. However, the launcher that performs the injection upon each reboot maintains persistence via common Active Setup auto-run registry keys, and can be easily identified.
Hooking Broadly speaking, “hooking” allows code within running processes to intercept, view, and modify events such as function calls and the data they return. The Windows operating system provides many API mechanisms by which processes can hook common events and be notified when they occur. Plenty of legitimate applications (including antivirus, host-based intrusion prevention systems, and application inventory software) use hooks to support their functionality. Of course, malware authors can exploit these same mechanisms, or use more covert techniques, to insert malicious code into the messaging flow of function calls issued by legitimate applications. Rootkits often use hooking to hide files, processes, registry keys, or network connections from a user or forensic investigator. Fortunately, we can find evidence of malicious hooks through memory analysis.
Old-school keystroke loggers used one of two Windows API functions to intercept keyboard input. One method used hooking: by calling SetWindowsHookEx with the appropriate parameters, an attacker could set a function within a malicious DLL to be called whenever a keyboard event occurred. Another method used polling functions, such as GetAsyncKeyState, to constantly check the up/down state of keys and determine which have been pressed. |
Malware can implement hooks in user-land, on a per-process basis, by manipulating the tables that processes maintain to track the addresses of functions imported from other DLLs—Import Address Table (IAT) hooking is one such example. On some versions of Windows, it’s also possible to hook the kernel data structures, such as the Interrupt Descriptor Table (IDT) and System Service Dispatch Table (SSDT), that are used to handle low-level system calls. Beginning with 64-bit versions of Windows XP and Server 2003 SP1, Windows added a security feature known as Kernel Patch Protection (KPP, also known as PatchGuard) to prevent such kernel tampering attacks. Attackers have found ways around these protection mechanisms, but in practice it remains easier to implement user-land hooks on modern versions of Windows.
Many memory forensics tools can help you recognize telltale signs of user-land or kernel hooks. For example, Memoryze and Redline feature analysis options that can identify untrusted kernel hooks in the SSDT and IDT. Volatility Framework also provides a plugin called apihooks that can identify IAT hooks, inline hooks, and other techniques in both user-land and the kernel. Figure 12-36 displays an example of the output of apihooks for a system infected with Zeus. It shows an inline hook to the HttpSendRequestA function imported from WinInet.dll within the process space of lsass.exe.

The following lists summarize our favorite memory analysis tools and their capabilities. We’ve already mentioned several of these throughout this chapter. Pay extra care to test and evaluate any software you use for memory acquisition in a production environment: the methods utilized by these tools are often undocumented and reverse-engineered. Major version updates to operating systems, and even service packs in certain cases, can often break these tools if not yet supported—at best, you’ll get an application error message; at worst, you may blue-screen your target system.
Acquisition Tools We typically turn to one of the following free tools when we need to capture memory from a Windows system:
• FTK Imager by AccessData www.accessdata.com/support/product-downloads
• DumpIt by MoonSols www.moonsols.com/resources/
• Memoryze and Redline by Mandiant www.mandiant.com/resources/download/memoryze
Analysis Tools The following free tools can analyze and reconstruct the contents of an acquired memory image, as well as help you identify indicators of malicious activity within process or kernel memory space.
• Memoryze and Redline, by Mandiant
These free tools from Mandiant can perform both memory acquisition as well as analysis. Memoryze is exclusively a console application and is intended for more experienced users. Redline uses the same backend engine, but provides a graphical frontend whereby users can generate a memory collector, import an acquired memory image, and review its contents (as well as a variety of other live response evidence from the file system, registry, and event logs). Both tools can parse running processes, handles, memory sections, loaded drivers, and network connections from a memory image. If Memoryze or Redline is used to acquire memory, it can also incorporate information from the file system, such as digital signatures and hashes of PE files loaded in memory, to help analysts identify suspicious binaries.
• Volatility Framework, by Volatile Systems
Volatility is a popular open source memory forensics framework that is best known for its extensive collection of community-developed plugins. The toolkit is developed in Python but is also distributed as a packaged executable file. As a console-only application with an extensive set of commands and arguments, Volatility can have a steeper learning curve than UI-based tools. However, its plugins also give it an extremely broad set of analytical capabilities beyond basic memory parsing—everything from extracting registry hives in memory to detecting multiple forms of hooking and process injection as well as scanning for Yara signatures and byte sequences.
ALTERNATIVE PERSISTENCE MECHANISMS
In “The Windows Registry” section of this chapter, we introduced the term “persistence mechanisms” (also commonly referred to as “auto-runs”). This refers to a broad category of registry keys, file paths, and other Windows components that automatically load and run executable code—typically upon system boot or user login. Attackers often take advantage of legitimate (as well as undocumented) persistence mechanisms to ensure that backdoors, rootkits, and other malicious code keep running on a compromised system.
The vast majority of malicious software—both targeted and commodity threats—use registry-based mechanisms for persistence. As you learned earlier in this chapter, the sheer number of registry keys that support persistence make it easy for malware to hide in plain sight, all while using stable operating system features to ensure that they can survive a user logout or reboot. Fortunately, many of these keys are now well documented, and we highlighted several tools and techniques that you can use to identify and analyze them.
However, the registry isn’t the only source of auto-runs. (If only it were that simple!) Windows provides a number of mechanisms independent of the registry that can be exploited to automatically load and execute malware. This section covers several of these techniques, including the use of startup folders, recurring scheduled tasks, system binary modification, and DLL load-order hijacking.
Startup Folders
Startup folders are among the most rudimentary persistence mechanisms available in Windows. Their behavior is simple: each user has a startup folder within their profile, and the operating system will automatically execute any programs within it upon login. Windows also provides a Startup folder whose contents are executed upon a login by any user.
On Windows 2000, XP, and Server 2003, the “all users” Startup folder is located at C:Documents and SettingsAll UsersStart MenuProgramsStartup, and the user-specific Startup folder is located at C:Documents and Settings[username]Start MenuProgramsStartup.
On Windows Vista and Windows 7, the “all users” Startup folder is located at C:ProgramDataMicrosoftWindowsStart MenuProgramsStartup, and the user-specific Startup folder is located at C:Users[username]AppDataRoamingMicrosoftWindowsStart MenuProgramsStartup.
Note that the Startup folder isn’t just limited to executable files—for example, we’ve seen attackers plant batch scripts and even .lnk files within Startup. Why a .lnk file? Windows will follow a .lnk file within the Startup folder and load whatever it points to. In one case, we observed malware that achieved persistence through a .lnk file that pointed to the Windows scripting host executable wscript.exe and loaded a separate JScript file supplied as an argument.
Recurring Tasks
In the “Scheduled Tasks” section of this chapter, we discussed various ways that attackers use tasks to execute commands and applications on remote systems. These scenarios typically entail creating simple tasks configured to run a single time in the future via the “at” command. However, both the “at” command and its more sophisticated counterpart, “schtasks,” can also create tasks that recur with any desired frequency. This could be a specified number of minutes or hours, or certain days of the week. An attacker can therefore create such tasks to ensure that their malware continued to run on a compromised system.
As an example, the Conficker worm created unnamed recurring scheduled tasks (At#.job) when spreading to remote systems. These tasks launched an export function provided by the malware DLL file by supplying it as an argument to rundll32.exe. |
Future and recurring scheduled tasks persist as .job files within the %SYSTEMROOT%Tasks directory. Refer to the “Scheduled Tasks” section of this chapter for further information on how to analyze these files, logs, and other sources of evidence related to the Task Scheduler Service.
System Binary Modification
An attacker may choose to modify an existing Windows binary (typically one that is automatically loaded upon bootup or user logon) with a tampered version that executes malicious code. This can be a difficult-to-detect technique, especially when combined with other counter-forensic measures such as time-stomping, because there are thousands of executable files and system libraries that could be potential “targets” for modification. Although modifying a legitimate binary would change its MD5 hash (and, if signed, invalidate its digital signature), the ever-growing number of operating system and application files, as well as the quantity of legitimate binaries that are not digitally signed, can hinder efforts to solve this problem with whitelist analysis.
Of course, changes that cause Windows to crash or otherwise impair the user experience could also limit an attacker’s ability to persist on a system. Modified system binaries must therefore either preserve the original file’s functionality, or at least not disrupt the operating system in any noticeable way. As a result, attackers are more likely to replace noncritical executables or libraries; targeting a core Windows component can introduce significant technical complexities and risks.
Microsoft’s implementation of Windows File Protection (WFP) in older versions of Windows (XP, 2000) can prevent changes to core operating system files, but was largely designed to preserve system stability against user or program error, rather than stop a targeted attack. As a result, it had a number of vulnerabilities that allowed attackers with local administrator privileges to easily bypass its controls. In Vista and later versions, Microsoft replaced the old WFP implementation with the much more effective Windows Resource Protection (WRP). This feature limits changes to WFP-governed resources to a special privileged service account, TrustedInstaller, and has proven to be more resilient to tampering.
The Sticky Keys Attack
The Sticky Keys attack is a simple-but-effective twist to system binary modification that dates back to the Windows 2000 era. This technique targets sethc.exe, a system file that provides various Accessibility features. One of these features is known as Sticky Keys—a variety of keyboard options that can be triggered by pressing the shift key five times in a row during an interactive session.
The trick is simple: replace sethc.exe with a copy of cmd.exe. An attacker can subsequently press shift five times at the Windows logon prompt (even during an RDP session) and get a command shell running as SYSTEM. It’s then trivial to launch Explorer.exe or any other desired application. Conversely, a forensic examiner might easily miss this tampered sethc.exe because it would remain digitally signed (and have an MD5 hash that would appear in most legitimate software whitelists).
This technique no longer works on Windows Vista and later versions; however, there’s another well-known method to achieve the same result. An attacker can simply set cmd.exe as the debugger for sethc.exe by adding the registry key HKLMSOFTWAREMicrosoftWindows NTCurrentVersionImage File Execution Optionssethc.exe, creating a value of type REG_SZ named Debugger, and setting the value data to C:WINDOWSsystem32cmd.exe. The same value can be used to specify any arbitrary executable file as the debugger for a targeted executable.
DLL Load-Order Hijacking
Load-order hijacking, also known as “search-order hijacking,” takes advantage of the process by which a program loads its DLL dependencies. In doing so, an attacker may be able to cause a legitimate program to load and execute malicious code in a DLL, without having to perform any memory-tampering techniques such as process injection.
Most programs do not attempt to load DLLs from a static, hard-coded location—that would certainly cause issues if they were installed or executed from an unexpected path. Instead, Windows provides a mechanism to help ensure that a dynamically loaded DLL, referenced by name, is retrieved from the “correct” location. Microsoft calls this the list of “KnownDLLs,” which is configured in the registry value HKLMSYSTEMCurrentControlSetControlSession ManagerKnownDLLs and populated under the object \.KnownDLLs at boot time. DLLs listed within KnownDLLs are always loaded from the directory %systemroot%system32, and include some of the libraries that are most frequently used by Windows applications. This helps ensure that applications always load the correct versions of these DLLs. An example of the KnownDLLs registry key is shown in Figure 12-37.

So what happens if an application tries to load a DLL that is not specified in KnownDLLs? Windows directs it to follow a specific search order dictated by the SafeDllSearchMode setting. Prior to Windows XP SP3, this option was disabled by default; in current versions of Windows, it will almost always be enabled. The following table illustrates the order in which Windows will look for a DLL by name, based on this setting.
SafeDllSearchMode Disabled (0) |
SafeDllSearchMode Enabled (1) |
Directory where the application is loaded |
Directory where the application is loaded |
Current working directory |
%systemroot%system32 |
%systemroot%system32 |
%systemroot%system |
%systemroot%system |
%systemroot% |
%systemroot% |
Current working directory |
%PATH% environment variable entries |
%PATH% environment variable entries |
Microsoft maintains a page dedicated to describing DLL search order across all versions of Windows at msdn.microsoft.com/en-us/library/ms682586(VS.85).aspx.
In order to conduct DLL load-order hijacking, an attacker must therefore take advantage of an application and a targeted DLL file name, whereby
• The legitimate DLL is not specified in KnownDLLs.
• The legitimate DLL is not in the same directory as the application executable file.
• The executable file does not use an absolute path to load the DLL.
A well-known example, cited in a blog post by Mandiant, involves ntshrui.dll and explorer.exe. The Windows Explorer executable resides in %systemroot%, whereas the legitimate copy of ntshrui.dll resides in %systemroot%system32. Explorer automatically loads ntshrui.dll upon system bootup. However, it is not protected in the list of KnownDLLs. As a result, if an attacker places a malicious copy of ntshrui.dll in %systemroot%, it will be loaded by explorer.exe due to being in the same path. This can achieve persistence for malicious code in the copy of ntshrui.dll without any modifications to the registry, process injection, and so on.
This technique is certainly not limited to explorer.exe, but it is a popular target due to the large number of DLLs it loads that are not protected by KnownDLLs and its location outside of the %systemroot%system32 directory. We have seen attackers exploit other executable files, including those used by third-party applications that are not part of a core Windows distribution, during real-world incidents. |
This is a convenient trick to get a legitimate program to load malicious code, but an attacker must also ensure that it doesn’t introduce instability or break required functionality. As a result, malicious DLLs used in load-order hijacking attacks typically provide an identical set of exported functions as their legitimate counterpart. When called, the malware can simply “pass through” these exported functions to the original DLL. This ensures that the calling application continues to run properly without requiring that the attacker to reimplement identical functionality in their malicious DLL.
Identifying evidence of load-order hijacking on a compromised system can be challenging. We will often use a combination of file system timeline review (focusing on DLLs created within proximity to suspected attacker activity) and memory analysis (focusing on unsigned DLLs loaded by legitimate applications) to hone in on malware that relies on this technique for persistence. Analysts can also apply indicators of compromise for specific DLLs that should never load from certain paths (such as our preceding example for ntshrui.dll).
We warned you at the outset—Windows is a complex beast. We’ve covered an enormous amount of evidence in this chapter, but it can be difficult to keep track of which sources of evidence provide which information. As a means of both reviewing what you learned and to provide quick reference, this section highlights a number of common investigative questions and scenarios, and lists the types of evidence that can point you in the right direction for each. Although the listed items should not be considered an all-encompassing list of all possible sources of evidence, they do reflect the first places we typically look when investigating Windows systems.
What sources of evidence can I use for timeline analysis?
Artifact |
Time-Based Evidence Available |
NTFS Master File Table |
MACE timestamps for Standard Information and Filename Information attributes |
NTFS INDX Attributes |
MACE timestamps (Standard Information only) |
Prefetch Files |
First Executed, Last Run |
Event Logs |
Entry Generated Time, Entry Logged Time |
LNK Files |
MAC timestamps (Standard Information) of referenced file |
Recycler Bin INFO2 / I$ Files |
Date and time of “deletion” |
Scheduled Task (.job Files) |
Last run time, scheduled date |
Registry – All Keys |
Key Last Modified time |
Registry – ShimCache |
Last Modified (Standard Information) date and time of each tracked file; Last Update (only available on certain versions of Windows) |
Registry – UserAssist |
Application last executed time |
Registry – ShellBags |
MAC (Standard Information) of each tracked path |
Memory – Processes |
Create time, exit time |
Memory – Network Connections |
Create time |
Artifact |
Evidence Available |
Prefetch Files |
Full path to executable file, number of times executed, first and most recent run time, accessed files loaded within the first 10 seconds of execution. |
Registry – ShimCache |
For each tracked executable file and script: full, size (optional), execution flag (optional), Last Modified date, record Last Update date (optional). |
Event Logs – Security |
Process Audit events (EID 4688, 4689) track the full path to the executed file, process ID, parent process ID, username, associated logon ID, and process start and process stop dates and times. |
Event Logs – Task Scheduler Operational |
“Launch task” events (EID 129, 201) record the full path to files executed via scheduled tasks; Task Registered and Task Updated events (EID 106, 140) log the task name and the user who created them. |
Scheduled Task Log (SchedLgU.txt) |
File name executed by task, date and time of execution, and exit status code. |
Event Logs – System |
Service create/start/stop events for services known to be associated with malicious files. |
Registry – User Hives |
MUICache and UserAssist keys record applications executed during interactive sessions. |
Registry – MRU Keys |
MRU keys can demonstrate that a user utilized specific applications to open or interact with files, addresses, or other resources. |
What artifacts can provide evidence of deleted files?
Artifact |
Evidence Available |
NTFS Master File Table |
“Inactive” records—all MFT attributes will remain available (including resident data, if applicable). |
NTFS INDX Attributes |
Remnants of deleted files in INDX slack space. Parse to obtain original file size and MAC timestamps (Standard Information). |
LNK Files |
May remain even if referenced file is deleted. |
Recycle Bin |
INFO2 (Windows XP) or $I files (Vista and later) contain metadata about Recycle Bin contents. |
Artifacts of executed files & scripts |
|
Registry—MRU Keys |
MRU keys may record files that are no longer present which were previously opened by Explorer or specific applications. |
What files are configured to maintain persistence (automatically run) upon bootup or user login?
Artifact |
Evidence Available |
Registry – Auto-Run Keys |
Run/RunOnce, Services, Active Setup Installed Components, Winlogon, LSA Packages, Userinit, AppInit DLLs, Browser Helper Objects, Shell Extensions, and so on. |
Scheduled Tasks |
The .job files configured to run in the future or on a recurring basis. |
File System – User Startup Folders |
Contents of each user’s Startup folder automatically execute upon login. |
File System – DLLs |
(Malicious?) DLLs placed in the “wrong” path to exploit search-order hijacking. |
Who interactively logged on to a system? At what date(s) and time(s) did a given user log on to a system?
Artifact |
Evidence Available |
Event Logs – Security |
Successful/failed logon attempts (by type): Logon type 2 (console; for example VNC, screen-sharing, physical access), logon type 7 (screen unlock), logon type 10 (Terminal Services/RDP). Recorded on accessed system for local accounts, and accessed system + domain controller for domain accounts. Event may contain source system/IP. Source system from which network logon occurred may also record an explicit logon event when a user attempts to authenticate to a remote system under the context of a different account. |
Event Logs – Terminal Services Logs |
“Microsoft-Windows-TerminalServices-Remoteconnection Manager” (EID 1149)—user, domain, source IP. “Microsoft-Windows-TerminalServices-LocalSessionManager” (EID 21, 23, 24)—user, domain, source IP. Both recorded on accessed system for local accounts, and accessed system + domain controller for domain accounts. |
Terminal Server Client MRU key on source system. |
|
File System |
Creation of user profile directory (for example, C:users[username]) and associated subdirectories as well as registry hives upon first interactive logon by an account. Modification to registry keys or files within a user profile during interactive activity by that account. |
Who established a network logon to a system? At what date(s) and time(s) did a given user log on to a system?
Artifact |
Evidence Available |
Event Logs – Security |
Successful/failed network logon (type 3) events. Recorded on accessed system for local accounts, and accessed system + domain controller for domain accounts. Event may contain source system/IP.
“Logon attempt using explicit credentials” event on source system may contain target system and target username (only generated if user authenticated to accessed system using different credentials than their logon session on the source system). |
Event Logs – System |
Service start/stop events (EID 7035, 7036) for common remote access utilities such as PsExec. |
Registry – MRU, Shellbag Keys |
MRU and shellbag keys on source system may indicate mounted network share to accessed system. |
Memory |
Remnants of console commands in csrss.exe or conhost.exe memory on source system. |
SO WHAT?
Windows remains the most prevalent operating system used worldwide in corporate environments. We rarely encounter an incident response case where the attacker’s trail of did not pass through at least a few Windows systems—even if their initial entry vector (or ultimate target) was not running on Windows. Many tools exist to facilitate and automate aspects of Windows forensic analysis; however, understanding the fundamental sources of evidence made available by the operating system, as well as the conditions under which they are generated and maintained, remain essential to any investigator. This chapter sought to provide a “mile-wide, inch-deep” overview of these sources of evidence—we hope that you can use it as a launching point for further in-depth research, experimentation, and analysis.
QUESTIONS
1. Which attribute within the Master File Table (MFT) contains timestamps that cannot be directly manipulated through the Windows API?
2. What NTFS artifact, specific to a directory, may record metadata for deleted files?
3. What criteria must be met for a file to be resident within the MFT?
4. How could an attacker load and execute malicious code from an alternate data stream on a Windows 7 system?
5. What file names can be obtained by parsing the contents of a prefetch file for a given application?
6. An attacker connects to an unprotected WinVNC screen-sharing service on a workstation. The current user is logged out, so the attacker must supply valid Windows credentials to proceed. What will the logon type be for this authentication?
7. An attacker mounts the ADMIN$ share on a remote server in order to remotely schedule a task via the “at” command. What logon type would this activity generate?
8. What source of evidence records the username responsible for creating a scheduled task?
9. What distinguishes evidence in the Shim Cache from prefetch files?
10. What registry keys can record the directories accessed by a user via Explorer during an interactive session? What metadata is stored within the values of these keys?
11. What distinguishes the evidence in UserAssist keys from that stored in MUICache keys?
12. Name two persistence mechanisms that do not require the use of the registry.
..................Content has been hidden....................
You can't read the all page of ebook, please click here login for view all page.