

Enterprise Services
Every enterprise network has a support infrastructure that provides key services necessary to operate and conduct business. Some of these services are found only in large corporate environments, but others are found in nearly every network. Many of them are not security related. However, all of them can help you to find evil and solve crime. In this chapter we discuss enterprise services and related applications that have frequently provided us with useful information during an incident response. For each service, we explain its purpose, what logging or other useful artifacts it generates, and how you might be able to use those artifacts as evidence during an investigation. At the end of this chapter we briefly discuss some analysis approaches we’ve found useful. In addition, keep in mind that these services are often used as part of remediation, which we’ll talk about more in Chapters 17 and 18.
We’ve chosen to cover topics in four categories, including network infrastructure, enterprise management, antivirus, and application support. This includes web servers, DNS servers, database servers, and software metering tools. It’s difficult to breach an environment without leaving a trail of evidence on one or more of these services. We hope to show you how to find that evidence. However, because each enterprise environment is different, we encourage you to discover the services your organization has in place. You should take the time to learn about how you can use them, and ensure they are configured to provide you with useful information.
In this chapter we discuss changes you can make to enterprise services that may help you during an incident. Because those changes could cause outages or other problems, we highly recommend that you work with your IT department to have them implement any changes. |
NETWORK INFRASTRUCTURE SERVICES
This section covers two common services that are a core part of enterprise networks. In our experience, the evidence they provide is an important part of every investigation. Although these services are unlikely to tell you what an attacker tried to accomplish, they will help you to trace the attacker’s movements and scope an incident. The two services are:
• Dynamic Host Configuration Protocol (DHCP)
• Domain Name System (DNS)
DHCP
Most enterprises use DHCP to assign IP addresses to devices connected to the network. DHCP can also configure other network settings, such as DNS servers, default domain names, Network Time Protocol (NTP) servers, and IP routes. The DHCP protocol communicates over UDP ports 67 and 68. The current specification for DHCP is RFC (Request for Comments) 2131, which contains further detail regarding the DHCP standard:
GO GET IT ON THE WEB
In an investigation, the most important aspect of DHCP is the assignment of IP addresses to systems, called a DHCP lease. Because most leases are not permanent, a given device may have many different IP addresses over time. Also, the duration of a DHCP lease is configurable, and will vary from a few minutes to days or even weeks. This can make it difficult to trace network activity to the true source when all you know is the IP address. The system that is currently assigned a suspect IP address may not be the same system that was assigned that IP address when the suspicious activity occurred. If you are investigating a system that was issued a DHCP IP address, you should examine your DHCP logs to determine the mapping of the IP address to a system at the point in time you are interested in. If you don’t, you may waste time looking at the wrong system. There are two searches we normally run against DHCP logs:
• Search a date for an IP address This tells you what system was assigned the IP address on that date. One example of how this is useful is in tracking down a system identified by IP address in an IDS alert. Because the alert specifies an IP address, which was assigned by DHCP, this search allows you to identify the system that was associated with the IP address.
• Search all dates for a MAC address This tells you all IP addresses and the associated dates that a system was assigned over time. Once a system is identified as part of the incident, we perform this search so we can look for evidence sources from those dates for those IP addresses. This frequently turns up more leads.
The most common DHCP solutions we encounter are Microsoft and the Internet Systems Consortium (ISC) DHCP servers. In the following sections we cover the basics of how to enable logging, where the logs are kept, and what information is available. This information, along with basic search methods, will allow you to determine what system had a given IP address at a specific date and time. Let’s start with Microsoft’s DHCP.
Microsoft DHCP
The Microsoft DHCP service is included as part of Microsoft’s server line of commercial operating systems. Logging for Microsoft’s DHCP service has not changed much over time, either in location on disk or in content. You can read official documentation regarding DHCP logs on Microsoft’s TechNet website in the following TechNet articles:
GO GET IT ON THE WEB
Logging is enabled by default on Microsoft DHCP servers. The logs are written in plain text and by default are stored in %windir%System32Dhcp (for example, C:WindowsSystem32Dhcp). Microsoft has added a number of fields to the log file over time. Let’s look at the available fields, starting with Server 2003, which contains the following seven fields:
• ID The event ID code. A description of the event ID codes is at the beginning of the log.
• Date The date the event was logged in local time.
• Time The time the event was logged in local time.
• Description A description of the event.
• IP Address The IP address assigned to the host.
• Host Name The name of the host requesting an IP address.
• MAC Address The MAC address of the host requesting an IP address.
Windows Server 2008 added the following six fields, for a total of 13 fields:
• User Name
• TransactionID
• QResult
• Probationtime
• CorrelationID
• Dhcid
Windows Server 2012 added five more fields in addition to the fields added in Server 2008, for a total of 18 fields:
• VendorClass(Hex)
• VendorClass(ASCII)
• UserClass(Hex)
• UserClass(ASCII)
• RelayAgentInformation
Server 2008 and 2012 DHCP logs also contain information to explain some of the additional fields. The following is an example of a Microsoft DHCP server log entry:
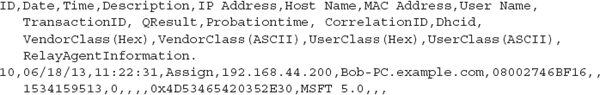
An issue to be aware of is that the date and time fields in Microsoft DHCP logs are in local time! As we’ve mentioned before, local time is the scourge of incident responders, who should always prefer UTC. Using local times is also a departure from some Microsoft services, such as Internet Information Services (IIS), and may cause confusion and difficulty when you are trying to correlate events. |
Since Windows Server 2003 R2, DHCP logging is enabled by default. However, if there are no log files present, you can enable logging through the DHCP service management console found under Administrative Tools in the Windows control panel. Click an address space (for example, IPv4), right-click and select Properties, and on the General tab select Enable DHCP Audit Logging. If you find that logging is already enabled, check the Advanced tab to view the log path—someone may have changed the default location.
A major issue with Microsoft’s DHCP logging is that one week’s worth of logging is the maximum duration that is retained by default. The Microsoft DHCP log file naming convention is DhcpSrvLog-<day>.log, where <day> is the three letter day-of-week abbreviation (for example, Mon). That means logs for a given day are overwritten the next week—which is terrible for an incident responder. In most organizations we’ve worked with, the IT staff does not consider DHCP log preservation important—and for most IT requirements, that is acceptable. However, because most incidents go undetected for longer than a week, you must coordinate with the IT staff to make sure the DHCP logs are recorded and preserved.
Now that we’ve covered Microsoft DHCP, let’s look at ISC DHCP.
ISC DHCP
ISC’s DHCP server is a free, open source DHCP server. The ISC DHCP server can run on multiple operating systems, including Linux, BSD, OS X, and even Windows. We most commonly find ISC’s DHCP server deployed on a Linux or BSD-based operating system. You can download the server and read more at the following website:
GO GET IT ON THE WEB
On Unix-based systems, ISC’s DHCP server will log to the syslog local7 facility by default. To determine where the corresponding log file or destination is located, you will need to research how logging is configured in your environment. The most common Unix-based logging services are syslog, rsyslog, and syslog-ng. The configuration file for standard syslog is /etc/syslog.conf, rsyslog is /etc/rsyslog.conf, and syslog-ng is /etc/syslog-ng.conf. Review the configuration file for entries that mention the local7 facility.
The ISC DHCP server normally generates two log entries per client request for an IP address: a DHCPDISCOVER entry and a DHCPOFFER entry. In the following example, there are two entries associated with a single client’s request. The first entry indicates that a client with a media access control (MAC) address of 2e:34:c7:ab:17:03 requested an IP address (DHCPDISCOVER). The request was received by the server from the network interface named re1. The second entry shows the server offered the IP address 10.18.0.179 to the client (DHCPOFFER). The offer entry also indicates the client’s computer name (Bob-VM) and MAC address. The following are examples of log entries:
Take note that the date and time in the tests we performed were in local time, but that may vary based on local configuration.
DNS
The Domain Name System, or DNS, is a system that stores information primarily about host names. DNS provides a wide variety of information, but the most common function is to look up, or resolve, host names. For example, when you browse to your favorite website, www.example.com, your computer must first determine the IP address that corresponds with www.example.com. Your computer will automatically query the configured DNS server to resolve the host name. Normally within a second or so, the DNS server will return the IP address—in this case, 93.184.216.119. Then your computer can initiate a TCP/IP connection with that address and begin communications. DNS client resolution commonly uses UDP port 53, and DNS zone transfers use TCP port 53. If you are interested in more details about the DNS protocol, we recommend you review RFC 1034 and 1035:
GO GET IT ON THE WEB
The DNS resolution process is an important source of evidence in an investigation. A DNS server can collect logs that may show the following:
• The host name that resolution was requested for (query), such as www.example.com
• The IP address of the client that requested resolution
• The result of the resolution (answer), such as 93.184.216.119
These elements may allow you to determine which hosts in an environment were phished through an e-mail that contained a link, or perhaps find hosts with active malware. If you have a good historical archive of DNS resolution, you will be able to more confidently answer questions about the full timeline of an incident. A good archive is particularly important during an indent because many malicious domains change resolution frequently—either to new IP addresses or to a “parked” state where the host name resolves to an IP address such as localhost (127.0.0.1). As with any logging that may help an investigation, the ideal scenario is to set up centralized log aggregation and storage.
ISC Berkeley Internet Name Domain (BIND)
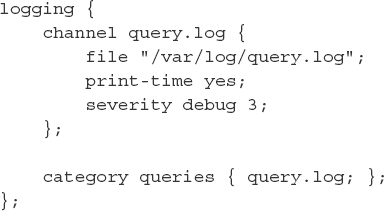
In BIND version 9, query logging is off by default. You can turn on query logging by adding the following to your named.conf.local file:
Modify the file name and path to suit your environment. Also, don’t forget to create the file and set the correct ownership:
You must restart the BIND server to make those changes take effect. The server will begin to log queries submitted by DNS clients to the query.log log file. BIND 9 query logs will contain entries similar to this:
This entry indicates the client that performed a query and the host name that was queried. In this case, the computer with the IP address 10.18.0.80 performed a DNS lookup of the host name example.com. The “IN A” indicates the client asked for an IP v4 address. Requests for IP v6 addresses will contain “IN AAAA.”
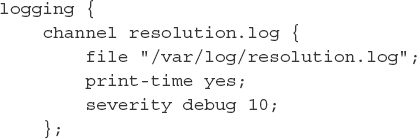
If you also want to log the responses (DNS answers), you must further increase the level of logging. Currently, the only way to log responses is to enable the “default” category and increase the debug level to at least 10. Be careful, as this will generate a significant amount of log data. To make this logging change, add the following to your named.conf.local file and restart the BIND server:
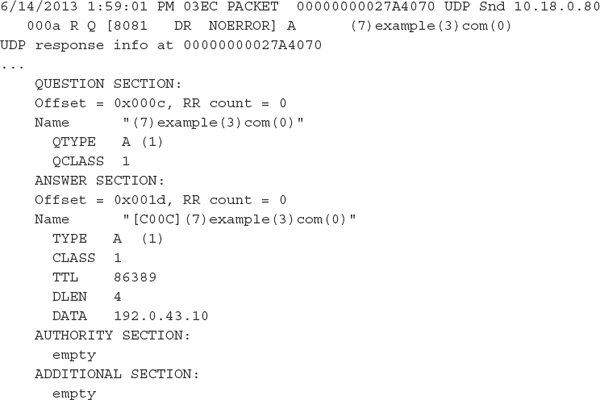
Once these changes are enabled, BIND will add multiline entries in the log file related to query responses. For example, a query for www.example.com generates the following log entries for the final response packet:
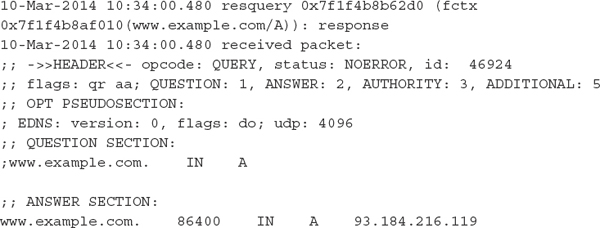
The key area is the ANSWER SECTION, which shows the IPv4 address(es) that the DNS server found for www.example.com. As you might have guessed, this format is not ideal for easy analysis—more on this challenge later. For now, let’s move on to Microsoft DNS.
Microsoft DNS
DNS query logging is off by default on Microsoft DNS servers. To log queries, you can use the DNS control panel to enable Debug Logging. The procedure is the same for Windows Server 2003 through 2012. Open the Control Panel, select Administrative Tools, and then select DNS. Right-click the server name and select Properties. Then click the Debug Logging tab and enable the following checkboxes:
• “Log packets for debugging”
• Packet direction:
• Outgoing and incoming
• Transport protocol:
• UDP
• Packet contents:
• Queries/Transfers
• Packet type:
• Request and Response
• Other options:
• Details
However, be warned that enabling Details will generate a large volume of log data. Finally, check that the log file path and name are appropriate for your environment and adjust the maximum size to an appropriate figure. If the file path and name are blank, the default log file is %systemroot%system32dnsdns.txt. If you only specify a file name, the default folder is %systemroot%system32dns.
Keep in mind that the log file is truncated (a new file is created, therefore previous content is lost) when you restart the DNS service or reboot the system. In addition, if the max size is reached, the log file is truncated. Because there is no built-in log rotation, this may cause you to lose a significant amount of DNS logging. The following is a description of the fields recorded by Microsoft DNS logs:
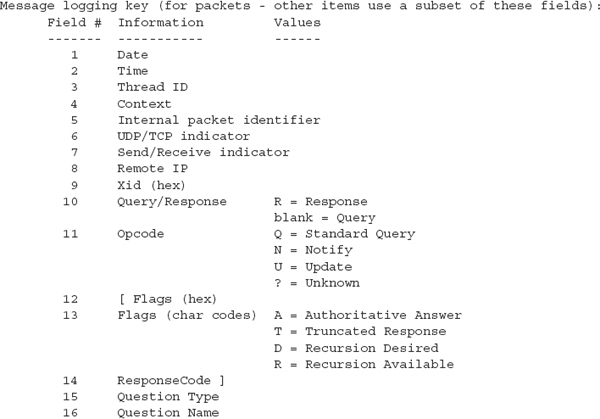
The only exception to these fields is that Server 2003 does not record the Internal packet identifier field; otherwise, it’s consistent. Just as with Microsoft DHCP logging, the DNS logs record the date and time in local time. Keep this in mind as you perform analysis. The following is a sample entry from a Microsoft DNS log:
Be aware that we removed 22 lines and replaced them with the ellipse in the preceding sample code—and that is for just a single query from one client! Because both Microsoft and ISC DNS servers are poor at logging concise answers for DNS queries, a better option to consider is network-level logging. In the next section we take a look at a free tool that might help you.
Network-Level DNS Logging
As you can see, major DNS servers cannot yet provide concise logging of both queries and responses (answers). Logging responses will generate irrelevant output in addition to the response. In both BIND 9 and Microsoft DNS, the DNS answer generates log records that span tens of lines and generate huge log files. These issues make application-level DNS response logging infeasible for most environments.
In cases where logging DNS responses is important, a network-based solution may be more reasonable. One options is a tool named DNSCAP. DNSCAP was specifically designed to monitor a network for specific DNS traffic—queries, responses, or both. DNSCAP can log DNS traffic to a PCAP file, or output dig-style messages for each DNS packet detected. If your network has a small number of egress points, it probably makes more sense to set up dedicated systems to capture and log DNS traffic. You can read more about DNSCAP and download the source code at:
GO GET IT ON THE WEB
ENTERPRISE MANAGEMENT APPLICATIONS
Many enterprises have third-party software management or inventory tools that allow administrators to control and audit applications installed on systems in their environments. These tools, many of which are not designed specifically for security monitoring, can often provide you with information about software that ran on a system. Because attackers are likely to run tools and malware on a compromised system, these management applications can provide insight into attacker activities.
Although enterprise software management applications often have management consoles for reporting and deployment, this section will focus on the forensic artifacts these applications create on a system. You may receive a forensic copy of a drive or be called to investigate an environment where you cannot obtain access to the management console. In these cases, you can use the techniques described in this section to look for indicators of compromise.
The two software management applications we’ll cover are LANDesk’s Software Management Suite and Symantec’s Altiris Client Management Suite.
LANDesk Software Management Suite
A popular third-party application for managing software inventory is LANDesk Software’s Management Suite. Although the LANDesk Management suite has a variety of functionality, the one that is of primary interest to an incident responder is the Software License Monitoring (SLM) component. This component tracks the execution history of every application run on a system and provides a wealth of information, such as the date and time an application ran, file attributes of the executable, and the user account that ran it.
The information LANDesk SLM records will remain on the system even if an application is deleted. Attackers often copy tools such as password hash dumpers onto a system, execute them once, and then delete them. You can find evidence of this in the LANDesk SLM monitor logs even if the binary is no longer on the file system. You can read more about LANDesk on their website:
GO GET IT ON THE WEB
In the next few sections we’re going to cover where LANDesk stores SLM data, how you can parse the data, and, finally, some tips on what to look for. Let’s start with where LANDesk stores SLM data.
The LANDesk Management Suite stores information about software execution in the Windows SOFTWARE registry hive, under the following key:
LANDeskManagementSuiteWinClientSoftwareMonitoringMonitorLog
The MonitorLog key contains subkeys for each of the applications executed on a system and recorded by SLM. Each of the application subkeys contains the following values:

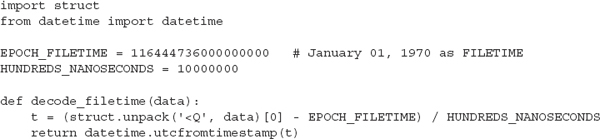
LANDesk SLM records the Duration times in hundreds of nanoseconds and stores them as little-endian binary data in the registry. The First Started and Last Started values are Windows FILETIME data structures stored as binary. The following Python code contains a reference function (decode_filetime) that converts the FILETIME structure to a human-readable date:
Although you could browse through these keys and perform conversions manually, there is a better way. In the next section we look at a couple of methods to parse the SLM data.
LANDesk provides a free utility named SLM Browser, but the version available does not parse an exported registry hive. Because this tool only parses the registry on a live system, you can use it to collect this data during live response. You can read more about SLM Browser and download the tool here:
GO GET IT ON THE WEB
In addition to the SLM Browser from LANDesk, you can use the RegRipper plugin, landesk.pl, to parse these values from a given registry hive. An advantage to using RegRipper is that you can parse an exported registry in addition to a live system. This plugin, originally released in 2009, only parses the Last Started times for the monitorlog. Justin Prosco created an updated RegRipper plugin named landesk_slm.pl that parses additional fields and supports registry reflection. He also maintains a Python version of the script named landesk_slm.py that uses the python-registry library by Willi Ballenthin to parse the registry and decode the LANDesk SLM keys. You can download these tools from the following websites:
GO GET IT ON THE WEB
RegRipper and landesk.pl code.google.com/p/regripper
Justin Prosco’s registry tools github.com/jprosco/registry-tools
Willi Ballenthin’s Python registry library github.com/williballenthin/python-registry
Now that it’s a bit easier for you to parse and view all of the SLM data, we’d like to provide a few tips that should help you to identify malicious activity.
What to Look For
The LANDesk Management Suite allows administrators to gather information about applications running on their network. As an incident responder, you can use this information to find evidence of an intrusion. In addition to looking for known names of malware, here are some example use cases for finding malicious activity in these logs:
• Use frequency analysis on Total Runs Attackers sometimes run their utilities only once on a system before deleting them. Using frequency analysis to find software with a low value for Total Runs may help you identify malware on the system.
• Identify suspicious paths of execution Attackers frequently use the same path to execute their malware from, whether it’s a temporary directory or a specific directory. For example, any execution of software from the root of the Windows Recycle Bin directory has a high probability of being malicious.
• Use timeline analysis to identify a date of compromise Look for clustering of Last Run time values of legitimate Windows applications such as net.exe, net1 .exe, cmd.exe, and at.exe. Casual users of a system will infrequently use these built-in Windows utilities, but an attacker is highly likely to use them within a short time period. These utilities may be indicative of lateral movement involving the compromised system.
• Identify suspicious usernames Use the Current User value to identify the user account that last ran a specific executable. User accounts that have a low number of applications recorded may be malicious and indicative of lateral movement. Try to identify accounts that shouldn’t normally access a system, and look for evidence of software execution. Pay particular attention to applications run by elevated accounts, such as domain administrators.
• Identify executables that no longer exist on the file system Use the paths of the executables recorded by LANDesk SLM to identify deleted files. Although legitimate applications such as installers may execute and delete temporary executables, analysis of these deleted files might lead you to attacker activity.
Next, let’s cover Symantec’s Altiris Client Management Suite.
Symantec Altiris Client Management Suite
Another popular enterprise endpoint management solution is the Altiris Client Management Suite from Symantec. This suite has an optional component for application metering, which like the LANDesk Management Suite, records the execution history of applications run on a system. Administrators typically use application metering for performance monitoring, but you can take advantage of its logs to find evidence of compromise on a system. You can read more about Symantec Altiris Client Management Suite at the product website:
GO GET IT ON THE WEB
Now, let’s talk about how Altiris can help you during an investigation. The most useful artifact we’ve discovered is the AeXAMInventory log. In the following two sections we talk about what is stored in this log and provide some tips on how to take advantage of it.
Altiris Application Metering Logs
Symantec’s Altiris inventory exists as a tab-separated values (TSV) file named AeXAMInventory.txt, which makes it trivial to parse. The path to the text file can vary, but you can determine the Altiris installation directory by examining the HKLMSOFTWAREAltirisAltiris AgentInstallDir registry key.
These logs contain much more information about the executables run on a system than the LANDesk Management Suite registry keys. The Altiris Application Metering Agent parses the version information of the PE files and stores this data in the log, which is extremely valuable if you are looking for malware or other files with specific version attributes. There are different formats for the AeXAMInventory.txt log files, as version 7.0 of the product introduced new fields such as the file size and MD5 hash of recorded software. The AeXAMInventory.txt file does not include a header row to identify the columns. The following table outlines the fields as described in the Altiris Application Metering Product Guides from Symantec:
Name |
Description |
Manufacturer |
PE Version Info: Manufacturer |
Internal Name |
PE Version Info: Internal Name |
File Version |
PE Version Info: File Version |
File Name |
Name of the file |
Product Name |
PE Version Info: Product Name |
Known As |
PE Version Info: Internal Name |
User |
User account that last executed the software |
Domain |
Domain to which the account that last executed the software belongs |
Discovered |
Date of first execution |
Last Start |
Date of last execution |
Month Year |
Month and year of the last monitoring period when the software ran |
Run Count |
Number of times the agent recorded execution of the software during the monitoring period |
Denial Count |
Number of times the software has been denied from running during the monitoring period |
Total Run Time |
Total time (seconds) the software ran during the last monitoring period |
Peak Memory |
The largest amount of memory (bytes) that the software used during the last monitoring period |
Avg CPU Usage |
The average CPU percentage used by this application during the last monitoring period |
Month End Summary |
Boolean value indicating whether the current set of application summary data is the final set for the month |
GO GET IT ON THE WEB
The fields recorded in this log are configurable by an administrator, but we’ve encountered very few instances where administrators have changed the default values.
Now that you are familiar with what is in the Altiris logs, we’d like to provide a couple of pointers on how you might be able to effectively use them in an investigation.
What to Look For
The techniques described in the LANDesk section also apply for the Altiris application metering logs. However, because these logs have additional information, there are a couple other areas to look at:
• Identify executables that do not have version information Malware authors often strip their executables of identifying information such as the version information stored in the executable. This prevents signature-based security products such as antivirus and intrusion detection systems from being able to identify them with a signature based on this information. Because the Altiris application metering agent records version information from the PE headers, it will leave this field blank for executables that don’t contain this information. Although some legitimate applications don’t contain version information, this is good place to start when looking for unknown malware on a system.
• Identify suspicious executables by file size Malware, especially backdoors and utilities, are usually less than a megabyte in size. They’re relatively simple applications and don’t have a lot of the user interface and error-handling code found in commercial applications. In addition, an attacker may install the same backdoor using different file names throughout an environment. Though they change the name of the file, the size may not change, making it trivial to look for this value in these logs.
ANTIVIRUS SOFTWARE
Antivirus software is ubiquitous in the corporate enterprise. It is rare to investigate a system that does not have some type of antivirus solution installed. These applications can be a vital source of evidence, as they often have verbose logging and record evidence of malicious activity on the system. In this section we discuss the forensic evidence created by three major antivirus software packages.
Antivirus software will rarely detect all programs that an attacker tries to use on a system. Sometimes an attacker executes programs that are common administrative tools, and are not considered malicious. Other times, there is no effective signature, so the program is undetected. Therefore, an antivirus solution may see none, some, or all programs that an attacker tries to execute. Antivirus logs are a valuable source of evidence, but they are an incomplete picture at best. We’re mentioning this because we still see too many organizations base conclusions on what they find—or don’t find—in an antivirus log. |
Most antivirus solutions include a threat removal mechanism called “quarantine.” When the antivirus detects a threat on a system, it can encode the file and move it to designated location on the disk. When an executable file is encoded and stored in a quarantine location, it can no longer execute on the system until it is restored from quarantine. Quarantining a file is useful to end users because antivirus sometimes mistakenly identifies a legitimate file as a threat. In this case, a user can simply restore the file to its original location and there are no consequences from the false positive detection. For the incident responder, however, antivirus quarantine serves a much more important function of preserving evidence.
Incident responders in a corporate environment should work with the antivirus software administrators to ensure that policies are set to quarantine first before deleting a file. Many antivirus applications delete any file detected as a risk by default. Although this may mitigate risk on an individual system, this setting works against the incident response team, because it essentially destroys evidence. When antivirus deletes the file, the incident responders do not have the opportunity to collect the file and examine it for further indicators of compromise.
Each antivirus product has its own method for encoding the quarantine files, some of which are complicated proprietary formats. Whether the antivirus solution simply changes the file extension or encrypts the file using a symmetric key, there is usually a way to retrieve the original files from the quarantine. Thus, with the proper understanding of how the antivirus engine quarantines files, an incident responder can recover files from a compromised system.
Symantec Endpoint Protection
Symantec Endpoint Protection (SEP) is one of the most common antivirus suites we encounter. In this section we provide an overview of the Symantec Endpoint Protection log files and the quarantine file format that SEP uses to contain threats discovered on a system. You can read more about SEP on Symantec’s website:
GO GET IT ON THE WEB
Log Files
The default location for Symantec Endpoint Protection client logs is %ALLUSERSPROFILE%Application DataSymantecSymantec Endpoint ProtectionLogs. The files in this directory are named in the date format YYYYMMDD to indicate the date the application generated the log file. The logs are stored as plain text and are comma delimited, making them easy to examine and parse. Symantec provides a full listing of the fields and their values on their website. The current version of Symantec Endpoint Protection has 59 fields, which is far too many to list here. For the full list, visit the following Symantec knowledgebase article:
GO GET IT ON THE WEB
An important field to highlight here is the “time of event” field, because it’s represented in a custom date format. Symantec Endpoint Protection logs dates in a custom hexadecimal format composed of six octets. Each octet can be decoded into a component of the date, as listed in the following table:
Octet |
Description |
1 |
Year, Number of years since 1970 |
2 |
Month, (January = 0 through December = 11) |
3 |
Day |
4 |
Hour, 24-hour format |
5 |
Minute |
6 |
Second |
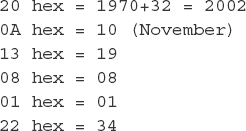
Symantec’s documentation shows the following example: a log entry with a date timestamp of 200A13080122 corresponds to the date November 19, 2002, 8:01:34 AM UTC. To compute this date, convert the hex digits to decimal and make the following computations:
When Symantec Endpoint Protection detects a threat on a system, in addition to logging to the log file in the Logs directory, it also generates an event in the Windows Application event log. The events will have Event ID 51 and a source of Symantec AntiVirus. The log messages typically start with the phrase “Security Risk Found” and contain a description of the detection signature and the full path of the associated file.
We have a tip on something useful to look for in log files, not only with SEP, but all antivirus products. Attackers frequently create archives or other files that antivirus cannot open due to password protection or other parsing issues. Many times, the antivirus product will log an error that includes the file name and path. This can be a valuable source of evidence, because it’s likely the attacker has since deleted such files. |
Symantec Endpoint Protection creates quarantine files in the %ALLUSERSPROFILE%Application DataSymantecSymantec Endpoint ProtectionQuarantine folder by default. The quarantine files have a file extension of .vbn (VBN) and are stored in a custom format. There are two VBN files for each file quarantined. The first contains metadata about the quarantined file, and the second contains an encoded copy of the original file.
In previous versions of Symantec Antivirus, the precursor to Symantec Endpoint Protection, the encoding was simply the original file XOR encoded with 0x5A. Symantec Endpoint Protection now uses an XOR value of 0xA5 and inserts additional 5-byte sequences throughout the encoded file. If an analyst simply XOR decodes the VBN file using the 0xA5 key, the MD5 of the resulting file will not match that of the original file that was quarantined, and is unlikely to properly execute.
Symantec provides the qextract.exe tool to extract files from quarantine. However, the tool has a major drawback—you can only run QExtract on the system that quarantined the file. Therefore, this tool cannot be used on VBN files extracted from a forensic image or acquired remotely from an infected machine. You can download the QExtract tool from Symantec’s website at the following addresses:
GO GET IT ON THE WEB
QExtract (SEP 11) www.symantec.com/connect/sites/default/files/11xQextract.zip
QExtract (SEP 12) www.symantec.com/connect/sites/default/files/12.1Qextract.zip
Note that a different version of QExtract is required for different versions of Symantec Endpoint Protection. As newer versions of SEP are released, be sure to search Symantec’s website for newer versions of QExtract.
Because we take care to avoid altering evidence, a good approach to decode a VBN file is to boot a copy of the forensic image of the affected system. In the booted copy, you can safely run QExtract without fear of modifying evidence. Another option is to use a Python script called pyqextract.py developed by Jamaal Speights. Unlike with QExtract, you can run this script on any system, not just the system where SEP created the VBN. However, in our testing of this script, it did not always restore an exact MD5 match of the original file. We were unable to determine a pattern to the failures, so we advise that you perform testing before you use it. More information, including the script, is available at the following link:
GO GET IT ON THE WEB
McAfee VirusScan
McAfee VirusScan Enterprise is another popular antivirus suite for enterprises. This application also stores log files locally on the host even when connected to an enterprise management server. An incident responder can use these logs to find evidence of intrusion without access to the management console or even administrative access to the local application.
GO GET IT ON THE WEB
Let’s look at the log files McAfee generates, followed by information on McAfee’s file quarantine process.
Log Files
According to the McAfee VirusScan Product Guide, the location of the application logs stored locally on a system depends on the version of Windows. For Windows 7 systems, the path of the logs is %systemdrive%ProgramDataMcAfeeDesktopProtection, while in all other versions of Windows these logs exist in %systemdrive%Documents and SettingsAll UsersApplicationDataMcAfeeDesktopProtection. The product guide is available at the following link:
GO GET IT ON THE WEB
Six log files are stored in the log directory, as listed in the following table. Note that if VirusScan is managed with McAfee ePolicy Orchestrator (ePO), these files may have an “ePO_” prefix before the file names listed.


We find that the OnAccessScanLog.txt and OnDemandScanLog.txt log files are typically the most useful. Those logs will have evidence of the files that VirusScan has either quarantined or deleted from the system, along with the name of the detected threat. McAfee provides a threat intelligence portal where analysts can obtain more detailed information about threats detected by VirusScan and other McAfee products:
GO GET IT ON THE WEB
In addition to the text logs, McAfee also logs virus detections to the Windows Application event log with Event ID 258 and a source of McLogEvent.
Next, let’s look at how McAfee stores quarantined files and how you can decode them.
Quarantine Files
McAfee VirusScan creates quarantine files with a .bup (BUP) extension. In a default installation, these files reside in the %systemdrive%Quarantine directory. The BUP files contain any malicious artifacts cleaned by VirusScan and consist of two parts: metadata about the files in the BUP container and the actual artifacts themselves. Each of these parts is XOR encoded with 0x6A and then compressed into the OLE compound file format in recent versions of VirusScan.
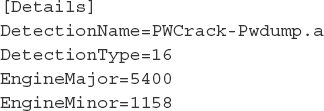
To extract the quarantine files, open the BUP file with a utility that supports OLECF file decompression, such as 7-Zip. Once parsed, the BUP file should contain files named Details and File_0, where Details contains the metadata about the quarantined file and File_0 is the actual quarantined file. Using a hex editor such as McAfee FileInsight, you can decode the quarantine files and restore the original file for further analysis.
An example of the decoded Details metadata is shown next. This shows the detection time as well as the original name of the quarantined file, which in this case is C:Windowssystem32pwdump.exe.
Trend Micro OfficeScan is another antivirus suite that we commonly encounter when responding to incidents in an enterprise. Like with both Symantec and McAfee, an administrator can remotely manage this security suite, but it also stores evidence of detected malicious activity locally on a host. You can read more about Trend Micro at the following product website:
GO GET IT ON THE WEB
Log Files
Trend Micro OfficeScan stores information about detected threats in a file named pccnt35.log, located in the Misc subdirectory of the OfficeScan installation directory. This log file is plain text and includes seven values separated using <;> as a delimiter. The following table lists the details of the fields included in this file, as described in the Trend Micro OfficeScan 10 Report Objects Reference Guide:
Field |
Description |
Date |
Date stored in the format YYYYMMDD |
Time |
Client local time of the event in HHMM format |
Infection Name |
Name of the signature corresponding to the infection |
Scan Results |
The results of the event. The codes for this field are:
0: Cleaned successfully.
1: Moved successfully.
2: Deleted successfully.
3: Renamed successfully.
4: For real-time scans it’s “pass > deny access.”
5: Clean failed.
6: Move failed.
7: Delete failed.
8: Rename failed.
10: Clean failed (moved).
11: Clean failed (delete).
12: Clean failed (rename).
13: For real-time scans it’s “pass > deny access.” For other scans, it’s “passed.”
14: Clean failed (move failed).
15: Clean failed (delete failed).
16: Clean failed (rename failed).
25: Passed (OKed) a potential security risk. |
Scan Type |
The type of scan. The codes for this field are: |
0: Manual scan |
|
1: Real-time Scan |
|
2: Scheduled Scan |
|
3: Scan Now Scan |
|
4: Damage Cleanup Service (DCS) Scan |
|
Not Used |
Field Not Used |
Path |
Path to infected file |
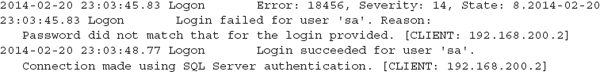
Here is an example of a log entry from Trend Micro OfficeScan:
This entry shows that a file named C:WINDOWSsystem32pwdump.exe was detected with the signature HKTL_PWDUMPBD and cleaned successfully on May 01, 2013 at 10:59 (machine local time) during a real-time scan.
Quarantine Files
In a default installation, Trend Micro OfficeScan stores and encrypts quarantined files in a subfolder in the installation directory named SUSPECT. Trend Micro provides a tool named VSEncode.exe that will allow an administrator to decrypt these quarantine files and restore the contents.
To use the VSEncode.exe utility to decrypt the quarantine files, create a text file listing of the files you want to decrypt. In this file, specify the full path to the quarantined files, one per line, and save the file as an .ini or .txt text file. Once this file has been created, run the following command, where <configuration_file> is the path to the file list that was created:
This will decrypt the files listed in the configuration and allow you to perform analysis on the detected malware. Trend Micro provides additional information about restoring quarantined files at the following site:
GO GET IT ON THE WEB
WEB SERVERS
When a company’s home page is defaced, a hacktivist SQL injects a magazine’s website, or a botnet brings down a credit card processor’s portal, there is certainly a web server involved. Web servers are used to deliver most of the Internet’s contact, and accordingly, we often encounter web servers during investigations. Effectively using the evidence from a web server requires an understanding of basic web protocols, relevant configuration files, and associated log files. In this section we cover two of the most common web server solutions that we encounter: the Apache HTTP server and Microsoft Internet Information Services (IIS). Before we examine specific web server solutions, let’s cover some general information about web servers.
Web Server Background
Web servers receive and respond to requests from clients, such as web browsers, using the Hypertext Transfer Protocol (HTTP). The two protocol commands (called methods) that are the most used are GET and POST. GET requests are commonly used to retrieve content from a web server, whereas POST requests are commonly used to upload data. Web servers can be configured to listen on any TCP port, but by convention, HTTP clients connect to servers on TCP port 80 when the traffic is unencrypted and to TCP port 443 if they are using the Secure Socket Layer (SSL).
When web servers were first created, they simply mapped requests from clients to files in a specific directory and provided a response. Today, web servers and the HTTP protocol have many more capabilities. One capability that is important to know about is the concept of a virtual host. This feature handles content for multiple, unrelated websites through a single web server—all using the same TCP port and the same IP address. The virtual host capability allows a single system running just one instance of an Apache server to host hundreds or even thousands of separate websites. When you respond to a compromised web server, you must keep this in mind—actions you take could affect all of those websites, some of which may not be a direct part of the incident.
The HTTP protocol provides many more extensive capabilities. If you want to read more about the HTTP protocol, see Request for Comments (RFC) 2616, at the following link:
GO GET IT ON THE WEB
However, what you’re here to learn is how you can take advantage of evidence web servers can provide during an investigation. There are two major sources of evidence from web servers: log files and the web server content. Let’s talk about log files first.
The log files for Apache and IIS are in plain text, though each has its own format. By default, most web servers will log a summary of each request—including the IP address of the client, the URL requested, the HTTP method, and the server result (success, error, and so on). Web server logging can be customized, and each solution has unique details available. In most cases, default logging is sufficient to help an investigation. The most common searches we perform against web server log files are
• Requests during a specified time frame
• Requests to or from certain IP addresses
• Requests for specific URLs
• Requests containing a given User-Agent string
Sometimes we perform statistical or other types of analysis in an attempt to identify anomalous activity. Some of those techniques are discussed in the next chapter.
In an enterprise environment, we sometimes find that load-balancing mechanisms “mask” certain details from a web server. Because load balancers act as a proxy for the client, the web servers only communicate directly with the load balancers. This causes the web servers to record the IP address of the load balancer instead of the actual client that made the request, which may prevent you from tracing back malicious activity. In some cases, you can address this problem by examining the load balancer logs. However, it may be difficult to correlate activity in the web server logs with activity in the load balancer logs. A good solution is to configure the load balancer to “pass through” some details about the client in the request, most commonly in the form of an HTTP header called X-Forwarded-For (XFF). You can then configure the web server to log the XFF header with each request. If you have load balancers for web servers in your environment, we encourage you to proactively obtain a sample of logs so you can work through these issues ahead of time. A common load balancer we encounter is BIG-IP by F5. Some guidance on how to deal with this problem is provided in the following article:
GO GET IT ON THE WEB
The second major source of evidence is the web content—the files on the web server that make up the website. During an incident that involves a web server, it’s common for an attacker to exploit or modify existing web pages, or even upload some of their own, such as webshells or other tools. You will need to examine those files to determine what the attacker was doing. Most content is in plain text, so you can view the files in any text editor. However, sometimes the files may be compiled executables or obfuscated scripts. In those cases, the techniques we describe in Chapter 15 may be of help.
The location of web server logs and content varies widely. There are defaults that we commonly find in use, but you should always examine the local configuration to be sure you don’t miss anything. We cover the evidence location details about Apache and IIS in the following sections.
Apache HTTP Server
The Apache web server is an open source web server started in 1995 that quickly gained popularity and now hosts the majority of websites across the world. Most organizations deploy Apache on Unix-like operating systems such as Linux or BSD, but Apache also runs on Microsoft Windows. Because Apache is free, robust, and feature rich, we find it at small companies and large corporations alike. You can read more about or download the Apache HTTP server from the Apache website:
GO GET IT ON THE WEB
Let’s talk about the first area you will be interested in—configuration.
Configuration
The core server component is a simple HTTP server; however, modules can extend its functionality to support features such as server-side programming languages, encryption, and custom authentication. There are also many configuration directives that affect logging and behavior of the server itself. Because the configuration directives change over time, it’s best to do research in the “Documentation” section of the Apache website. However, we will touch on a few items of particular importance in this section:
• Configuration file names and locations Common names of the Apache configuration file are httpd.conf, apache.conf, and apache2.conf. In Unix environments, common configuration file locations are /etc, /etc/apache, /etc/apache2, and each of those paths use /usr/local as a prefix. If you do not find one of these file names on the web server, you can attempt to find it by searching files on a system for common configuration directives: ServerRoot, DocumentRoot, and LogFormat. Apache also provides a feature that allows specifying configuration directives in a file named .htaccess. The directives are applied to the directory, and all subdirectories, where the .htaccess file resides. Although their use is discouraged, .htaccess files are common.
• Log file names and locations The default log file names are access.log and error.log. Most Unix environments have third-party tools installed that cycle these log files, so you may find those names with an extension of .<number> or .<number>.gz, such as access.log.1 or access.log.32.gz. In a Unix environment, common Apache log directories are /var/log/httpd, /var/log/apache, and /var/log/apache2. Because logging may be customized, you should search for CustomLog and ErrorLog directives in the Apache configuration files to determine where logs are stored. You should also examine any LogFormat directives to verify the fields that are logged for each log format.
• Content locations In Unix environments, a common default content location also called a web root, is /var/www. However, web roots are often changed. At a minimum, you will need to search all configuration files for ServerRoot and DocumentRoot directives, which specify the locations of content. However, finding all locations that could provide content is difficult because of all the features the Apache server supports. It’s best to work with the web server administrator to help ensure you identify all the content locations.
Apache writes to configured log files in the format specified until a system limitation is reached, such as running out of storage space. In other words, Apache has no default log file size limit or log rotation, though many deployments implement a third-party tool to perform rotation. If a log file exists when the Apache service is started, Apache appends to the log file—previous contents are unaffected.
One last configuration-related item is the X-Forwarded-For issue we mentioned earlier. With Apache, it’s quite simple to log any HTTP header. In this case, simply add %{X-Forwarded-For}i to your LogFormat definition and then restart the Apache service.
Log Files
Apache stores its log files in plain text. The format is customizable, and is specified in the Apache configuration file. The most common formats we encounter are Common Log Format (CLF), referred to as “common,” and NCSA extended/combined log format, referred to as “combined.” The following is an example of a typical Apache log entry in combined format:
In this example, a client with the IP address 172.24.13.37 performed a GET request for the URL /download/2014021.txt, which returned 1,330 bytes of data. The Apache server responded with code 200, which means the request was successful. Fields with no corresponding data are indicated with a minus sign. Additional sample requests and more detailed breakdowns of the corresponding fields are provided on Apache’s website:
GO GET IT ON THE WEB
Microsoft Internet Information Services (IIS)
Microsoft’s IIS, formerly Internet Information Server, was originally created as a supplemental package for Windows NT 3.51. Then Microsoft incorporated IIS as an optional Windows component with the release of Windows NT 3.51 Service Pack 3 (SP3). IIS has been a part of nearly every release of Microsoft Windows since then, although IIS is not installed by default on most non-Server versions of the Microsoft operating system. Initially, IIS enjoyed greater popularity than Apache. Since mid-1996, however, Apache surpassed IIS in overall market share of global public websites. Nevertheless, we encounter IIS quite often, although it’s debatable whether that’s an indicator of popularity or of something else. You can read more about IIS and download the free version (named IIS Express) at the following website:
GO GET IT ON THE WEB
Configuration
IIS is normally configured through the Windows control panel under Administrative Tools | Internet Information Services Manager. However, you may not have access to the IIS control panel to be able to view the current settings. If you have access to the file system, most of the settings relevant to an incident responder are saved in an XML-formatted configuration file named applicationHost.config in the directory %systemdrive%system32inetsrvconfig. This file will list the site name, site ID, web root, and log file path for each configured IIS site. The following is an excerpt from an IIS applicationHost.config file:

Important elements to note are site, virtualDirectory, logFile, and binding. The “site” provides an ID (in this case, 1). The ID is used as the last character of the log directory name, which will be a subdirectory of the directory specified by logFile. Therefore, in this configuration, the log directory name will be %SystemDrive%inetpublogsLogFilesW3SVC1. The virtualDirectory tells you the directory where the web root is located (%SystemDrive%inetpubwwwroot for this site). The values in this example are defaults for a typical IIS installation.
The default IIS log file naming convention is ex<yymmdd>.log, where <yymmdd> is the current two-digit year, month, and day of month. For example, a log file for February 20, 2014 would be named ex140220.log. Beginning with IIS version 7, log files are encoded in UTF-8 by default. IIS adds a “u_” to the beginning of the file name (for example u_ex140220.log) to indicate this. By default, IIS will roll over logs each day, but that is configurable to weekly, monthly, by file size, or to “never roll over.”
Finally, with IIS it’s a bit more complicated to deal with the X-Forwarded-For issue. We found a blog post that explains a number of options, including enabling IIS Advanced Logging and installing custom IIS modules:
GO GET IT ON THE WEB
Note that when Advanced Logging is used, IIS will default to storing those logs in a different directory, %SystemDrive%inetpublogsAdvancedLogs. You can read more about Advanced Logging at the second link we provided.
Log Files
IIS log files are recorded in the W3C Extended Log File Format. This format is plain text, although beginning with IIS 7, the log is encoded with UTF-8 and therefore may contain Unicode characters. The fields are customizable, and the defaults may change between versions of IIS. The beginning of the log file contains informational entries that begin with a hash symbol and indicate the version of IIS, the date the log was started, and the fields that are being logged. Actual requests will appear after the informational lines, as shown in the following example from an IIS 8.0 log file:

If may be difficult to see here due to the long lines, but there are five entries in this log file. The first four begin with a hash symbol and provide information about IIS and the format of the log file. The fifth entry is a GET request from a client with an IP address of 172.24.13.37 for the URL /download/2014021.txt. You can read descriptions of each field, and how to choose which are logged, at the following link:
GO GET IT ON THE WEB
Now that we’ve covered web servers, let’s move on to the next area—database servers.
DATABASE SERVERS
Databases are a critical part of nearly all modern enterprises. Sometimes they are not very obvious, because the database may be integrated with another product and is not installed as a dedicated server. We’ve performed investigations where the application owner was not even aware there was a database supporting their system. But you can be sure an attacker will know about the database, if that’s what they are after. During our investigations, we’ve found several common sources of evidence from a database:
• Client connection logs Most databases log when a client attempts a connection, including details such as the date, time, and the source IP address. This information is useful when you are trying to answer a question such as “Did the attacker connect to this database?”
• Error logs Error logs are also common, and typically include occurrences of malformed queries, database crashes, security violations, and other critical errors. If an attacker attempts to brute force their way into (and around) a database, error logs frequently contain useful information.
• Query logs The basic service a database provides is the ability to perform queries against a set of data. Those queries can extract, modify, or add information. Most databases have the ability to log those queries; however, due to the performance overhead, query logging is not typically enabled. You can examine query logs to find the queries an attacker executed, which will help you to determine what the attacker was trying to accomplish.
• Database storage Most database systems store data in a number of files. During an investigation, you may want to preserve the database by making a copy of the database files. However, depending on the database system, it may not be quite that simple. Some database systems use “raw” storage methods—proprietary methods to manage one or more storage devices at the physical level.
A database and its supporting systems can be highly customized, so whenever you need to obtain copies of log files or preserve database storage, it’s best to work with the local database and system administrators.
The most complicated task related to databases and incident response is analyzing the database itself. You will want to avoid doing this on a production system, because you will likely modify evidence and you may incur damages. The best option is to restore a copy of the database on a separate system.
In this section we cover the three databases we most commonly encounter: Microsoft SQL, MySQL, and Oracle. Be warned, however, that if all you know about databases is what you read in this section, you only know enough to be dangerous. We encourage you to learn more about each of these databases on your own and work closely with an experienced database administrator. You can download, install, and experiment with any one of these databases at the following links:
GO GET IT ON THE WEB
Microsoft SQL Express www.microsoft.com/en-us/sqlserver/editions/2012-editions/express.aspx
MySQL dev.mysql.com/downloads/mysql
There are a few good places to start learning more about databases with respect to incident response and forensics. The first is to use a major search engine and search for “<database name> forensics,” where <database name> could be Oracle or any other database you are interested in. That search will reveal blog articles, whitepapers, and books that will help get you started. Next are a few resources we’ve found particularly useful to start with:
GO GET IT ON THE WEB
airccse.org/journal/cseij/papers/2312cseij03.pdf
For a much more in-depth discussion of databases and forensics, we recommend the book SQL Server Forensic Analysis, by Kevvie Fowler.
Now let’s look at the three database solutions we mentioned earlier—Microsoft SQL, Oracle, and MySQL. We’ll cover where you can find client connection logs, error logs, query logs, and where the databases are actually stored on disk. Let’s start with Microsoft SQL.
Microsoft SQL
Microsoft SQL, or MSSQL, is a popular commercial database solution. Microsoft makes both paid and free versions of the MSSQL database. The free version is called SQL Server Express. Both versions share much of the same capabilities, although the Express version has limitations such as a much lower maximum database size and memory use. Most of the configuration options for MSSQL are set or viewed through the Microsoft SQL Server Management Studio (SSMS). SMSS is packaged with MSSQL, both paid and free Express versions.
MSSQL does not maintain a historical log of client connections by default; only failed connections are logged to a file by default. To enable logging of successful logins, connect to the database with SMSS, right-click on the server in the object explorer, and select Properties. Next, select the Security page, and under Login Auditing, choose the Both Failed and Successful Logins option. The login auditing is saved in a file named ERRORLOG in the Log directory of the SQL server instance. The default location of the file on SQL Server 2012 is C:Program FilesMicrosoft SQL ServerMSSQL11. MSSQLSERVERMSSQLLogERRORLOG. The ERRORLOG will also contain MSSQL server errors. You can read more about how to determine where MSSQL stores files, including the ERRORLOG, at the following links:
GO GET IT ON THE WEB
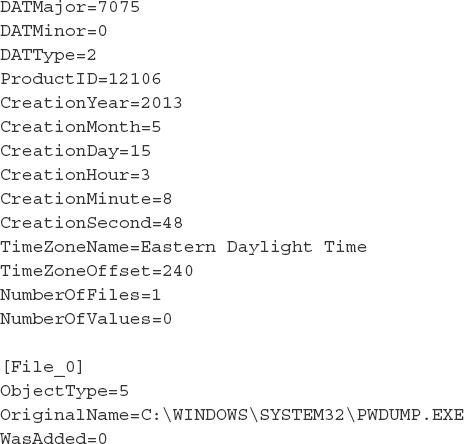
The following is a sample of ERRORLOG entries indicating a failed and then a successful attempt to connect. In this case, the errors are for the user “sa” (known as the system administrator), who typically has full privileges to a database system:
Alternatively, SMSS allows you to direct the login auditing events to the Windows Security or Application log—which may be a better option because the ERRORLOG is rotated when the SQL server restarts.
Once you are able to see when a user is connecting to the database, the next question is to answer what they did. If an attacker is stealing data through a SQL connection, they are most likely performing select statements. MSSQL, like most other databases, does not log SQL queries by default. The easiest way to log select statements is through what most people refer to as a “server-side trace.” You’ll have to be careful with enabling any trace, because the trace can incur a large processing overhead that may severely affect overall database performance. A very good blog post that walks through setting up and viewing a server-side trace for select statements is available at the following link:
GO GET IT ON THE WEB
In some cases, you may need to preserve database files while the database is still in operation. The normal means would be through forensic image of the drive containing the database files. The files that store actual MSSQL database content have extensions of .mdf and .ldf. The MDF files are the primary database files, and the LDF files contain transaction log data. These files are stored in a directory named Data within the MSSQL server instance directory. While the database instance is running, the files are locked and you cannot copy them through normal means. If you cannot stop the running instance, you can use the SMSS to perform a backup or export of the data—but this is more of a last resort method, because there is more of a chance of altering evidence.
MySQL
MySQL is a very popular open source database that runs on Linux, Unix, and Windows. The MySQL configuration file, typically named my.cnf or my.conf, will indicate what logging is enabled, where the log files are, and the location of database storage. The configuration file is normally in /etc, /etc/mysql or one of those directories under the /usr/local directory. The following table lists configuration settings that will be important to us:
Directive |
Description |
log_error |
Full path and name of the error log file |
general_log_file |
Full path and name of the general activity log file, which records events such as client connections and queries |
general_log |
Boolean that enables or disables general_log_file (1 = enable, 0 = disable) |
datadir |
Directory that holds MySQL database data files |
A common log file location under Linux is the /var/log/mysql directory. In most default deployments of MySQL, the only log that is enabled is the error log. The error log records critical errors and significant informational events, such as server startup and shutdown, or database crashes or malfunctions. The most useful logging comes from the general log. However, the general log may have a severe impact on performance due to the logging overhead. The following record is an example of what the general log records for a select statement:
In this example, on February 20, 2014 at 20:14:03, the database user “root” connected from 192.168.200.2, used the database named “cards,” and performed the following SQL query:
Additional details on MySQL server logs and the general query log are available at the following links:
GO GET IT ON THE WEB
MySQL data files are stored in the directory specified by the datadir configuration directive. MySQL can use a number of database file storage formats, although the MyISAM and InnoDB formats are the most common we encounter. If you need to preserve MySQL database files, the most ideal way is to gracefully shut down the server and collect a forensic image. On a running system, the most ideal method is to temporarily shut down the MySQL service and make a copy all of the files in datadir. If you cannot shut down the MySQL service, you can perform a backup using the mysqldump command. The full command reference, with examples, is available on MySQL’s website:
GO GET IT ON THE WEB
Oracle
The Oracle database is another commercial database that we commonly encounter during investigations. The Oracle database runs on Windows, Linux, and a number of Unix platforms. Oracle provides free versions of their database, under a restricted license, for development purposes. Let’s look at what Oracle can provide you in terms of client connection logs, error logs, query logs, and database files.
Oracle databases use the Transparent Network Substrate (TNS) listener to handle connections. By default, the tns listener maintains a log file that records details about each client connection—note that this is a connection, not authentication. The log file name is listener.log, and in Oracle 12c, the file is in the Oracle app install directory under diag nslsnr<instance name>listener racelistener.log. The tns listener also maintains an alert log in XML format named log.xml, which in Oracle 12c can be found in the directory diag nslsnr<instance name>listeneralertlog.xml. The alert log will contain references to traces and dumps, if any are performed. The following is an example of a successful connection to an Oracle 12c database:
In this event, a connection was made to the tns listener from the IP address 192.168.200.2. The PROGRAM, HOST, and USER are all specified by the database client that is making the connection. The username is not the username the client is trying to log in as—it’s the username on the remote system (in this case, Bob). Again, this listener.log event does not indicate actual success or failure to authenticate to the database; it is only a connection to the tns listener. To determine the username if authentication was successful, auditing must be enabled on the system.
Oracle auditing is required to log the details of connections and queries. As with other database systems, we rarely find auditing enabled due to the performance impact. Auditing in Oracle is complex, and the capabilities and procedures are different with each version of Oracle. Because we don’t have room in this book to cover everything, it’s best that we not attempt to provide those details here. However, for those who are interested, the following Oracle documentation sites provide a good starting point. We’d also recommend consulting with an experienced Oracle database administrator.
GO GET IT ON THE WEB
Finally, the Oracle database files are located under a directory named ORACLE_BASEoradata, where ORACLE_BASE is defined in the location Oracle configuration. In Windows, the ORACLE_BASE is stored in the registry, under HKEY_LOCAL_MACHINESOFTWAREOracle. The ORACLE_BASE key is stored in a subkey that corresponds to the version of Oracle (for example, Oracle 12c uses the subkey KEY_OraDB12Home1). Under Linux or Unix variants, the ORACLE_BASE directory is commonly defined as an environment variable for the user the database runs as—for example, the file /home/oracle/.bash_profile may contain a line such as export ORACLE_BASE=/u01/app/oracle. Each database instance will store its files in a directory under oradata that is named the instance name. You can also search for files with a .dbf extension, which is the default file extension of Oracle database files. Oracle provides additional information about locating Oracle database files at the following link:
GO GET IT ON THE WEB
Effectively tracking an attacker requires visibility throughout your enterprise. Enterprise services generate logs that are a critical part of visibility. Therefore, we encourage you to discover all of the services in your enterprise—security or otherwise. Determine whether they can provide you with useful information. If they can, centralize collection and develop efficient search and analysis methods. Going forward, you can stay ahead of the game by keeping in close touch with the branches of your organization responsible for researching and deploying new technology.
QUESTIONS
1. What are some common ways you might discover services or applications that are helpful to an investigation?
2. Are network services such as DHCP critical to incident response? If DHCP logs are not available, how might you still determine what system an IP address was assigned to?
3. Your company recently deployed a new application across the enterprise. The application is a new disaster recovery tool that automatically backs up data from users’ systems to a central server. The backup data is encrypted, but the backup software maintains a local log file in plain text. How might this service be of use to incident responders?
4. In this chapter we mentioned “booting a copy of a forensic image.” What are we talking about? Describe the tools and methods to perform that task.
..................Content has been hidden....................
You can't read the all page of ebook, please click here login for view all page.