
Chapter 8
Evolutionary Ecology of Cancer
8.1 Introduction
In Chapters 2 and 3 we explored the foundations of two major themes in mathematical oncology—one stemming from the pioneering work of Laird and her application of the Gompertz formalism to tumor growth, and the other originating with Greenspan’s extension of the PDE approach taken simultaneously by Burton, Thomlinson, and Gray. In this chapter we continue our exploration of these themes in a more modern setting. However, since both themes unleashed floods of research with rivulets in many different directions, we limit ourselves to theoretical attacks on how two important characteristics of cancer arise—necrosis and tumor cell diversity.
Modern cancer research has tended to focus on genomics. However, an adequate theory of cancer must recognize that tumor behavior is at least as much an ecological and evolutionary problem as a molecular one. Natural selection has long been recognized as the ultimate driver of cancer progression and pathogenesis (see [52] for a recent review; see also [133]). In early stages of tumor progression, heterogeneous populations of malignant and healthy cells compete for available resources. Tumor cell clones that have acquired, via mutation and epigenetic effects, malignant “hallmark” phenotypes [56, 57] gain proliferative and (or) survival advantages relative to other lineages in their tumor microenvironment. Eventually the hallmark-carrying mutant clones come to dominate the tumor and destroy tissue homeostasis. If this interpretation is correct, then the mechanism causing malignancy—heritable variation conferring advantages to particular clonal lineages—is precisely evolution by natural selection.
Host physiology and the tumor microenvironment are critical because they largely generate the selection pressures acting within the tumor at any given time. Therefore, any accurate theory must also include interactions among a variety of genetically distinct tumor cell types, perhaps genetically altered stromal cells, and unmutated healthy cells, both peritumoral and distant. Although these interactions certainly are influenced by genomes, all genomes, both cancerous and healthy, interacting within the tumor’s “ecosystem” are involved.
Although cancer theory derived from molecular and cellular biology largely ignores evolutionary and ecological relationships, the same cannot be said for theory developed by mathematical and computational biologists, who for the last thirty years have produced an enormous variety of mathematical models of malignant neoplasia. Given the complexities of the problem, most of this work has concentrated on simulations and computational treatments and therefore lies somewhat outside the scope of this text. Therefore, in this chapter we focus on seminal dynamical models that can be used as a springboard into the rapidly expanding study of evolutionary oncology, or the evolutionary ecology of tumors. Also, although evolution by natural selection is well-recognized as an important process during tumor treatment, we explore those relationships in the treatment chapters.
8.2 Necrosis: What causes the tumor ecosystem to collapse?
Malignant tumors in vivo and, as we saw in Chapter 3, multicell spheroids in vitro often develop regions of necrosis in which large portions of the tissue dies (Fig. 8.1). Necrosis in multicell spheroids (MCSs) is typically ascribed to “lack of nutrient,” as Burton and others originally hypothesized (see Chapter 3). Nutrient depletion occurs in the spheroid core as cells continuously consume whatever the nutrient is, but its only source is the spheroid’s surface. As we mentioned in Chapter 2, tumors in vivo avoid this problem by enticing new blood vessels to grow within them through a process called an-giogenesis. Nevertheless, tumors in vivo still can develop necrosis (Fig. 8.1). Various hypotheses have been presented in the mathematical and theoretical literature to explain in vivo necrosis. Possible immediate causes include deficiencies in oxygen, glucose, or perhaps other nutrients, such as phosphorus [38, 69] or iron [34, 59, 72, 107]. Some researchers suggest that inhibitory chemicals, which could be metabolic waste or other compounds, might play a role. Still others implicate mechanical destruction of cells. At one level removed from the immediate cause, if nutrient deficiency, toxin production, or both are to blame, local ischemia is almost certainly involved. But then what causes the ischemia—inefficient neoangiogenesis (the tumor “outgrowing” its blood supply), blood vessel collapse, variation in hematocrit distribution in a microvascular net, or some combination of the three? All of these hypotheses have been the subjects of mathematical investigations.
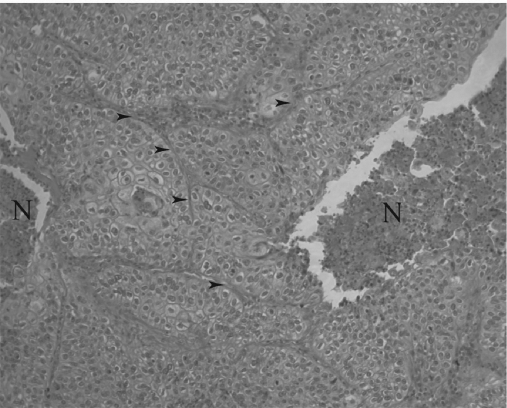
Squamous cell lung cancer, H. & E. stain, 100× original magnification. Regions labeled “N” are necrotic, and arrows point to examples of extracellular matrix (ECM). Dark dots in the necrotic regions are mostly immune cell nuclei, primarily of neutrophils. Note how cancer cells form deranged sheets reminiscent of epithelium but with a highly disturbed architecture.
8.2.1 Necrosis in multicell spheroids
The obvious hypothesis explaining the characteristic histological pattern in MCSs—that cells in the interior die or stop reproducing because they suffer a profound lack of nutrient caused by diffusion limitation and competition (Fig. 3.1)—is compelling but probably too simple. The Greenspan model introduced in Chapter 3, for example, introduced the notion that necrosis could be caused by accumulation of some toxin within the spheroid. This model has been instrumental in refining the diffusion-limitation hypothesis. In parallel with these studies, another formalism developed from the Thomlinson and Gray work that also has been used to probe diffusion limitation. This set of models focuses on tumor cords, essentially spheroids turned inside-out. Below we outline some of the main results from both types of models.
Among the more influential research threads using multicell spheroids to study necrosis is a series of papers by Helen Byrne and Mark Chaplain [26, 27]. These models represent a small spheroid, which Byrne and Chaplain interpret as a tiny in vivo tumor. The first of these models [26] assumes that no necrotic core exists and takes the following form under the quasi-steady-state approximation of diffusive equilibrium for both the nutrient and inhibitor:
where R is the radius of the spheroid; S(σ, β) is cell proliferation rate; D1 and D2 are diffusivities of nutrient and inhibitor, respectively; Γ measures vascular delivery of nutrient; σB is concentration of nutrient in the blood plasma; g1 and g2 represent sources and sinks of nutrient and inhibitor, respectively, within the spheroid; and all other notation is consistent with that in Chapter 3. Byrne and Chaplain subsequently apply Buron’s original hypothesis that necrosis occurs whenever the nutrient concentration falls below some critical value to obtain this model [27] :
with N the rate at which necrotic cells disintegrate and γ1 and γ2 the rates at which the inhibitor decays within the proliferative and necrotic regions, respectively. All other notation is as before, with one exception—in model (8.2), Γ represents the consumption rate of nutrient by living cells. Furthermore, nutrient is delivered to the interior by diffusion from the media or interstitium, not through an interior vascular network as in (8.1). There is no quiescent layer in either model.
Among the advances introduced by models (8.1) and (8.2) is a more realistic action for the inhibitor than that proposed by Greenspan. Instead of causing quiescence, the inhibitor is hypothesized to increase cell mortality within nonnecrotic regions of the spheroid, which Byrne and Chaplain equate to apoptosis. Therefore, S(σ, β) is interpreted as pointwise differences between births and deaths and generally increases with σ and decreases with β. This hypothesis allows richer dynamics than Greenspan’s model. Of particular importance, model (8.1) shows that spheroids can reach a steady state without necrosis. (See [32, 42] for more details.) In fact, a sufficiently large apoptosis rate can cause complete spheroid regression without development of a necrotic core in both models. Model (8.2) also predicts that spheroids with a necrotic core arise only if loss to apoptosis is less significant than loss to necrosis and if the external oxygen concentration is not too large. More precisely, they show that for a particular realization of g1 and g2, the width of the proliferating rim is proportional to , where σ∞ is the nutrient concentration in the media and σl is defined above.
More recently, Davide Ambrosi and Francesco Mollica [6, 7] modeled nutrient deficiency in multicell spheroids cultured either free in suspension or embedded in agarose. These models introduce mechanical stress generated within the tumor and externally through the agarose gel under the assumption of an elastic spheroid. As in the previous models, nutrient is assumed to diffuse into the spheroid from the media very rapidly relative to cell proliferation rates. Since Ambrosi and Mollica imagine the nutrient to be a storable form of energy to power cell proliferation, one can interpret it as glucose. They assume that glucose determines reproductive potential of cells within the spheroid. In particular, if we let n be the nutrient concentration and g be the growth potential (birth rate minus death rate) at a certain point within the spheroid, then g is an increasing linear function of glucose concentration such that g(n, ·) < 0 for 0 ≤ n < n0 < ∞, reflecting the dominance of deaths over births in low-glucose environments. In addition, g decreases with a measure of stress on the cells.
The complexity of Ambrosi and Mollica’s formalism takes a complete description of their model outside the scope of this chapter. However, their results are of interest. Numerical investigations show that the spheroid naturally develops an outer proliferative rim with a core dominated by lack of nutrient. Predictions about necrosis per se cannot be made from their analysis, because they chose n0 = 0. However, their formalism hints at the possibility of combining the nutrient-deficiency and mechanical-deformation hypotheses (see Section 8.2.4) into a single model, which promises an incisive instrument to tease these two hypotheses apart.
8.2.2 Necrosis in tumor cords
The tumor cord is a concept introduced around the same time that theorists started modeling multicell spheroids [61, 129]. In essence, the tumor cord turns the spheroid inside-out, placing the source of nutrient in the center, and transforms it from a sphere to a cylinder. The cord itself is a sleeve of tumor tissue surrounding a microvessel, which supplies nutrients and waste removal services. The outer portion of the cord is often necrotic (Fig. 8.2). Tumor cords can be observed in certain regions of certain tumors (see [64] for example) but not all (see Fig. 8.1 for example).
![Figure showing idealized section of a tumor cord. The middle tube represents a microvessel with radius r0. Surrounding the vessel is a sleeve of living tumor tissue with outer radius R that is further surrounded by a necrotic rind of radius B. (Based on Fig. 1 of [16, p. 163]).](http://imgdetail.ebookreading.net/math_science_engineering/24/9781498785532/9781498785532__introduction-to-mathematical__9781498785532__image__fig8-2.png)
Idealized section of a tumor cord. The middle tube represents a microvessel with radius r0. Surrounding the vessel is a sleeve of living tumor tissue with outer radius R that is further surrounded by a necrotic rind of radius B. (Based on Fig. 1 of [16, p. 163]).
Recently, Alessandro Bertuzzi, Alberto Gandolfi, and their colleagues [15, 17, 18] (reviewed in [16]; see also [37]) have studied tumor cords theoretically. In their models, we imagine a rigid-walled capillary of radius r0 surrounded by a cylinder of tissue. The maximum (fixed) width of the cord is R. In later work, they also introduce a necrotic rind of outer radius B. As in the spheroid models of Chapter 3, surface tension and incompressibility of cells and interstitium maintain the cord’s shape, and the tissue can exist as a mosaic of both proliferative and quiescent cells. The rate at which cells become quiescent decreases with local nutrient concentration. However, a distinct annulus of quiescent cells can arise when nutrient concentration falls below a prescribed threshold. In some of these models, the active cell population is structured by age. Within the tissues, both living and necrotic, the volume is entirely exhausted by three components: living cells (νp), necrotic cells (νn), and extracellular space (νe). Cell packing is assumed to be homogeneous (νe and νp + νn + νe are constants).
These assumptions lead Bertuzzi et al. [15] to a model that really consists of two submodels for the cell dynamics. The first, expressed generally as
describes dynamics in the region of living tissue (r0 < r < R). The second,
valid for R < r < B, models the necrotic region, because no living cells are present there (νp ≡ 0). The vector u represents a cell velocity field that arises as cells push on one another as they reproduce or are squeezed together as some die. If one assumes that this motion is confined to the radial plane in a perfect cylinder, then u = u(r), where r is the radial position. In addition, χ(σ) is the per-capita proliferation rate, which depends on nutrient concentration σ; µ(σ) is the “natural” mortality rate; and µn and µ̃n represent the disintegration rate of necrotic cells in living tissue and the necrotic rind, respectively. The additional death terms µc(c, t) and µr(σ, t) denote death rates from chemotherapeutics and radiation treatment, respectively, where c is the drug concentration. The dependence of µr on σ arises because the authors assume the nutrient is oxygen, and radiation-induced mortality is well known to depend on local O2 concentration [61].
Nutrient is assumed to move entirely by diffusion on a much faster time scale than cell velocity. Therefore, they assume that
where f depends on the diffusivity of O2 and the rate at which the tissue consumes it. Nutrient enters the cord only across the microvessel wall at a constant rate, reflecting blood O2 homeostasis. They also impose a no-flux condition for O2 at the outer cord boundary. As with the spheroid models, these authors assume that all cells become necrotic whenever O2 concentration falls below some threshold σn Cells enter a reversible quiescent state, modeled in χ(σ), if O2 drops below another threshold, σq > σn.
Interestingly, this model predicts that the boundary between necrotic and living tissue cannot always be identified as the point at which σ drops below σn. For example, suppose the cord sits at its steady-state radius with the demarcation of its necrotic region rn defined by σ(rn) = σn. Suppose further that a chemotherapeutic attack kills a large number of tumor cells. Afterward, competition for oxygen among survivors transiently slackens, and the cord begins to grow, pushing the necrotic region outward. Then for a short period the boundary of the necrotic region is determined by history and not by nutrient availability. One can therefore in principle use this model to predict the transient dynamics of a tumor cord following cytotoxic treatment as a way to test the hypothesis that necrosis is caused by a lack of O2 or, with proper modification, some other nutrient. More mundane phenomena, in particular the size of the viable and necrotic sleeves as a function of O2 delivery, can be used for a similar purpose, at least in principle.
8.2.3 Diffusion limitation in ductal carcinoma in situ
Whole autochthonous tumors are often much more difficult to model than laboratory systems, such as multicell spheroids, or special in vivo systems, such as tumor cords or explants, because their geometries are usually much more irregular. However, breast ductal carcinoma in situ (DCIS) is something of an exception and so has attracted the attention of mathematical oncologists [41, 137]. By definition, this lesion is confined to the lumenal side of the duct’s basement membrane, which means it is usually forced to grow in a cylindrical shape around 700 µm in diameter on average [41]. Unlike tumor cords, however, nutrients are delivered to the cancer cells via diffusion from the external surface of the cylinder rather than a central blood vessel. (See also Chapter 7 for more on DCIS.)
A model of early DCIS by Susan Franks et al. [41], although including no explicit mechanism of necrosis, helps explain why some such lesions have a necrotic interior that others lack. In their investigation, Franks et al. imagine a tumor growing within a rigid-walled cylinder representing a milk duct. Tumor cell proliferation therefore generates pressures that force cells to move with velocity v(x) at point x. The portion of the model describing tumor volume and nutrient concentration takes the following form:
where n and m are densities of living and dead cells, respectively; ρ is the density of interstitial fluid; and c is nutrient concentration. Functions km and kd represent per-capita births and deaths, respectively. Generally, km increases with c, and kd decreases with c. Diffusion coefficients are represented as Di, i ∈ {n, m, ρ, c}, and β is the amount of nutrient required to produce a new cell. Dead cells never disintegrate, and living, nondividing cells do not consume nutrient. By assuming that the tumor mass is exhausted by living cells, dead cells, and interstitial material, they show that
They then complete the model by using Stokes’s law to derive expressions for intratumoral pressure.
This model produced no necrosis, because the duct diameter was so small that nutrient concentration favored proliferation over mortality everywhere in the tumor interior. However, the authors point out that allowing the duct wall to distend will decrease nutrient concentration in the tumor core, perhaps to the point where necrosis develops, as in comedocarcinoma [73], for example. The model could be extended to allow one to probe this scenario empirically, either in animal models or human histopathology samples, as a test of the nutrient-deficiency hypothesis.
8.2.4 Necrosis caused by mechanical disruption of cells
In distinct contrast to the nutrient-limitation hypothesis, Colin Please et al. [109, 110] hypothesize that necrotic regions form because cells are torn from their anchors to the extracellular matrix (ECM) and each other by pressures within the tumor. This mortality could arise either from literal destruction of the plasma membrane or apoptosis caused by loss of cell-ECM or cell-cell contact. The basic models [109] assume that the tumor’s interior consists of two “phases”—cells and interstitial fluid. (ECM is not explicitly modeled in these early explorations.) Please et al. assume that cell interiors are composed of the same material as the interstitial fluid; therefore, fluid moves between phases, entering cells through the process of proliferation and reentering the interstitium as dead cells disintegrate. The models are thereby controlled primarily by conservation of this fluid. The requirement for fluid conservation produces pressures within the tumor that cause both cell and fluid movement. For example, as cells proliferate, fluid entering the cell phase produces an “outward” pressure, pushing the cell phase outward. Cells move freely in response to this force, because unlike the previous models, cells in this system do not adhere to each other. On the other hand, pressures in the fluid phase force interstitial fluid to move among the cells as if the tumor were a porous medium. Therefore, two pressures must enter the model: (1) the pressure on the interstitial fluid (Pe) and (2) the pressure exerted cell-to-cell via the ECM scaffold (Pc). The intracellular pressure is not modeled.
If in any region within the tumor Pc > Pe, then the cells in that region feel a compressive force through the surrounding ECM. If the inequality is reversed, then cells are assumed to be torn apart as tension forces rip them from the ECM. Although Please et al. hypothesize that this form of cell destruction occurs only to physiologically stressed cells, as in hypoxia, in the model any cell in such an environment is destroyed. This, then, is the mechanism of necrosis under investigation.
Although nutrient deficiency does not cause necrosis here, nutrients still play a role. As before, the nutrient moves primarily by diffusion on a much faster time scale than cell kinetics, so the nutrient concentration, denoted C(x), is assumed to be in a quasi-steady state. Please et al. assume that cells proliferate at a rate proportional to the nutrient concentration and die at a constant per-capita rate; that is, at x the per-capita growth rate density is dC(x) − e. If we let k be the constant permeability of fluid through the inter-stitium and ϕ be the proportion of the tumor volume taken up by interstitial space, also assumed to be constant throughout the tumor, then the above assumptions can be modeled as follows [110]:
Consider the application of this model to a multicell spheroid. Again we assume perfect spherical symmetry and a nutrient diffusing into the spheroid from the external media (see [110] for the detailed boundary conditions). Then once again dynamics vary only over the radial position, so we can replace x with r defined in Section 8.2.1. In this case, the O2 concentration obeys the following relation:
with R0 and Ri defined as in Section 8.2.1 except that the necrosis condition is now Pc < Pe. In addition, the tumor and necrotic radii must satisfy the following conditions:
where α = e/dC(R0).
Superficially this model predicts observed spheroid behavior. Starting with a small spheroid, the radius grows exponentially until the moment a necrotic core begins to develop in the center. At that time, it enters a “linear” growth phase with a necrotic core eventually growing at the same rate, producing the proper histology. The depth of the proliferative layer will in general differ from that predicted by nutrient-deficiency models and can therefore be used to contrast the two hypotheses empirically.
Unfortunately, this model makes a disturbing prediction—in the absence of surface tension, the spheroid grows without bound. In fact, this result is general across choices of cell-growth models as long as cell proliferation is nondecreasing with oxygen concentration. However, Please et al. show in [110] that one can relax the assumption of inviscid cells and allow a (small) surface tension that can halt runaway growth. Doing so requires only the addition of the term 2Γ/R0 to equation (8.11), where Γ is a measure of surface tension.
Working from an extension [71] of the previous model, C. Y. Chen et al. [30] investigate the mechanical disruption hypothesis in spheroids growing in agarose gels. The gel is assumed to be elastic and therefore exerts pressure on the spheroid as it grows. Once again the tumor consists of cellular and extra-cellular fluid phases permeated by a nutrient, all of which obey the following relations:
where φ is the cellular volume fraction within the tumor (≡ 1 − ϕ for ϕ defined above); Uc and Ue represent velocity fields for cell and extracellular fluid, respectively; S denotes cell-growth rate; D is oxygen diffusivity through the tumor; Σ represents rate of nutrient consumption; and all other notation is defined earlier in this section. Following [71], Chen et al. include in the force balance equations hydrodynamic drag, hydrostatic forces in the interstitial fluid, and forces among cells transmitted by an ECM scaffold. In the nonnecrotic region, by definition Pc, > Pe and cells are maximally packed such that φ = φ0, φ0 a constant; however, in the necrotic core, Pe = Pc, but φ ≤ φ0.
The model becomes quite tractable if one limits the investigation to a perfect sphere, defines Σ(C) = 1, and sets
where α represents a lower O2 threshold below which cell death predominates and ρ is a positive constant representing sensitivity of cells to nutrient deficiency. With this definition of the growth function, spheroids obeying model (8.12) can develop three histologically distinct regions: a necrotic core, a middle annulus characterized by cell mortality dominating proliferation, and an outer annulus of proliferative tissue. As in [110], this model predicts that spheroids suspended in liquid media (zero gel stiffness) obtain the traditional histology, including a necrotic core, but contrary to observation tend to grow without bound. In a gel, however, spheroids always asymptotically approach a limited size, with or without a necrotic core.
For our purposes the most important prediction made by this model involves the relationship of necrosis to gel stiffness. In a very rough sense, spheroids in stiffer gels tend to be smaller at their steady-state size, with a lower likelihood of becoming necrotic than spheroids in more elastic gels. Even if necrosis does develop, it tends to arise later in stiffer gels. Apparently, stiff gels squeeze fluid out of the spheroid while favoring cell compression, so the necrosis conditions are less likely to be met. Therefore, this model encourages one to test the mechanical disruption hypothesis against nutrient deficiency by varying gel stiffness and nutrient availability using a fully crossed, factorial experimental design. (See [62] for example.)
8.2.5 Necrosis from local acidosis
A series of investigations by Robert Gatenby and his colleagues focusing on how malignant neoplasms invade surrounding tissue has also produced an explanation of necrosis that harkens back to the inhibitors hypothesized by Greenspan, Byrne, and Chaplain. In this case, Gatenby and his colleagues identify the inhibitor as acid. Most malignant tumors acidify their local environments because parenchyma cells metabolize glucose via glycolysis and fermentation, which produces lactate that cells then secrete [47, 49, 114] (see Section 8.3.2.2 for an elaboration of this idea). Gatenby et al. [45, 46, 106] suggest that this acidification selects for tumor cells able to withstand acidosis, allowing them to outcompete and therefore invade adjacent healthy tissue. In one model of this hypothesis [45, 46], one represents the densities of cancer and healthy cells with N1(x, t) and N2(x, t), respectively, at point x in the tumoral or peritumoral environment at time t. The excess hydrogen ion or lactate concentration is denoted L(x, t). With this notation, Gatenby et al.’s model becomes
where d1 and d2 are excess death rates of the two cell types due to local acidosis; represents cancer cell motility, modeled in particular as either D2(1 − N1/K1) or D2(1 − N1/K1 − N2/K2); r3 is the per-cancer-cell H+ secretion rate; d3 is the rate at which hydrogen ions wash out in blood or are absorbed by physiological buffers; and DL is the acid diffusivity through tumor tissue. A cellular automaton (CA) analog of this system, with an addition of glucose delivery through a vascular net, has also been studied [46, 106].
Both model (8.14) and its CA analog support the notion that acid secretion facilitates invasion, even in small tumors. These models also suggest a relationship between the morphology along the tumor edge and invasiveness; namely, a gap between tumor and healthy tissue tends to form in more aggressively invasive cancers. More important for our current purposes is the observation of necrosis in the CA model. Under certain circumstances, Aalpen Patel et al. [106] show that areas within the tumor can become so acidic that all cells are destroyed, yielding a region of necrosis.
Although this mechanism is distinctly different from all others presented above, it may be hard to tease apart from the nutrient limitation hypothesis for the following reason. Cancer cells might evolve to rely on glycolysis instead of the tricarboxylic acid cycle precisely because of nutrient limitation in nascent tumors [47, 49]. So areas where nutrients are limited are precisely those areas where selection favors cells that acidify the environment, resulting in a spatial correlation between nutrient deficiency and acidosis. However, the acidification hypothesis predicts that in older tumors at least regions with a higher density of parenchyma cells and therefore regions of high acid secretion, should be more prone to necrosis than regions with a more mixed histology, even if nutrient delivery does not vary between the areas. Models such as (8.14) and those presented in Sections 8.2.1, 8.2.2 and 8.2.6 may be employed to refine this prediction into something empirically testable.
8.2.6 Necrosis due to local ischemia
The irregular pattern of necrosis often observed in real tumors begs for more complex hypotheses than those presented above. In particular, how necrosis-inducing conditions arise in larger, irregularly shaped tumors in the face of vascularization needs explanation. If necrosis is caused by nutrient limitation, for example, then what determines where it occurs within a vascularized tumor? If, on the other hand, mechanical disruption of cells causes necrosis, then can one predict where such necrotic regions will crop up within a growing tumor given its location within the body?
Little theoretical work has been done on the mechanical-disruption hypothesis in an in vivo setting, probably for two reasons. The first is the obvious complexity involved; the region of the body itself would have to be modeled, including organ shape and tissue compositions. The importance of these factors is highlighted by the observation that multicell spheroid behavior depends in part on the stiffness of the media (see Section 8.2.4). Second, the hypothesis itself is relatively young and so has not been fully analyzed beyond the simplified geometry of a spheroid.
On the other hand, three distinct variations of the nutrient-limitation hypothesis have been proposed to explain necrosis in vascularized tumors. All three point to local ischemia (lack of blood delivery at the tissue level) as the culprit, but they disagree on what causes the ischemia. One, commonly cited in oncology texts, suggests that tumors “outgrow their blood supply”; that is, parenchyma growth exceeds vascular growth in some region within the tumor, resulting in a local ischemic necrosis. The viability of this hypothesis is questionable, because the net proliferation rate appears to depend on local perfusion, so it is unclear how the parenchyma could overshoot its local “carrying capacity” so wildly. Nevertheless, such a mechanism could account for some subtle oscillations in growth rate [95] (see Section 8.4 below). In the second variation, local ischemia is caused by compressive pressure within the tumor, which collapses tumoral blood vessels. This compression is thought to arise in part through high fluid pressure in the interstitium [89], although bulk pressure from cells probably plays a dominant role [66]. Finally, the third variation places the blame on irregular distributions of blood flow and hematocrit that can arise even within a highly organized microvascular net. Here, we focus only on models of these last two variations.
One version of the collapsed blood vessel hypothesis has been modeled by Mollica et al. [89] at the level of a single microvessel. In this model we imagine a capillary of length L situated within a tumor. The interstitial fluid pressure, eri, is assumed to be constant, so the pressure acting on the capillary at location x along its length at time t, denoted p(x, t), is π(x, t) −πi, where π represents the vessel pressure. If p < 0, then the capillary feels a compressive force and will begin to collapse. Sufficient compression causes the capillary to buckle, resulting in almost complete cessation of blood flow. On the other hand, the capillary is assumed to have some elasticity, so it may dilate in response to the distending force the capillary feels when p > 0.
If we let u(x, t) be the displacement of the capillary wall from its average width h0, then the main model equations take the following form:
where T represents capillary wall tension, w normalizes the vessel cross section so changes in its area can be equated to changes in the height of a rectangle of equal area, Φ(u) represents the capillary wall stiffness, c is a drag coefficient, ρ represents interstitial fluid density, H is the virtual mass coefficient, δ is the capillary wall’s thickness, k denotes the permeability of the capillary wall to serum, and µ is blood viscosity. At the venous and arterial ends, the capillary is held at fixed width h0, and the entrance (arterial, πa) and exit (venous, πv) pressures are also fixed, with πa > πv.
Numerical investigation of this model uncovered a regime in which blood flow through the vessel cycles on a 100-millisecond time scale. The cycles appear to be chaotic and persistent, indicating a continuous “pulsing” of blood through the capillary independent of the cardiac cycle, which was not modeled. The original purpose of the model was to investigate observed variation in blood flow rate and direction in actual tumors. Mollica et al. note that their results, while intriguing, fail to explain observed behavior because the oscillations occur much too rapidly. However, they suggest that a network of such capillaries and relaxation of certain simplifying assumptions may yield more realistic behavior. A similar cautionary remark applies to the use of this model to study necrosis. The basic premise is promising, but a more coarse-grained scale is probably required. Nevertheless, this model is an important mechanistic attack on the problem.
Although it is well known that tumors frequently suffer disrupted circulation [66, 114], vessel collapse from compressive pressure is not the only possible mechanism. Tomas Alarcón et al. [3, 4] investigated an alternative in which ischemia arises as a result of capillary accommodation responses and heterogeneous distribution of hematocrit throughout a tumor. Using a “hybrid” cellular automaton model, so called because it includes a traditional diffusion formalism along with the CA mechanism, they studied the effects of heterogeneous blood distribution on competition between tumor cells and healthy cells. The setting is a prescribed, two-dimensional vascular net overlaying a 60-by-60 pixel CA grid. Each pixel in the grid represents one (biological) cell, so the domain is about 1200 µm2, assuming an average cell diameter of 20 µm. The vascular bed is a regular “hexagonal” net with anastamoses every 80 to 90 µm or so. This arrangement results in a maximum avascular interval of 160 µm along the vertical axis and 240 µm along the horizontal.
The vessels themselves are not inert tubes. Rather, they change diameter in response to changes in transmural pressure (pressure across the vessel wall), sheer stress, effective oxygen delivery and intrinsic mechanisms. In short, if we let Ri,t be the diameter of the ith capillary section at time step t, then accommodation dynamics of the capillary are described by the following equation, which because of the CA formalism is expressed in discrete time steps of length Δt:
where the i subscripts have been dropped, τw is the sheer stress along the capillary wall, Q̇ is whole blood flux, Q̇r measures constant oxygen demand of cells serviced by the capillary, km measures how sensitive the capillary response is to discrepancies between O2 demand and O2 delivery, and ks represents an innate tendency of the capillary to shrink in the absence of other modifiers. In addition, the authors assume that capillaries homeostatically regulate sheer stress around a set point that can vary with transmural pressure, P; that set point is represented by τ(P) and was determined empirically. The variable H is a measure of red blood cell count or, alternatively, moles of O2 and can be thought of as proportional to the hematocrit, the red cell volume fraction of whole blood.
The most important aspect of this paper is the recognition that hematocrit tends not to remain homogeneous in a microvascular net; therefore, if hema-tocrit in one region of a tumor became very low, nutrient delivery would be impaired and necrosis might result. The mechanism causing hematocrit inhomogeneity is the tendency of erythrocytes to disproportionately enter branches with larger flow rates per unit area in the branch’s cross section. To model this phenomenon, Alarcón et al. assume that at a vessel bifurcation, erythrocytes prefer to enter branches with a larger flow rate. In fact, if the difference in flow rates is large enough, all erythrocytes enter the faster branch.
Results of this model showed that both blood volume and hematocrit can vary wildly throughout a microvascular net. Unfortunately, Alarcón et al. did not use this model to investigate it as a mechanism of necrosis, but certainly this intriguing hypothesis is worth following up.
8.3 What causes cell diversity within malignant neopla-sia?
Along with necrosis, cell diversity is another biologically and clinically significant feature of malignant neoplasia, the explanation of which benefits from an ecological perspective. This cellular diversity exists on two levels. The first, which for convenience we will call “Type I” diversity, includes all types of cells within malignant tumors, including parenchyma cells, “healthy” cells of the reactive stroma—primarily fibroblasts and myofibroblasts—and cells of the circulatory infrastructure—blood and lymph endothelial cells, pericytes, smooth muscle cells, and a few others. In addition, immune reactive cells, including lymphocytes, macrophages, and neutrophils, are also present (Fig. 8.1).
The second type of diversity, “Type II,” is variation in parenchyma cell anatomy and physiology. Anatomical variation alone is typically referred to as cellular pleomorphism, or more specifically nuclear pleomorphism if one focuses on that organelle. But cancer cells also vary in genomic architecture and general physiology. Any variation primarily generated by genetic differences tends to be called clonal variation. Although mathematical attacks on the causes of necrosis have a deeper history than studies of tumor cell diversity, theories for both types have appeared, as reviewed below.
8.3.1 Causes of Type I diversity
Cancer can be understood as a result of natural selection favoring certain cell lineages that one can describe as “selfish ‘cheats’ that exhibit antisocial characteristics” [100, p. 493]. In the short term, selection favors aggressive mutant cells over “healthy,” cooperating cells at the expense of integrated tissue architecture. Tissue integration breaks down because mutant cells enter a competition for resources that otherwise would not exist among cooperating, genetically similar clones. Since this destruction of tissue architecture, which defines malignancy, arises through disrupted relationships among all cell types within the lesion, Type I diversity has become a major focus of theoretical oncology. However, despite efforts to model angiogenesis (see [9, 28, 29, 74, 75, 82, 108, 119] for reviews) and interactions between parenchyma and ECM [29], the most modern empirical research of phenomena at this level of diversity (which can be thoroughly explored in [19, 33, 65, 76, 80, 105, 113, 115, 117, 134]) has attracted surprisingly little attention from the theoretical oncology community.
Despite the relative paucity of effort directed at Type I diversity, at least three hypotheses explaining how it arises can be derived from existing research. The first suggests that invading parenchyma cells cannot entirely outcompete the original healthy population, leaving remnants of the healthy population in pockets or spread evenly throughout the tumor. The second supposes that tumor tissue invades surrounding healthy tissue with fingerlike projections, like the fungiform invasion described in pathology texts, caused by known reaction-diffusion mechanisms. Finally, the third hypothesis is an extension of the first. Complex interactions among parenchyma, healthy, and immune cells within the lesion cause Turing-like patterns to arise in which densities of the various cell types vary throughout the tumor, with some areas inhabited primarily by parenchyma, others by normal cells. Each of these ideas is explored more fully below.
8.3.1.1 Incomplete competitive exclusion
Perhaps the most straightforward way to represent competition among cell types characteristic of malignancy is a direct application of the Lotka-Volterra model, as was made by Gatenby [44]:
where N(t) and T(t) represent the number of healthy cells and tumor cells, respectively; Ki is the “carrying capacity” for a body made exclusively of cell type i; α measures the competitive impact of tumor cells on healthy cells; β is the competitive impact of healthy cells on tumor cells; and ri is the intrinsic rate of increase for cell type i. The dynamics of this model are well understood [63, 93]; the novelty is Gatenby’s interpretation of the behaviors. He views parameter regions that allow an attracting interior (nonboundary) fixed point as benign neoplasia. Malignancy is recognized as an attracting fixed point on the boundary for which N = 0 and T = KT . Later, Gatenby et al. [48] used this system in a general reaction-diffusion model,
where n(x, t) is a vector of cell population densities for all cell types at point x and time t, D is a matrix of cell motility coefficients, and f(n) is a generalization of model (8.17) that includes an arbitrary number of cell types competing at a point in space. In their application, Gatenby et al. limit the model to one space dimension and two competing species, again cancer versus healthy cells, so f(n) is the right-hand side of model (8.17).
Again, model (8.18) is well studied [94] and known to admit travelling-wave solutions with well-characterized velocities, interpreted by Gatenby et al. as tumor invasion of surrounding tissue. In particular, if
and
then the tumor will invade surrounding healthy tissue, completely replacing it, at a speed no less than
However, if the inequality in equation (8.20) is reversed, then the tumor still invades but does not entirely eliminate surrounding healthy tissue. This result is interpreted as desmoplasia, a mixture of cancerous and noncancerous cells within a tumor. Therefore, this model explains tumor cell diversity as incomplete competitive exclusion.
Model (8.18) makes some interesting practical predictions about how tumors will respond to treatment. Most basically, any successful treatment must reverse both inequalities (8.19) and (8.20). If the treatment is successful and scar-forming tissue has essentially the same properties as the original healthy tissue destroyed by the tumor, then the lesion will scar over at a minimum speed given by an expression formally equivalent to (8.21), with subscripts switched and α replacing β. Also, as Gatenby et al. point out, cytotoxic therapy can kill tumor cells directly and may blunt the tumor pop-ulation’s intrinsic rate of increase rT . In neither case will it have an effect on the asymptotic behavior of the tumor—rT does not determine the stability properties of the steady states—unless the tumor is entirely eradicated. This observation may help explain why cytotoxic therapy often fails.
Gatenby et al. use this insight to identify other parameters that might make more promising targets for therapy. In fact, this model supports attacks on a potential target already identified—tumor vasculature [40]. In this context, an attack on tumor angiogenesis at the least reduces KT , which will tend to reverse both inequalities (8.19) and (8.20). If all else remains equal, angio-genesis inhibition could therefore cause stability of the boundary equilibria to switch, in which case the tumor would regress without further cytotoxic treatment. In essence, the body itself would destroy the tumor by outcompeting it. However, whatever effect such a treatment has on KT , it must not equally degrade KN, as is clear from relations (8.19) and (8.20).
These inequalities also suggest that one might profitably attack the tumor by altering the competitive relationship between cancerous and healthy cells since decreasing α and increasing β will also tend to favor healthy cells. Gatenby et al. suggest that techniques to decrease tumor cell nutrient uptake and perhaps increase healthy cell uptake might work. This idea is in line with results obtained by [69]. Gatenby et al. also recommend looking for ways to decrease protease expression and acid secretion as ways to decrease α. They also suggest one might consider trying to increase KN by somehow attenuating contact inhibition among normal cells.
8.3.1.2 Fungiform invasion
As an alternative to the incomplete-competitive-exclusion hypothesis, a model by Shusaku Tohya et al. [126] suggests that nutrient dynamics within the tumor drives Type I diversity. This model was originally designed to explore the irregular penetration of dermis by nodular lesions of basal cell carcinoma (BCC), a largely curable form of skin cancer. In this model, we look at a cross section through a BCC lesion perpendicular to the skin. All dynamics occur on the plane of the cut, so it is convenient to let x and y be the dimensions parallel and perpendicular to the skin’s surface, respectively. Also, let 0 ≤ x ≤ X and 0 ≤ y ≤ Y . Nutrient is delivered to tumor cells by a capillary that lies along the basal edge of the tumor, so the nutrient along the line y = Y for all allowable x is fixed at n0. Cells take up this nutrient, metabolize it, and use it for both movement and growth. If we let n(x, y, t) and c(x, y, t) be the nutrient concentration and cancer cell density, respectively, at point (x, y) and time t, then Tohya et al.’s model becomes
where Dn is the diffusivity of nutrient; k is the base rate at which cells uptake and metabolize nutrient; Dc(n, c) = σnc, σ constant, expresses cancer cell motility; and θ measures how efficiently cells convert nutrient into new growth. Initially the lesion starts as a flat layer of cells of fixed thickness y0, with the remaining space y0 < y < Y for all allowable x considered to be normal dermal tissue.
Despite this model’s formal simplicity, it produces an intriguing hypothesis. Under certain conditions, in particular when is sufficiently small and with the proper initial conditions, the lesion extends tumorous “fingers” into the dermis. If sectioned in any way other than exactly perpendicular to the skin surface, a microscopic examination of such tissue would look like islands of normal tissue within a sea of cancer tissue, or vice versa. Alternatively, it is not hard to imagine a more realistic extension of model (8.22) in which these fingers grow together, engulfing islands of healthy tissue and yielding a realistic histology. As it stands, the simulations make certain predictions about the width of the tumorous fingers and the rate at which they grow as functions of parameters that may help guide empirical investigation.
8.3.1.3 Turing instabilities
A model by Markus Owen and Jonathan Sherratt [104] offers a distinctly different explanation of Type I diversity from either the incomplete-competitive exclusion or fungiform-invasion hypotheses. Their model is a spatially explicit description of macrophage-tumor interactions that includes dynamics of a chemical regulator secreted by cancer cells that both attracts and activates macrophages. Macrophages are seen as able to bind to parenchyma cells to form a parenchyma-macrophage complex. Such complexes then fall apart, yielding an intact macrophage and unmodeled debris. If we let
l(x, t) = macrophage density at spatial point x at time t,
m(x, t) = cancer (parenchyma) cell density,
n(x, t) = healthy cell density,
f (x, t) = concentration of the chemical regulator, and
c(x, t) = parenchyma cell-macrophage complex density,
then the following is a nondimensional version of Owen and Sherratt’s model:
Everything in this model moves about by simple diffusion with diffusion constants Di, i ∈ {l, m, n, f, c}, and macrophages tend to migrate up the chemical regulator gradient with basic motility χl. All cell proliferation terms have the form
with φ some simple function of assorted dependent variables and N a parameter that describes sensitivity of cells to crowding. The healthy cell population reaches equilibrium whenever l+m+n = 1 in the absence of diffusion. Therefore, the variables are scaled such that when total cell density is unity, a sort of “carrying capacity” for healthy cells is reached. Note that in this model crowding inhibits only proliferation, not mortality. The remaining parameters include the rates at which macrophages proliferate in response to the chemical regulator (α), macrophages leave blood vessels to enter the tumor interstitium (I), blood-borne macrophages enter the tumor interstitium in response to the chemical regulator (σ), the macrophage-tumor cell complex forms (k1) and dissociates (k2), free macrophages disappear (δl), the chemical regulator is secreted by cancer cells (β), the chemical regulator decays (δc), and macrophage-cancer cell complexes dissociate. Finally, ξ > 1 measures the proliferative advantage cancer cells enjoy over healthy cells.
If one simplifies this model by turning chemotaxis off (χl = 0), then numerical investigation reveals two interesting regimes. The first represents a smooth wave-front of cancer tissue infiltrating and completely eliminating surrounding healthy cells. In this regime, the wave speed is approximately per time, to first order. Their parameter estimates applied to this formula indicate that a 1 mm diameter tumor would take on the order of 100 days to grow.
The second regime is dynamically more surprising and shows the potential importance of immune attack on Type I diversity within a tumor. If the chemical regulator diffuses sufficiently well (Df is large enough), then behind the invasion front a Turing pattern of alternating regions of high and low cancer cell density develops. In one dimension, the healthy cell density becomes very ragged as it decays outward in a pattern reminiscent of actual cancerous lesions. These patterns form because local areas in which cancer cell density, and therefore chemical regulator production, is high cause a sharp chemical gradient to form. Since both the gradient and diffusion constant are large, most of the chemical regulator moves out of areas of high cancer cell density. As a result, macrophages, following the chemical regulator, tend to cluster in areas of relatively low cancer cell density. Since these areas contain very few cancer cells, and therefore produce very little chemical regulator of their own, the gradient is maintained as long as the chemical regulator decay rate is sufficiently high. These patterns were observed in both one- and two-dimensional solutions.
Allowing macrophages to migrate up the chemical regulator gradient (allowing χl > 0) stabilizes these Turing patterns in the following sense: chemotaxis tends to increase the critical value of Df above which these patterns form. However, chemotaxis also appears to favor even wilder behavior once Df gets high enough. The pattern following the invasion wavefront, which before was more or less regularly repeating regions of high and low cancer cell density, can become highly irregular, exhibiting the mixed histology often characteristic of malignant neoplasia.
8.3.2 Causes of Type II diversity
As already mentioned, diversity within malignant neoplasms is not limited to differences between parenchyma and a few “healthy” cell types. Even among parenchyma, cellular pleomorphism and clonal variation are common features [83] and may predict prognosis in some cases [81], although the amount of variation itself varies among tumors and even within the same tumor over time, typically declining as the tumor ages [77]. The question we now address is, how does anatomical and physiological pleomorphism arise? At least three hypotheses exist [83]. First, as already discussed, a number of different aspects of the tumor microenvironment—nutrient concentration, hydrostatic and mechanical pressure, among other things—vary both temporally and spatially. Since cells are physiologically plastic, they can change their behavior and even form to accommodate the demands of their local environment. Therefore, pleomorphism may represent nothing more than accommodation of cells to different environmental conditions. We have already seen an example of this idea in the quiescent layer of some multicell spheroids. Also, it is well established that cancer cells change phenotype between differentiated epithelia-like cells and less differentiated mesenchyal cells [111]. This epithelial-mesenchymal transition (EMT) appears to be controlled in part by epigenetic mechanisms [123]. Cancer cells may also be phenotypically plastic with respect to their metabolic response to variation in oxygen tension [67].
A second hypothesis focuses on what evolutionary biologists would call mutation pressure. Parenchyma cells have long been known to exhibit striking genetic variation caused in part by dysfunction of their DNA-maintenance machinery [78, 91]. From this observation an explanation of cancer cell variation almost immediately follows—pleomorphism is in fact clonal variation driven by genetic polymorphism caused by the rapid accumulation of mutations among cancer cells. This hypothesis has been applied directly to explain variations in proliferation rate, invasion and metastasis potential, anaplasia (lack of differentiation), and senescence, in addition to cellular and nuclear anatomy (reviewed in [21, 22]). Although elegant, this hypothesis rarely has been used in the mathematical oncology literature (see [120] for an exception).
The third hypothesis is really an extension of this genetic polymorphism idea but adds natural selection. The history of mutations among cancer cells, while important, is still insufficient to explain the pattern of pleomorphism within any given tumor. One must also know how natural selection then sifted through the mutations to understand fully the diversity and frequency of parenchyma cell phenotypes. The role that natural selection plays depends critically on the functional nature of the pleomorphism. That is, are tumors integrated tissues, with a variety of cell types working together for their mutual benefit? Or are tumors a collection of uncooperative cell types competing for scarce resources? If the latter, then pleomorphism is a manifestation of niche segregation, and damaging or removing one cell type should have little effect on overall tumor growth. If the former, then pleomorphism is an adaptation of the tumor to the host; destruction of one subpopulation will cause disproportionate damage as the disruption of integrated function will ripple throughout the tumor.
Although the idea that natural selection acts within tumors is old [99, 103] and presented dogmatically in standard texts, the magnitude of selection’s impact still demands evaluation. For example, if mutation rates are very high and environmental conditions extremely spatially and temporally variable, no consistent selection pressures will exist, thereby minimizing natural selection’s role. Therefore, one should maintain natural selection and genetic polymorphism as distinct hypotheses.
For the remainder of this section we focus on the natural-selection hypothesis and ask, what traits does selection favor in the competition among parenchyma cell types? Certainly growth rate is an obvious candidate, but others have also been proposed, including efficient nutrient use and decreased dependence on oxygen. Below we review models of each of these suggestions.
8.3.2.1 Natural selection favoring proliferation rate and efficient nutrient use
As with Type l diversity, the earliest models of pleomorphism, by Seth Michelson et al. [86], grew from the Lotka-Volterra competition models. However, unlike Gatenby, Michelson et al. interpret the species as two different strains of cancer cells within a single tumor. In essence, the model “begins” after mutation has already created a challenger to the resident parenchyma strain. The question then is, will one strain eventually dominate or will a polymorphism result? ln one variation, for example, Michelson et al. (see also Michelson and Leith [85]) allow one cell type to mutate into the other. In this model they represent the population sizes of the two cell strains as x and y and define the following model:
with ri and Ki the intrinsic rate of increase and carrying capacity, respectively, of cell type i; λi the effect of competition on strain i; and p the rate at which cell type 1 mutates into cell type 2. This model can have three fixed points: the origin, the point (0, K2), and a point in the interior representing a polymorphism. The authors use Dulac’s criteria to show that no relevant limit cycles exist. The origin is never asymptotically stable if one assumes both ri > 0; so, the dynamics are (almost always) well characterized. In short, if p > r1(1 − λ1K2), then solutions always approach the boundary fixed point, representing a monomorphic y-type population. If the inequality is reversed, the population approaches a well-characterized polymorphism asymptotically. So, if the x-type population suffers either a low intrinsic reproductive rate or high mortality, then selection will favor its complete annihilation. We can also see in this model selection punishing cells that use nutrients or space inefficiently—if y-type cells are inefficient, manifested as a limited “carrying capacity” (K2 small), then x-type cells are less likely to be completely excluded.
A more sophisticated extension to these simple competition models provided by Gatenby and Thomas Vincent [49] can be used to predict how tumor populations are likely to evolve in the face of competition for resources, in this case glucose. Consider a tumor that contains one healthy cell population and p − 1 subpopulations of parenchyma cell types. The number of healthy cells at time t is denoted N1(t), while Ni(t), i ∈ {2, ... , p}, represents the size of the ith cancer subpopulation. Cells of all types take up and metabolize glucose, the absolute amount of which is denoted R(t). Gatenby and Vincent then write the following model to represent competition for glucose within this heterogeneous tumor:
where αn and αc are intrinsic rates of increase for healthy and cancer cells (invariant across strains), respectively; Ki and Ei, i ∈ {1, ... , p}, are “carrying capacities” and maximum substrate uptake rates for all cell types, respectively; Rn and Rc measure the sensitivity of nutrient uptake to changes in nutrient concentration, and mn and mc represent glucose oxidized for purposes other than proliferation, which one can think of as maintenance metabolism. The function r represents glucose delivery through the blood, which increases with tumor size. Gatenby and Vincent appear to assume that microvessel density varies in proportion to glucose demand for maintenance metabolism, so they modify the basic glucose delivery rate, re, by the weighted average of basic glucose demand.
In this model the parameters assumed to be under selection are K and E and are considered to be random variables. They assume that normal cells’ carrying capacities and basic nutrient uptake rates distribute normally around means µK and µE, with variance for both distributions. Similarly, parameter values for cancer cells are normally distributed with means νK < and νE and variance σc for both. To determine how the population evolves, Gatenby and Vincent exploit a method involving fitness-generating functions that essentially allows them to write an expression for the fitness of all possible cell types for any given population composition. With this adaptive landscape, they can then write a differential equation for the change in population size for any strategy in any population. With such an equation one can find evolutionary equilibria, equivalent to evolutionary stable strategies [50, 84], by finding the population configuration at which the fitnesses of all cell types are zero.
The results of this model suggest that when cancer arises, glucose concentration tends to decline, because the basic metabolic rate of the tissue (tumor) increases. Because glucose becomes scarce, natural selection favors cells that can sequester and metabolize glucose efficiently (maximize both K and E). So over time the tumor is able to maintain its proliferation rate in the face of fierce competition for glucose. In addition, this model is among the first to reproduce the observed decline in tumor pleomorphism as tumors progress.
Further support for the hypothesis that selection favors efficient nutrient use comes from a model by Yang Kuang et al. [69]. In this model we imagine a tumor growing in an organ with mass x(t). The tumor contains two different parenchyma cell types with masses y1(t) and y2(t). Nutrient is delivered to the cells through a dynamic vascular network with a total mass of vascular endothelial cells (VECs) of z(t). Total tumor phosphorus is denoted by P and is partitioned into five different compartments: the interstitial fluid, healthy cells, cells of the first parenchyma type, cells of the second parenchyma type, and VECs. Each unit mass of healthy cells, including VECs, contains n units of phosphorus, while parenchyma cells of types 1 and 2 hold m1 and m2 units, respectively. Therefore, if we denote extracellular phosphorus as Pe, then Pe = P − [n(x + z) + m1y1 + m2y2]. With this notation, Kuang et al. suggest the following model (see Section 6.6.1):
where L = g(z − α(y1 + y2))(y1 + y2), a, b1, b2, and c represent intrinsic rates of increase of all cell types; all terms di are basic death rates; kh and kt represent limiting sizes for the healthy organ and tumor, respectively; f is the intracellular fluid fraction; and L is a measure of vascular supply. In particular, α represents the mass of tumor cells one unit of blood vessels can just barely maintain, and g measures sensitivity of tumor tissue to lack of blood. Also, Kuang et al. assume that tumor tissue starved for blood releases an angiogenic signal. This signal is distilled by VECs from a complex mix of pro- and antiangiogenic chemical growth factors released by all cells in the tumor. Upon receipt of the signal, VECs respond by reproducing, moving toward the blood-starved region and forming new microvessels. Kuang et al. further assume that the VEC response is delayed by τ time units, representing the time needed for cells to transduce and respond to the chemical signal and complete their reproductive, motility, and differentiation programs. Finally, parameters βi represent the effect of a drug able to modulate, generally inhibit, cell type i’s ability to sequester phosphorus from the interstitium.
Model (8.27) admits two possible limiting factors: blood supply and phosphorus. However, simulations with reasonably realistic parameter values suggest that phosphorus is the key limiting factor, determining both growth rate and final tumor mass. In this case, then, what type of cell does natural selection favor—cells with a high or low phosphorus requirement (high or low mi)? The nutrient-use efficiency hypothesis suggests that selection will favor the most efficient type; that is, the type that minimizes mi. However, the reality is complicated by the fact that phosphorus use relates to growth rate [38, 69, 118] in the following way. Cells require phosphorus primarily for nucleic acid, and rapidly proliferating cancer cells must synthesize large amounts of nucleic acids, primarily in the form of ribosomes [118], to build proteins needed for cell division. In fact the number of ribosomes in cancer cells appears to correlate with cancer aggressiveness (reviewed in [38]). Therefore, selection for the aggressive cell type can work directly against selection for efficient nutrient use.
Model (8.27) suggests that selection’s choice between nutrient-use efficiency and aggressive proliferation depends on the state of the tumor. In particular, when tumors are small and well supplied with phosphorus and blood, the more aggressively proliferating cell type may have the advantage, growing faster than its less aggressive competitor. However, as the tumor approaches its asymptotic limit, competition for phosphorus increases as it becomes limiting. Then selection changes favor and gives the advantage to the more efficient type, which eventually drives the aggressive phenotype to extinction (Fig. 8.3). Therefore, this model predicts that as tumors age they become less aggressive and more miserly with nutrients.
![Figure showing a numerical solution to model (8.27) with a = 3, b1 = 6, b2 = 6.6, c = 0.05, dx = 1, dz = 0.2, d1 = 1, d2 = 1, f = 0.6667, g = 100, kh = 10, kt = 3, m1 = 20, m2 = 22, n = 10, Pe = 150, α = 0.05, β1 = 1, 02 = 1, τ = 7, and [x(0), y1(0), y2(0), z(0)] = [9, 0.01, 0.05, 0.001]. This example shows that selection appears to favor neither cell type until phosphorus becomes limiting.](http://imgdetail.ebookreading.net/math_science_engineering/24/9781498785532/9781498785532__introduction-to-mathematical__9781498785532__image__fig8-3.png)
A numerical solution to model (8.27) with a = 3, b1 = 6, b2 = 6.6, c = 0.05, dx = 1, dz = 0.2, d1 = 1, d2 = 1, f = 0.6667, g = 100, kh = 10, kt = 3, m1 = 20, m2 = 22, n = 10, Pe = 150, α = 0.05, β1 = 1, 02 = 1, τ = 7, and [x(0), y1(0), y2(0), z(0)] = [9, 0.01, 0.05, 0.001]. This example shows that selection appears to favor neither cell type until phosphorus becomes limiting.
8.3.2.2 Natural selection favoring insensitivity to hypoxia
As already discussed (Section 8.2.5), malignant tumors and their peritu-moral environments tend to be relatively acidic, probably because tumor cells favor glycolysis and fermentation over the tricarboxilic acid cycle. Gatenby and his colleagues [47, 49, 114] suggest that natural selection provides the answer as to why. Carcinomas by definition begin within epithelial tissue. This tissue is defined by the presence of a basement membrane upon which the epithelial cells live. Usually the vasculature servicing such tissue lies on the opposite side of the basement membrane; therefore, premalignant carcinoma precursors, which by definition cannot penetrate the basement membrane, are constrained to expand away from the blood supply. (Such geometry raises doubts about the validity of tumor cell spheroids as models of nascent carcinoma.) In such a situation, cells able to produce ATP under hypoxic conditions will then be favored. Since these geometrical constraints apply to essentially all carcinomas, selection favoring glycolytic oxidation of glucose will be nearly ubiquitous [47, 49, 114].
Two recent models [43, 125] connect this hypothesis with molecular biology of cancer cells through the tumor suppressor gene p53, whose product, p53, the editors of Science declared “molecule of the year” in 1993. Among its many demonstrated functions, p53’s product activates the apoptosis mechanism in “stressed” cells. One form of stress to which p53 appears to respond is hypoxia. Evidence for this conclusion comes from studies of p53-deficient cells in culture, which commit apoptosis less frequently than intact wild-type cells in hypoxic environments [51, 116]. This observation is profoundly significant to cancer biologists, because p53 is widely regarded as the most commonly disrupted gene among cancers as a whole, mutated in over 50% of all malignant neoplasms, and many cancerous tumors suffer regions of local hypoxia (see Section 8.2.6). If selection frequently favors cancer cells able to withstand hypoxia, as Gatenby and colleagues have suggested, perhaps p53 disruption is a common mechanism, along with other metabolic changes, by which cells acquire the favored trait. Empirical support for this interpretation comes from observations of cell populations evolving a dysfunctional p53 gene when exposed to hypoxic environments [92].
Selection for dysfunctional p53 was studied quantitatively by David Gam-mack et al. [43]. Building on the earlier model of Kevin Thompson and Janice Royds [125], Gammack et al. model the dynamics of three quantities: the number of tumor cells with the wild-type (normal) p53 gene (N(t)), the number of tumor cells with the mutated p53 gene (M(t)), and molecular oxygen concentration (C(t)). Tumor cells of both types consume oxygen, proliferate, and die at rates dependent on O2 concentration. Oxygen is supplied to cells in one of two ways, depending on whether the model represents cells in culture in some virtual experiment or an in vivo tumor. In the in vitro situation, O2 is supplied exogenously in the media. We imagine the researchers of this virtual experiment varying the O2 concentration in the following way: for a period of length δ, oxygen is maintained at physiologically normal levels (normoxia); then a period of hypoxia that lasts for τ time units follows. We imagine that the researchers control δ and τ and repeat the procedure some number of times. In the model of an in vivo tumor, cells can also be exposed to repeated rounds of normoxia and hypoxia but only if blood vessels collapse from internal pressures (see Section 8.2.6). This occurs whenever total cell numbers reach a prescribed threshold, N*. Once N + M = N*, hypoxia begins for a fixed period of time, τ, representing the time required for angiogenesis to reconstruct a sufficient vascular infrastructure.
From these assumptions, Gammack et al. build the following model:
Parameters Ai and Bi represent maximum proliferation and mortality rates of cell type i, respectively; and measure how sensitive each cell type’s reproductive response is to changes in O2 concentration. Similarly, and measure how sensitive mortality rates are to changes in O2 concentration. Both p and q are free parameters with no obvious physiological meaning beyond making the response to changes in oxygen tension more or less switch-like. Parameters σN and σM can be interpreted as a measure of basal mortality that occurs even in a perfect environment; that is, as the O2 concentration gets large, mortality asymptotes at Bi(1−σi). However, actual estimates of σ from cell culture data reviewed by Gammack et al. put it very close to unity for both wild-type and p53-deficient cell lines, indicating that mortality in these assays was negligible when O2 concentration was high. The function λCex(t) represents the rate at which O2 is supplied to the system as described in the previous paragraph. Oxygen is consumed by cells at base rates Γi for cell type i ∈ {N, M}, and total O2 consumption depends on the growth rate of each cell type. Finally, O2 diffuses out of the system or is consumed by other processes at linear rate ΓC.
Data from Thompson and Royds [125] indicate that wild-type and p53-deficient cell lines differ mostly in basic mortality rates and sensitivity to O2. Roughly speaking, wild-type cells have a larger basic mortality rate (BN > BM) and suffer more from hypoxia . Not surprisingly, p53-deficient cells tend to outcompete wild-type cells in the virtual experiment. In one run, for example, with an initial cell culture in which wild-type cells outnumbered p53-deficient mutants by orders of magnitude and periods of normoxia were only slightly longer than hypoxic periods, mutants became the dominant cell type between the fourth and fifth hypoxic episode. Of course, the length of time it takes for mutants to become dominant depends strongly on how long hypoxic and normoxic periods last. In general, Gammack et al. found that higher oxygen availability—either from longer periods of normoxia or higher O2 concentrations during normoxic episodes— favors mutant invasion. In contrast to the nutrient-use efficiency hypothesis presented in Section 8.3.2.1, changes in the rate at which mutant cells consume oxygen, ΓM, had very little effect; however, increasing oxygen consumption by mutant cells very slightly decreased the invasion rate, as predicted by the nutrient-use hypothesis.
Results of the in vivo case were similar. Once again, under the estimated parameters, p53-deficient mutants tended to invade tumors in which they were initially rare, whether solutions permitted oscillations or not. Oscillatory solutions like those in the in vitro case arose when the oxygen concentration during normoxic episodes was sufficiently high, and the rate at which mutants consumed O2 was sufficiently low. Once again, variations in ΓM hardly affected the mutant invasion rate, which was once again driven primarily by the duration of the hypoxic episode.
8.3.2.3 Natural selection favoring fungiform invasion
As noted in Section 8.3.1.2, malignant tumors characteristically invade surrounding tissues. To invade, carcinomas—malignant tumors originating in epithelial tissue—must degrade and rupture the epithelial basement membrane. This requires the tumor to elaborate or otherwise activate enzymes that digest connective tissue proteins in the matrix, referred to generally as matrix degrading enzymes (MDEs). There is an important side effect of matrix degradation by MDEs. As the matrix degrades, a variety of signaling molecules are solubilized that activate migration, proliferation and angiogen-esis programs, among others, in cancer cells. This process often creates a kind of “positive feedback,” in which an active, invasive tumor releases signals from its surrounding that make the tumor more active and invasive. Tumors differ in their tendency to invade, and some of this variation may be explained by the fact that tumor cells vary in their ability to express, either directly or indirectly, matrix degrading enzymes. The question we address here is, how does natural selection act on matrix degradation ability in carcinoma, and how does evolution of this trait affect tumor growth and morphology?
This question was addressed by Anderson and colleagues [8, 10] using a hybrid model comprising a system of coupled partial differential equations linked to a stochastic process. The PDEs describe spatial dynamics of matrix degrading enzyme concentration (m(x, t)), density of extracellular matrix (f (x, t)) and concentration of oxygen (c(x, t)) at spatial point x ∈ ℝ2 and time t. The stochastic process is an individual-based model in which individual cells move, proliferate and die within the concentration fields governed by the PDEs. The PDE model takes the following form:
In this model, both matrix degrading enzymes and oxygen diffuse with (constant) diffusion coefficients Dm and Dc, respectively. This diffusion occurs in a continuous space that overlays a 2-D lattice of discrete positions that may contain a number of cancer cells (including 0). The number of individual cancer cells in lattice position (i, j) is Ni,j. Anderson et al. assume that matrix degrading enzymes are elaborated from individual cells at essentially the same constant rate (in this instance), namely µ > 0. MDEs themselves degrade naturally with first-order kinetics at per-unit rate λ. Matrix degradation is assumed to be a mass-action process with rate δ. Oxygen is absorbed by various entities in the model domain at rates proportional to its concentration: individual cells absorb oxygen at rate γ, while other elements, which are not dynamic in this model, absorb O2 at rate α. Finally, oxygen is released by blood vessels within the extracellular matrix. As a first approximation Anderson et al. assume that vessel density is proportional to ECM density; therefore, oxygen is released at per-unit rate β.
The rules and simulation procedures for the individual-based stochastic process are outside the scope of this book. However, three aspects of this part of the model are key. First, individual cells can move, and they move both by Fickian (random) diffusion and in a biased way up the ECM density gradient (haptotaxis). Therefore, cells tend to congregate in the most dense portions of the matrix, which of course increases the rate at which the matrix is degraded. Second, cell proliferation and death are both oxygen dependent. Finally, individual cells can vary in their motility (both random and biased), proliferation probabilities, O2 consumption rates, and rates at which they elaborate degrading enzymes. In the model, trait variations arise via mutation, and Anderson et al. explore evolution of these traits in a variety of mutational settings. The model predicts that tumor edge morphology— the size and depth of the invasive “fingers”—depends critically on the initial matrix density distribution, but natural selection acting on the traits listed above tends to promote a more invasive morphology. Therefore, this model links natural selection to one of the key characteristics of malignancy.
8.4 Synthesis: Competition, natural selection and necrosis
Here we address the niche segregation hypothesis proposed to explain clonal diversity in tumors. A game theory model by Lars Bach et al. [13] represents an early foray in this direction. Their model, based on earlier work by Ian Tomlinson and Walter Bodmer [128, 127], assumes that two different strains of parenchyma cells exist within the tumor. One strain, denoted by A+, secretes some chemical that is beneficial to the cells in its neighborhood—say, an angiogenesis signal. The other strain, A−, does not. Otherwise, all cells are identical. In Bach et al.’s model, neighborhoods consist of three cells. It is assumed that, if only one cell in the neighborhood secretes the chemical, then the group gains no benefit because the chemical concentration remains too small to elicit the effect. However, if at least two of the three cells secrete the chemical, then all three enjoy an increased reproductive output of j units above normal. On the down side, there is a cost associated with making the chemical; those that do suffer a deduction of i to their expected reproductive output. These considerations lead to the evolutionary payoff matrix shown in Table 8.1.
Evolutionary payoff matrix for the model by Bach et al. [13]. Strain A+ secretes an angiogenesis factor, whereas strain A− does not. Adapted from [13].
Neighborhood |
A+ |
A− |
|---|---|---|
A+, A− |
1 − i − j |
1 + j |
A+, A− |
1 − i − j |
1 |
A−, A− |
1 − i |
1 |
A discrete-time dynamical system model of these payoffs shows that selection can allow coexistence of both strains under certain circumstances. However, niche segregation cannot explain this behavior, for the following reason. If a tumor starts with “cooperators” that secrete the angiogenesis factor and is later invaded by a mutant “defector” strain that does not, then both defector and cooperator populations can persist. However, if the roles of resident and potential invader are reversed—that is, a population of defectors is challenged by cooperators—the cooperators die out, leaving a monomorphic defector population. One can interpret these results biologically as follows: defectors can invade a tumor full of cooperators as a sort of parasite living off of the cooperator’s ability to bring in resources; however, cooperators are always hurt by the presence of defectors. Therefore, polymorphism can be explained as parasitism instead of niche segregation.
This conclusion was corroborated in a series of studies using dynamical models that are biologically analogous to the Back et al. model but formally very different [20, 95, 96, 97, 98]. The simplest of these models assumes that the tumor contains two competing clones that differ in their abilities to secrete angiogenesis signals. Unlike Bach et al.’s model, this one allows dynamic population sizes and a broader array of potential differences among cell types. Similar in construction to models by Zvia Agur, Levon Arakelyan and their colleagues [2, 11], this model tracks masses of the two clones, denoted by x1(t) and x2(t). In addition, the model also follows the total mass of immature VECs from which mature microvessels are made, y(t), and the total length of microvessels within the tumor, z(t). With this notation, the model becomes
where v(t) = z/(x1 + x2), H(x1, x2, z) = (x1h1(v) + x2h2(v))/(x1 + x2), ϕi represents per-capita growth functions for both types of parenchyma, α is the rate at which immature VECs convert the angiogenesis signal into growth, H is the mean angiogenesis secretion rate within the tumor, hi is the per-capita angiogenesis secretion rate for cell type i, β expresses both the VEC death and maturation rates, γ represents the rate at which maturing VECs convert themselves into new blood vessels, and δ is the base rate at which blood vessels are broken down during remodeling. In numerical analysis, the functions ϕ take a form similar to that of model (8.28) without the crowding term; that is,
where C(v) is the oxygen pressure and all other parameters equate to their analogues in model (8.28). The cell type-specific angiogenesis secretion rate obeys a function like the following:
where ri measures a type i cell’s commitment to producing the angiogenesis signal and ξi expresses how sensitive this commitment is to changes in local oxygen pressure.
This model supports the hypothesis that natural selection favors aggressively proliferating cell types, at least early in tumor growth, but with a twist. If clones differ only in their basic proliferation rates such that A1 > A2, strain 1 always ends up dominating the tumor regardless of initial conditions. In fact, one can show that for a broad array of forms for the growth functions Φ, aggressively proliferating cell types are always favored. However, a tumor invaded by a more aggressive strain may end up clinically less aggressive. This paradox arises when the invading, aggressive cell type is sufficiently inept at producing the angiogenesis signal. Natural selection is blind to angiogenesis secretion and so always favors the aggressive invader. But because the favored clone cannot entice new blood vessels to grow very well, the tumor eventually ends up with a lower microvessel density and is therefore relatively hypoxic. In certain circumstances, this hypoxia can become so profound that the tumor regresses. One can describe such circumstances as a hypertumor—one tumor invading and destroying part of an existing tumor. And once again we see competition resulting in something akin to parasitism.
This hypertumor phenomenon hands us yet another hypothesis explaining necrosis. Superficially, one can view it as a variant of the nutrient-limitation hypothesis. However, certain predictions distinguish it from the other ideas. In particular, one will recognize a hypertumor not just as regions of nutrient deficiency but as regions of nutrient deficiency that always correlate with invading cells displaying cytological or genetic features of aggressive proliferation.
8.5 Necrosis and the evolutionary dynamics of metastatic disease
An advanced tumor is a harsh environment, as evidenced by the necrosis we have been studying in this chapter. Whatever its cause, necrosis represents ecological collapse within the tumor. In Nature, organisms living in failing ecosystems often disperse, seemingly in search of more permissive living spaces. By analogy, one might guess that metastasis is an evolutionary strategy by which cancer cells escape a failing tumor ecosystem. Support for this hypothesis comes from the observation that metastatic ability is an acquired trait—healthy epithelial cells do not normally circulate—and in general metastatic potential correlates with tumor stage and therefore likelihood of ecosystem derangement.
However, while metastasis might allow the occasional mutant cell to avoid ecological challenges in the primary tumor, this alone cannot explain why tumors tend toward greater metastatic potential with age. Selection in the primary tumor occurs exclusively within the environment of the primary tumor, unless metastatic colonies exert some unknown feedback to the tumors that spawned them. At the moment, however, it appears that the success or failure of distant metastatic seeds does not directly affect the fitness of cells confined to the primary tumor. Selection pressures within the primary lesion alone apparently favor the metastatic phenotype.
8.5.1 Pre-metastatic selection hypothesis
Thalhauser et al. [124] proposed the “pre-metastatic selection hypothesis” to address this issue. The hypothesis posits that vascular collapse within the primary tumor selects directly for cells with a migratory phenotype. The hypothesis was generated by a model of a collection of tumor cords (Fig. 8.2). As before (Section 8.2.2), tumor density is assumed to be both radially and axially symmetric around the central vessel, allowing the three-dimensional problem to be reduced to one dimension. The vessel wall is the innermost point of the domain at radius Rin, and the cord extends to radius Rout. Oxygen is supplied at the vessel wall and diffuses into the surrounding tissue where it is consumed by cancer cells.
The key to Thalhauser’s model is the assumption that cellular migration and proliferation are separate and competing processes, following the “go-or-grow” hypothesis derived from observations of glioblastoma multiforma (GBM) tumors. A high cellular density causes proliferating cells to take on a migratory phenotype. Motile cells transition to the proliferating class when the cellular density is sufficiently low. Proliferation is governed by the local oxygen tension and cell density, and cell death occurs where oxygen tension is low. The model variables are G(r, t), M(r, t), and O(r, t), representing the density of proliferating cells, migrating cells, and oxygen, respectively, at time t and radial distance r. The complete model is the following:
where
Oxygen concentration at the vessel wall is imposed by a Dirichlet boundary condition, O(Rin, t) = O0, and all other boundary conditions are no-flux. Consistent with the go-or-grow notion, there is assumed to be a continuum of phenotypes, with “aggressive grower” at one extreme and “aggressive mover” at the other. The location of a clone on this continuum is determined by the KG/KM ratio and the parameter ∊; the larger the ratio and (or) smaller the ∊, the farther out the phenotype is in the “aggressive grower” direction of the spectrum.
In this model, aggressive movers form a tumor cord that is less dense with fewer cells at the vessel wall, while aggressive growers form dense tumor cords. A high cellular density exerts compressive force on the vessel wall, which may cause local vascular collapse, ischemia, and necrosis. Therefore, somewhat paradoxically, prevention of ischemia may select for motile phenotypes and higher metastatic potential.
Thalhauser et al. also connected this result to Nagy’s [95] theoretical notion of a hypertumor (see Section 8.4). Recall that a hypertumor occurs in a vascular tumor when a clone with inferior angiogenic potential but superior growth potential invades an existing tumor. The angiogenic clones are out-competed, causing a type of “evolutionary suicide” in the non-spatial ODE version of the model. The tumor ecosystem completely collapses as the nonangiogenic clone comes to dominate the tumor. In Thalhauser’s tumor cord model, aggressive growers are the counterpart to the hypertumor. It is plausible that “local hypertumors” may be responsible for the regions of necrosis frequently observed in advanced tumors.
Thalhauser et al.’s model addresses the selective forces at work in the primary tumor. However, it is also probable that metastatic cells continue to evolve once they have colonized distant sites. Here, the Halstedian curtain wall model of metastatic spread may have some utility. We can imagine that a spontaneously arising mutant in the primary tumor is capable of colonizing, say, a lymph node. Thus, the first curtain wall has been colonized. Now that a basic metastatic capability has been acquired, another mutant may arise in this colony with the ability to spread further. Thus, mutants could drive the continued distal expansion of disease, where further metastatic capability is acquired at each subsequent site. We suggest the development of a formal model for such a process as a project for the interested student.
Such evolutionary dynamics likely interact with the physical dynamics of tumor cell dissemination within the vascular and lymphatic systems to determine the overall pattern of spread in a clinical cancer.
8.5.2 Reproductive fitness and export probability
A recent series of studies by Michor, Iwasa, Dingli, Haeno, and colleagues [36, 58, 87, 88] have examined the interaction between mutation to a metastatic phenotype within the primary tumor, the mutant’s reproductive fitness within the tumor, and mutant’s export probability from the primary tumor. These models are generally cast as stochastic birth-death processes, and we briefly present Dingli et al.’s [36] model as an example.
Consider a quasi-steady state tumor with a total of N cells, M of which are mutants with metastatic capability and relative fitness r within the primary tumor. The model is a discrete, stochastic model. Cell divisions occur at some rate, λ, and with each replication a mutation occurs with probability µ. The probability that an existing mutant replicates depends on its relative fitness, r, and is given as:
Note that if r = 1, then pM = M/N. The probability that a wild-type cell replicates is pN = 1 − pM. Following replication of a mutant or a de novo mutation, the daughter cell metastasizes with probability q. If, after all of this, the cell population is greater than N, mortality is assumed to reduce the population back to N cells. While Dingli et al. studied this system in the context of agent-based stochastic simulations, the model can be recast as a system of ODEs (which yields similar numerical results) as follows:
where E(t) is the total number of metastatic cells exported. If r = 0 (mutations are neutral) and the probability of metastasis is nonzero (q > 0), then this model predicts that mutants will make up only a very small fraction of the tumor and the metastatic rate will be low at equilibrium. However, when mutants have a high relative fitness, the export rate and survival advantage within the primary tumor compete. That is, a high export probability depletes the tumor of mutants and ultimately lowers metastasis rate. Somewhat surprisingly, the tumor fraction of the tumor composed of mutants at steady-state switches quite suddenly from 1 to nearly 0 as q increases.
Michor et al. [87] considered a very similar model, but without the explicit removal of mutant cells from the primary tumor by metastasis. This work concluded that the probability of establishing distant metastases is negligible for mutants with r ≤ 1 unless the export rate, q, is very high, suggesting that most mutations that confer metastatic ability also increase the mutant’s fitness within the primary tumor. Michor et al. reached essentially the same conclusion in a second paper [88], where two mutations were required to confer metastatic ability. This result relates to Thalhauser et al.’s [124] prediction that increased motility, which may predispose to to metastasis, confers a survival advantage within the primary tumor.
8.5.3 Tumor self-seeding
Finally, we briefly discuss recent experimental results on tumor re-seeding by metastatic cells. While metastasis has been traditionally viewed, in both the modeling and basic biology literature, as a unidirectional process where cells spread strictly from the primary tumor to distant sites, cells from metastatic colonies may also return to, or “self-seed,” the original tumor site. Kim et al. [68] recently showed that tumor self-seeding by aggressive circulating tumor cells occurs in a variety of experimental cancer systems. Moreover, they showed that the most aggressive circulating cells preferentially reinvade the primary tumor mass. These aggressive cells were capable of increasing primary tumor growth rate by releasing cytokines that influence the tumor stroma and foster angiogenesis and invasion.
We now have a dynamical picture where the primary tumor continually sheds cells into the circulation. The primary tumor itself is fertile soil for such potentially metastatic cells, as they are already adapted to the tumor microenvironment, and the leaky tumor vasculature is a weak barrier to ex-travasation. The most aggressive and metastatically capable cells colonize the primary tumor site, increasing its growth rate and inducing further angio-genesis. With increasing vascularization, more cells are shed into the circulation and ever more return to the tumor. The tumor comes to be dominated by clones with increasing metastatic capability, eventually leading to distant metastasis. Distant metastatic colonies themselves may shed cells into the circulation that seed the primary tumor, further influencing its evolution.
However, the interaction between circulating tumor cells and the primary tumor is likely not so straightforward. Kim et al. [68] also speculate that a large primary tumor may filter many aggressive cells from the circulation, perhaps decreasing the overall metastatic potential of the tumor. The interaction between the vasculature, circulating cells, and primary cells could be explored in a formal setting, and we suggest it as a potential project.
8.6 Conclusion
Perhaps the most obvious conclusion one can draw from this review is that existing mathematical theory provides significant insight into the causes of necrosis, overall tumor diversity (coexistence of different developmental lineages within the tumor), clonal diversity (diversity within the malignant lineage) and metastasis. Mathematical oncology provides a much richer theory than that underlying explanations of these phenomena in standard pathology texts or even the massive compendium edited by Vincent DeVita et al. [35]. In essence, these more clinical sources either treat them as largely explained or ignore them altogether. But as insights from existing theory make clear, these phenomena are far from adequately explained.
Unfortunately most of these insights have gone largely unexploited by the empirical cancer biology community. To see this in a very profound way, compare the literature-cited sections of the basic cancer biology chapters in [35] and the historical review of mathematical oncology in [12]. The former is a compendium of modern cancer biology from a pathologist’s or clinician’s standpoint, and the latter is an outstanding review of the major themes in mathematical oncology. Despite their focus on the same disease, these two sources share very few citations, especially theory papers. Traditionally, each group tends to be unaware of the other’s literature, although there are some notable exceptions.
Trying to establish why mathematical oncology has influenced the work of experimentalists and medical doctors so lightly is dangerous business, but ignoring it is even more dangerous. One possibility, perhaps the most obvious, may be that the two groups by and large cannot communicate because they speak different technical languages, and translators are rare. Hopefully this situation is changing as more students seek training in both advanced molecular biology and mathematics—the very students to whom this text is addressed. Nevertheless, despite its obvious appeal, this explanation cannot be the only reason for the disconnect, because although rare, very talented translators have always existed between the empirical and theoretical communities.
Another contributing factor to the lack of knowledge transfer may also be the wildly different research focuses of the two groups. As discussed in the introduction, empirical cancer biologists tend to focus on the molecular biology of cancer cells, as is obvious from a casual inspection of any empirical cancer journal from the last four decades. Mathematical oncologists, on the other hand, tend to focus on aspects of tumor ecology like those reviewed here, plus immune predation, the effects of cytotoxic chemotherapy and radiation therapy on competition among tumor clones, and other aspects of tumor ecology. So, the outlook, interests, and research tools characteristic of experimentalists and theoreticians have traditionally differed so much that there has been very little overlap in research programs. Again, a look through DeVita et al. [35] makes clear that the practice of oncology would hardly be changed if no one had ever written a mathematical model of cancer.
The question then becomes, where, if anywhere, will empirical and mathematical oncology meet? In particular, how best can mathematical oncology serve experimentalists by helping direct their work in the lab and clinic? Certainly the insights gained so far by mathematical oncology should not be abandoned, and work on specific systems, especially drug trials on cell cultures and angiogenesis inhibition, along with other recent collaborations between empiricists and theoreticians, are increasingly building momentum. However, one major question of growing importance appears to be a perfect place where the interests and tools of molecular biologists, experimental cell biologists, and mathematical biologists meet. That question is, what precisely is the role of the tumor microenvironment—including the malignant lineage(s), ECM and stromal cells, vascular, immune and peritumoral cells—in generating, promoting and maintaining malignancy? This question obviously involves molecular and cellular biology. Genes for growth factors like the various forms of VEGF, their receptors, such as flt-1, matrix metalloproteinases, and a host of other molecules, choreograph all interactions among all cell types and even nonliving elements within malignant and premalignant tumors. But these interactions are primarily ecological in nature, ultimately determining the outcome of competition, cooperation, and predation. Mathematical oncologists can attack this problem with extensions of formalisms already in place, like multicell spheroids with mixtures of cell types currently under investigation by empiricists [91]. More important, mathematical oncologists must move beyond the MCS and build formalisms representative of more realistic geometries encountered in carcinoma, especially when modeling nascent tumors. But, no matter how one attacks the problems posed by malignant neoplasia, the time has arrived to begin melding the molecular and evolutionary ecology approaches to cancer biology, and the mathematical oncology community has, above all others, the skill set to do it.
8.7 Exercises
Exercise 8.1: For the angiogenesis model (8.30), assume that x2(t) ≡ 0, x1(0) > 0. Further, suppose Φ1(v) ∈ C1, is monotonically increasing with Φ1(0) < 0 but limv→∞ Φ1(v) > 0. Also, suppose that h1(v) ∈ C1, is unimodal (monotonically increasing to the left and monotonically decreasing to the right of the mode), and that h1(0) = limv→∞ = 0. Finally, let w = y/x and v = z/x. Assume that x(t) > 0 for all t.
- 1. Interpret in words the biological meanings of the variables w and v.
- 2. Show that model (8.30) can be written in the form:
- 3. Show that there are two “boundary” fixed points of model (8.39): the origin (i.e., the point (0, 0)) and the point (ṽ, 0), where ṽ satisfies
- 4. Show that, if there is an “interior” equilibrium (one in which w, v > 0), then v = v̂, where v̂ satisfies
- 5. Analyze the local stability of these interior fixed points, assuming any exist.
Exercise 8.2: As an advanced project, develop the model suggested in Section 8.5.1. That is, develop and analyze as far as you can a model of subsequent colonizations of successive “Halstedean curtain walls” and selective forces driving metastasis in each. What predictions does your model make about how metastatic aggressiveness will change as disease burden increases over time in a single patient?
References
[1] Adam JA: General aspects of modeling tumor growth and immune response. In: A Survey of Models for Tumor-Immune System Dynamics. Adam JA, Bellomo N, eds. Berlin: Birkhäuser, 1997, 15–87.
[2] Agur Z, Arakelyan L, Daugulis P, Ginosar Y: Hopf point analysis for angio-genesis models. Disc Cont Dyn Sys B 2004, 4:29–38.
[3] Alarcón T, Byrne HM, Maini PK: A cellular automaton model for tumor growth in inhomogeneous environment. J Theor Biol 2003, 225:257–274.
[4] Alarcón T, Byrne HM, Maini PK: Towards whole-organ modelling of tumour growth. Prog Biophys Mol Biol 2004, 85:451–472.
[5] Alberts B, Bray D, Lewis J, Raff M, Roberts K, Watson J: The Molecular Biology of the Cell, 3rd ed. New York: Garland, 1994.
[6] Ambrosi D, Mollica, F: On the mechanics of a growing tumor. Int J Eng Sci 2002, 40:1297–1316.
[7] Ambrosi D, Mollica F: The role of stress in the growth of a multicell spheroid. J Math Biol 2004, 48:477–499.
[8] Anderson ARA: A hybrid mathematical model of solid tumour invasion: The importance of cell adhesion. Math Med Biol 2005, 22:163–186.
[9] Anderson ARA, Chaplain MAJ: Continuous and discrete mathematical models of tumor-induced angiogenesis. Bull Math Biol 1998, 60:857–900.
[10] Anderson ARA, Weaver AM, Cummings PT, Quaranta V: Tumor morphology and phenotypic evolution driven by selective pressure from the microenviron-ment. Cell 2006, 127:905–915.
[11] Arakelyan L, Merbl Y, Daugulis P, Ginosar Y, Vainstein V, Selitser V, Kogan Y, Harpak H, Agur Z: Multi-scale analysis of angiogenic dynamics and therapy. In: Cancer Modeling and Simulation, Preziosi, ed. Boca Raton, Fl: Chapman and Hall/CRC, 2003, pp.185–219.
[12] Araujo RP, McElwain DL: A history of the study of solid tumor growth: The contribution of mathematical modelling. Bull Math Biol 2004, 66:1039–1091.
[13] Bach LA, Bentzen SM, Alsner J, Christiansen FB: An evolutionary-game model of tumor-cell interactions: Possible relevance to gene therapy. Eur J Cancer 2001, 37:2116–2120.
[14] Barcellos-Hoff MH, Ravani SA: Irradiated mammary gland stroma promotes the expression of tumorigenic potential by unirradiated epithelial cells. Cancer Res 2000, 60:1254–1260.
[15] Bertuzzi A, D’Onofrio A, Fasano A, Gandolfi A: Regression and regrowth of tumour cords following single-dose anticancer treatment. Bull Math Biol 2003, 65:903–931.
[16] Bertuzzi A, D’Onofrio A, Fasano A, Gandolfi A: Modelling cell populations with spatial structure: Steady state and treatment-induced evolution of tumor cords. Disc Cont Dyn Sys B 2004, 4:161–186.
[17] Bertuzzi A, Fasano A, Gandolfi A, Marangi D: Cell kinetics in tumour cords studied by a model with variable cell cycle length. Math Biosci 2002, 177 & 178:103–125.
[18] Bertuzzi A, Gandolfi A: Cell kinetics in a tumor cord. J Theor Biol 2000, 204:587–599.
[19] Bhowmick NA, Neilson EG, Moses HL: Stromal fibroblasts in cancer initiation and progression. Nature 2004, 432:332–337.
[20] Bickel ST, Juliano JD, Nagy JD: Evolution of proliferation and the angiogenic switch in tumors with high clonal diversity. PLoS ONE 2014, 9:e91992.
[21] Bignold LP: The mutator phenotype theory can explain the complex morphology and behaviour of cancers. Cell Mol Life Sci 2002, 59:950–958.
[22] Bignold LP: The mutator phenotype theory of carcinogenesis and the complex histopathology of tumours: Support for the theory from the independent occurrence of nuclear abnormality, loss of specialization and invasiveness among occasional neoplastic lesions. Cell Mol Life Sci 2003 60:883–891.
[23] Britto Garcia S, Novelli M, Wright NA: The clonal origin and clonal evolution of epithelial tumours. Int J Exp Pathol 2000, 81:89–116.
[24] Burton AC: Rate of growth of solid tumours as a problem of diffusion. Growth 1996, 30:157–176.
[25] Byrne HM: Modelling avascular tumor growth. In: Cancer Modelling and Simulation. Preziosi L, ed., Boca Raton, FL: Chapman and Hall/CRC, 2003.
[26] Byrne HM, Chaplain MAJ: Growth of nonnecrotic tumors in the presence and absence of inhibitors. Math Biosci 1995, 130:151–181.
[27] Byrne HM, Chaplain MAJ: Growth of necrotic tumors in the presence and absence of inhibitors. Math Biosci 1996, 135:187–216.
[28] Chaplain MAJ: Mathematical modelling of angiogenesis. J Neurooncol 2000, 50:37–51.
[29] Chaplain MAJ, Anderson ARA: Mathematical modelling of tumor invasion. In: Cancer Modeling and Simulation. Preziosi, ed., Boca Raton, FL: Chapman and Hall/CRC, 2003. pp.269–297.
[30] Chen CY, Byrne HM, King RJ: The influence of growth-induced stress from the surrounding medium on the development of multicell spheroids. J Math Biol 2001, 43:191–220.
[31] Cotran RS, Kumar V, Collins T: Robbins’ Pathologic Basis of Disease, 6th ed. Philadelphia: Saunders, 1999
[32] Cristini V, Lowengrub J, Nie Q: Nonlinear simulation of tumor growth. J Math Biol 2003, 46:191–224.
[33] De Wever O, Mareel M: Role of tissue stroma in cancer cell invasion. J Pathol 2003, 200:429–447.
[34] Deugnier Y: Iron and liver cancer. Alcohol 2003, 30:145–150.
[35] DeVita VT, Hellman S, Rosenberg SA (eds.): Cancer: Principles and Practice of Oncology, 5th ed. Philadelphia: Lippencott Raven, 1997.
[36] Dingli D, Michor F, Antal T, Pacheco JM: The emergence of tumor metastases. Cancer Biol Ther 2007, 6:383–90.
[37] Dyson J, Villella-Bressan R, Webb G: The steady state of a maturity structured tumor cord cell population. Disc Cont Dyn Sys B 2004, 4:115–134.
[38] Elser JJ, Nagy JD, Kuang Y: Biological stoichiometry: An ecological perspective on tumor dynamics. Biosci 2003, 53:1112–1120.
[39] Evan GI, Vousden KH: Proliferation, cell cycle and apoptosis in cancer. Nature 2001 411:342–348.
[40] Folkman J, Hahnfeldt P, Hlatky L: Cancer: Looking outside the genome. Nat Rev Mol Cell Biol 2000, 1:76–79.
[41] Franks SJ, Byrne HM, King JR, Underwood JCE, Lewis CE: Modelling the early growth of ductal carcinoma in situ of the breast. J Math Biol 2003, 47:424–452.
[42] Friedman A, Reitich F: Analysis of a mathematical model for the growth of tumors. J Math Biol 1999, 38:262–284.
[43] Gammack D, Byrne HM, Lewis CE: Estimating the selective advantage of mutant p53 tumour cells to repeated rounds of hypoxia. Bull Math Biol 2001, 63:135–166.
[44] Gatenby RA: Models of tumor-host interaction as competing populations: Implications for tumor biology and treatment. J Theor Biol 1995, 176:447–455.
[45] Gatenby RA, Gawlinski ET: A reaction-diffusion model of cancer invasion. Cancer Res 1996, 56:5745–5753.
[46] Gatenby RA, Gawlinski ET: The glycolytic phenotype in carcinogenesis and tumor invasion: Insights through mathematical models. Cancer Res 2003, 63:3847–3854.
[47] Gatenby RA, Gillies RJ: Why do cancers have high aerobic glycolysis? Nat Rev Cancer 2004, 4:891–899.
[48] Gatenby RA, Maini PK, Gawlinski ET: Analysis of tumor as an inverse problem provides a novel theoretical framework for understanding tumor biology and therapy. Appl Math Lett 2002, 15:339–345.
[49] Gatenby RA, Vincent TL: An evolutionary model of carcinogenesis. Cancer Res 2003, 63:6212–6220.
[50] Geritz SAH, Kisdi E, Meszéna G, Metz JAJ: Evolutionarily singular strategies and the adaptive growth and branching of the evolutionary tree. Evol Ecol 1998, 12:35–57.
[51] Graeber TL, Osmanian C, Jacks T, Housman DE, Koch CJ, Lowe SW, Giaccia AJ: Hypoxia-mediated selection of cells with diminished apoptotic potential in solid tumours. Nature 1996, 379:88–91.
[52] Greaves M, Maley CC: Clonal evolution in cancer. Nature 2012, 481:306–313.
[53] Greenspan HP: Models for the growth of a solid tumor by diffusion. Stud Appl Math 1972, 52:317–340.
[54] Greenspan HP: On the growth and stability of cell cultures and solid tumors. J Theor Biol 1976, 56:229–242.
[55] Hahn WC, Weinberg RA: Modelling the molecular circuitry of cancer. Nature Rev Cancer 2002, 2:331–341.
[56] Hanahan D, Weinberg RA: The hallmarks of cancer. Cell 2000, 100: 57–70.
[57] Hanahan D, Weinberg RA: The hallmarks of cancer: The next generation. Cell 2011, 144:646–674.
[58] Haeno H, Michor F: The evolution of tumor metastases during clonal expansion. J Theor Biol 2009, doi:10.1016/j.jtbi.2009.11.005
[59] Hann HW, Stahlhut MW, Hann CL: Effect of iron and desferoxamine on cell growth and in vitro ferritin synthesis in human hepatoma cell lines. Hepatology 1990, 11:566–569.
[60] Hayward SW, Wang Y, Cao M, Hom YK, Zhang B, Grossfeld GD, Sudilovski D,Cunha GR: Malignant transformation in a nontumorigenic human prostatic epithelial cell line. Cancer Res 2001, 61:8135–8142.
[61] Hellman S: Principles of cancer managemant: Radiation therapy. In: Cancer: Principles and Practice of Oncology. DeVita VT, Hellman S, Rosenberg SA, eds., Philadelphia: Lippencott-Raven, 1997. ch. 16, 307–332.
[62] Helmlinger G, Netti PA, Lichtenbeld HC, Melder RJ, Jain RK: Solid stress inhibits the growth of multicellular tumor spheroids. Nature Biotech 1997, 5:778–783.
[63] Hirsch MW, Smale S, Devaney RL: Differential Equations, Dynamical Systems, and an Introduction to Chaos, 2nd ed. Amsterdam: Elsevier, 2004.
[64] Holash J, Maisonpierre PC, Compton D, Boland P, Alexander CR, Zagzag D, Yancopolous GD, Weigand SJ: Vessel cooperation, regression and growth in tumors mediated by angiopoietins and VEGF. Science 1998, 221:1994–1998.
[65] Ingber DE: Cancer as a disease of epithelial-mesenchymal interactions and extracellular matrix regulation. Differentiation 2002, 70:547–560.
[66] Jain RK: Normalization of tumor vasculature: An emerging concept in an-tiangiogenic therapy. Science 2005, 307:58–62.
[67] Kianercy A, Veltri R, Pienta KJ: Critical transitions in a game theoretic model of tumour metabolism. Interface Focus 2014, 4:20140014.
[68] Kim MY, Oskarsson T, Acharyya S, Nguyen DX, Zhang XH, Norton L, Mas-sagué J: Tumor self-seeding by circulating cancer cells. Cell 2009, 139:1315–26.
[69] Kuang Y, Nagy JD, Elser JJ: Biological stoichiometry of tumor dynamics: Mathematical models and analysis. Disc Cont Dyn Sys B 2004, 4:221–240.
[70] Kunz-Schughart LA: Multicell tumor spheroids: Intermediates between mono-layer culture and in vivo tumor. Cell Biol Int 1999, 23:157–161.
[71] Landman K, Please CP: Tumor dynamics and necrosis: Surface tension and stability. IMA J Math Appl Med Biol 2001, 18:131–158.
[72] Le NT, Richardson DR: The role of iron in cell cycle progression and the proliferation of neoplastic cells. Biochim Biophys Acta 2002, 1603:31–46.
[73] Lester SC, Cotran RS: The breast. In: Robbins’ Pathologic Basis of Disease, 6th ed. Cotran RS, Kumar V, Collins T, eds., . Philadelphia: W.B. Saunders, 1999, ch. 25, 1093–1119.
[74] Levine HA, Pamuk S, Sleeman BD, Nilsen-Hamilton N: Mathematical modeling of capillary formation and development in tumor angiogenesis: Penetration into the stroma. Bull Math Biol 2001, 63:801–863.
[75] Levine HA, Sleeman BD: Modelling tumor-induced angiogenesis. In: Cancer Modelling and Simulation. Preziosi L, ed., Boca Raton, FL: Chapman & Hall/CRC, 2003.
[76] Liotta LA, Kohn EC: The microenvironment of the tumour-host interface. Nature 2001, 411375–379.
[77] Loeb LA: A mutator phenotype in cancer. Cancer Res 2001, 61:3230–3239.
[78] Loeb LA, Loeb KR, Anderson JP: Multiple mutations and cancer. Proc Natl Acad Sci USA 2003, 100:776–781.
[79] Lundberg AS, Weinberg RA: Control of the cell cycle and apoptosis. Eur J Cancer 1999, 35:1886–1894.
[80] Lynch CC, Matrisian LM: Matrix metalloproteinases in tumor-host cell communication. Differentiation 2002, 70:561–573.
[81] Maley CC, Galipeau PC, Finley JC, Wongsurawat VJ, Li X, Sanchez CA, Paulson TG, Blunt PL, Risques R-A, Rabinovitch PS, Reid BJ: Genetic clonal diversity predicts progression to esophageal adenocarcinoma. Nat Gen 2006, 38:468–473.
[82] Mantzaris NV, Webb S, Othmer HG: Mathematical modeling of tumor-induced angiogenesis. J Math Biol 2004, 49:111–187.
[83] Marusyk A, Polyak K: Tumor heterogeneity: Causes and consequences. Biochim Biophys Acta 2010, 1805:105–117.
[84] Maynard Smith J, Price GR: Logic of animal conflict. Nature 1873, 246:15–18.
[85] Michelson S, Leith JT: Positive feedback and angiogenesis in tumor growth control. Bull Math Biol 1997, 59:233–254.
[86] Michelson S, Miller BE, Glicksman AS, Leith JT: Tumor micro-ecology and competitive interactions. J Theor Biol 1987, 128:233–246.
[87] Michor F, Iwasa Y: Dynamics of metastasis suppressor gene inactivation. J Theor Biol 2006, 241:676–89.
[88] Michor F, Nowak MA, Iwasa Y: Stochastic dynamics of metastasis formation. J Theor Biol 2006, 240:521–30.
[89] Mollica F, Jain RK, Netti PA: A model for temporal heterogeneities of tumor blood flow. Microvasc Res 2003, 65:56–60.
[90] Mueller-Klieser W: Three-dimensional cell cultures: From molecular mechanisms to clinical applications. Am J Physiol 1997, 273:C1109–C1123.
[91] Mueller-Klieser W: Tumor biology and experimental therapeutics. Crit Rev Oncol Hematol 2000, 36:123–139.
[92] Murphy BJ: Regulation of malignant progression by the hypoxia-sensitive transcription factors HIF-1α and MTF-1. Comp Biochem Physiol B 2004, 139:495–507.
[93] Murray JD: Mathematical Biology I: An Introduction, 2nd ed. Berlin: Springer, 2002.
[94] Murray JD: Mathematical Biology II: Spatial Models and Biomedical Applications, 2nd ed. Berlin: Springer, 2002.
[95] Nagy JD: Competition and natural selection in a mathematical model of cancer. Bull Math Biol 2004, 66:663–687.
[96] Nagy JD: The ecology and evolutionary biology of cancer: A review of mathematical models of necrosis and tumor cell diversity. Math Biosci Eng 2005, 2:381–418.
[97] Nagy JD, Victor EM, Cropper JH: Why don’t all whales have cancer: A novel hypothesis resolving Peto’s Paradox. Int Comp Biol 2007, 47:317–328.
[98] Nagy JD, Armbruster D: Evolution of uncontrolled proliferation and the angiogenic switch in cancer. Math Biosci Eng 2012, 9:843–876.
[99] Nowell PC: The clonal evolution of tumor cell populations. Science 1976, 194:23–28.
[100] Nunney L: Lineage selection and the evolution of multistage carcinogenesis. Proc R Soc Lond B 1999, 266:493–498.
[101] Ohuchida K, Mizumoto K, Murakami M, QianL-Q, Sato N, Nagai E, Matsumoto K, Nakamura T, Tanaka M: Radiation to stromal fibroblasts increases invasiveness of pancreatic cancer cells through tumour-stromal interactions. Cancer Res 2004, 64:3215–3222.
[102] Olumi AF, Grossfeld GD, Hayward SW, Carroll PR, Tlsty TD, Cunha GR: Carcinoma-associated fibroblasts direct tumour progression of initiated human prostatic epithelium. Cancer Res 1999, 59:5002–5011.
[103] Ono S: Genetic implication of karyological instability of malignant somatic cells. Physiol Rev 1971, 51:496–526.
[104] Owen MR, Sherratt JA: Mathematical modelling of macrophage dynamics in tumours. Math Mod Methods Appl Sci 1999, 9:513–539.
[105] Park CC, Bissel MJ, Barcellos-Hoff H: The influence of the microenvironment on the malignant phenotype. Mol Med Today 2000, 6:324–329.
[106] Patel AA, Gawlinski ET, Lemieux SK, Gatenby RA: A cellular automaton model of early tumor growth and invasion: The effects of native tissue vascularity and increased anaerobic tumor metabolism. J Theor Biol 2001, 213:315– 331.
[107] Pescramona GP, Scalerano M, Delsanto PP, Condat CA: Non-linear model of cancer growth and metastasis: A limiting nutrient as a major determinant of tumor shape and diffusion. Med Hyp 1999, 53:497–503.
[108] Plank MJ, Sleeman BD: Lattice and non-latice models of tumour angiogenesis. J Math Biol 2004, 66:1785–1819.
[109] Please CP, Pettet G, McElwain DLS: A new approach to modelling the formation of necrotic regions in tumours. Appl Math Lett 1998, 11:89–94.
[110] Please CP, Pettet G, McElwain DLS: Avascular tumour dynamics and necrosis. Math Mod Meth Appl Sci 1999, 9:569–579.
[111] Polyak K, Weinberg WA: Transitions between epithelial and mesenchymal states: Acquisition of malignant and stem cell traits. Nat Rev Cancer 2009, 9:265–273.
[112] Ponder BAJ: Cancer genetics. Nature 2001, 411:336–341.
[113] Quaranta V: Motility cues in the tumor microenvironment. Differentiation 2002, 70:590–598.
[114] Raghunand N, Gatenby RA, Gillies RJ: Microenvironmental and cellular consequences of altered blood flow in tumours. Br J Radiol 2003, 76:11–22.
[115] Roskelley CD, Bissel MJ: The dominance of the microenvironment in breast and ovarian cancer. Cancer Biol 2002, 12:97–104.
[116] Royds JA, Downer SK, Qwarnstrom EE, Lewis CE: Responses of tumour cells to hypoxia: Role of p53 and NFκB. Mol Pathol 1998, 51:55–61.
[117] Shiomi T, Okada Y: MT1-MMP and MMP-7 in invasion and metastasis of human cancers. Cancer Metastasis Rev 2003, 22:145–152.
[118] Sterner RW, Elser JJ: Ecological Stoichiometry: The Biology of Elements from Molecules to the Biosphere. Princeton, NJ: Princeton University Press, 2002.
[119] Stoll BR, Migliorini C, Kadambi A, Munn LL, Jain RK: A mathematical model of the contribution of endothelial progenitor cells to angiogenesis in tumors: Implications for antiangiogenic therapy. Blood 2003, 102:2555–2561.
[120] Subramanian B, Axelrod DE: Progression of heterogeneous breast tumors. J Theor Biol 2001, 210:107–119.
[121] Sutherland RM: Importance of critical metabolites and cellular interactions in the biology of microregions of tumors. Cancer 1986, 58:668–1680.
[122] Sutherland RM, McCredie JA, Inch WR: Growth of multicell spheroids in tissue culture as a model of nodular carcinomas. J Natl Cancer Inst 1971, 46:113–120.
[123] Tam WL, Weinberg RA: The epigenetics of epithelial-mesenchymal plasticity in cancer. Nat Med 2013, 19:1438–1449.
[124] Thalhauser CJ, Sankar T, Preul MC, Kuang Y: Explicit separation of growth and motility in a new tumor cord model. Bull Math Biol 2009, 71:585–601.
[125] Thompson KE, Royds JA: Hypoxia and reoxygenation: A pressure for mutant p53 cell selection and tumor progression. Bull Math Biol 1999, 61:759–778.
[126] Tohya S, Mochizuki A, Imayama S, Iwasa Y: On rugged shape of skin tumor (basal cell carcinoma). J Theor Biol 1998, 194:65–78.
[127] Tomlinson IP, Bodmer WF: Modelling the consequences of interactions between tumour cells. Br J Cancer 1997, 75:157–160.
[128] Tomlinson, IPM: Game-theory models in interactions between tumor cells. Eur J Cancer 1997, 33:1495–1500.
[129] Tomlinson RH, Gray LH: The histological structure of some human lung cancers and possible implications for radiotherapy. Br J Cancer 1955, 9:539–549.
[130] Valk-Lingbeek ME, Bruggeman SWM, van Lohuizen M: Stem cells and cancer: The polycomb connection. Cell 2004, 118:409–418.
[131] Vogelstein B, Fearon ER, Hamilton SR, Preisinger AC, Willard HF, Michelson AM, Orkin SH: Clonal analysis using recombinant DNA probes from the X-chromosome. Cancer Res 1987, 47:4806–4813.
[132] Weinberg RA: One Renegade Cell. New York: Basic Books, 1998.
[133] Weinberg, RA: The Biology of Cancer. New York: Garland, 2007.
[134] Wernert N: The multiple roles of tumour stroma. Virchows Arch 1997, 430:433–443.
[135] Wernert N, Löcherbach C, Wellman A, Behrens P, Hügel A: Presence of genetic alterations in microdissected stroma of human colon and breast cancers. Anticancer Res 2001, 21:2259–2264.
[136] Wogan GN, Hecht SS, Felton JS, Conney AH, Loeb LA: Environmental and chemical carcinogenesis. Sem Cancer Biol 2004, 14:473–486.
[137] Xu Y: A free boundary problem model of ductal carcinoma in situ. Disc Cont Dyn Sys B 2004, 4:337–348.