
Now, we'll build a couple of projects that demonstrate how to use more advanced sensors: a photocell and a temperature sensor. We'll learn how specialized Johnny-Five Sensor objects allow us to make these easier to use, and how to play with inputs in the REPL and show some input data in the console using a module called barcli.
First, we'll start with the photocell—see the following wiring diagram:
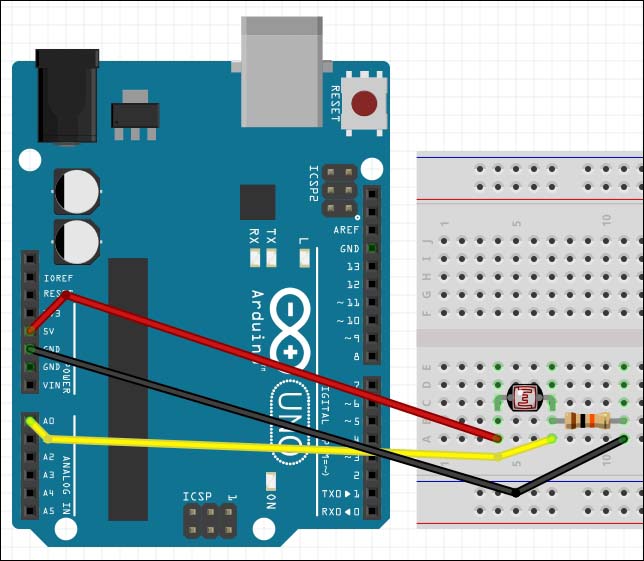
The wiring diagram for the photocell
As we code our photocell example, we'll note that there is no photocell object, so we're going to use the generic Sensor object, as we did with the potentiometer.
As for outputting the data that we get from the sensor, we're going to use a handy utility called barcli to make our output much easier to read.
In the early days of Johnny-Five, one of the most common ways to check sensor data was to log the data on every change event. This got messy and unreadable very quickly, with thousands of lines being printed out to the console with an integer on each line. This is not very useful, as shown in the following:
An output in the days before barcli
Luckily, Donovan Buck (who we'll see again in the Animation chapter) wrote a handy Node module called barcli (pronounced BAHRK-LEE) that makes it easy to render bar graphs in the console. This is the best way to show sensor data in the console, because you can see it being updated in real time, and it's much more readable than thousands of lines of integers!
You can find barcli here: https://github.com/dtex/barcli. In order to install barcli so that we can use it in the same folder as your code, run the following:
> npm install barcli
In order to create our graph with the range of our photocell (0 to 1023), we'll use the following code:
var barcli = require('barcli'),
var graph = new barcli({
  label: 'photocell',
  range: [0, 1023]
});
To set the graph, we'll use the following:
graph.set([photocell value]);
These graphs are much easier to read, as shown in the following example:
A barcli graph in the console
Using our knowledge of Johnny-Five, the Sensor object, and now barcli, we can write the following in photocell.js:
var five = require('johnny-five'),
var Barcli = require('barcli'),

var board = new five.Board();
var graph = new Barcli({
  label: 'Photocell',
  range: [0, 1023]
});

board.on('ready', function(){
  var photocell = new five.Sensor('A0'),

  photocell.on('data', function(){
    graph.update(this.value);
  });
});
Now that we've written the code, run it with the following:
> node photocell.js
The bar graph in your console should be updated as you cover up or shine a light on the photocell.
Now that we've explored a typical Sensor object, let's take a look at a specialized one using our temperature sensor. We'll write a small application that logs in to bar graphs the temperature detected by the sensor in Fahrenheit, Celsius, and Kelvin.
Use the following wiring diagram to wire up your TMP36 or LM35 temperature sensor:

Wiring up the temperature sensor
Tip
One way to check that your TMP36 or LM35 is wired correctly is by wiring it up and then plugging the board into your computer. Put your fingers near the temperature sensor. Do they feel warm? Then you have the ground and the power flipped. The diagram assumes the flat side is facing you—remember this, but it's always good to double-check!
Looking at the API for the temperature sensor object, we'll notice that there are no special API calls. However, there are special attributes of the this object inside our data event handler. These attributes allow us to access the Fahrenheit, Celsius, and Kelvin readings for our temperature sensor without doing the translation math ourselves.
With our prior knowledge of Sensor objects and barcli, we can write the following in temperature.js:
var five = require('johnny-five'),
var Barcli = require('barcli'),

var board = new five.Board();

var fahrenheitGraph = new Barcli({
  label: 'Fahrenheit',
  range: [20, 120]
});

var celsiusGraph = new Barcli({
  label: 'Celsius',
  range: [6, 50]
});

var kelvinGraph = new Barcli({
  label: 'Kelvin',
  range: [250, 325]
});

board.on('ready', function(){
  var temp = new five.Temperature('A0'),

  temp.on('data', function(err, data){
    fahrenheitGraph.update(data.fahrenheit);
    celsiusGraph.update(data.celsius);
    kelvinGraph.update(data.kelvin);
  });
})
Now, we just run this with the following:
> node temperature.js
We should see three bar graphs in the console as follows:

The temperature.js console output
Try putting something warm or cold near the sensor to see how the bar graph changes!