Chapter 11. Reporting
Out of all of the information in this book, the most important topics are covered in this chapter. Although you can spend a lot of time playing with systems, at the end of the day, if you don’t generate a useful and actionable report, your efforts will have been more or less wasted. The objective of any security testing is always to make the application, system, or network more capable of repelling attacks. The point of a report is to convey your findings in a way that makes it clear what your findings are and how to remediate the finding. This, just like any of the testing work, is an acquired skill. Finding issues is different than communicating them. If you find an issue but can’t adequately convey the threat to the organization and how to remediate it, the issue won’t get fixed, leaving it open for an attacker to come and exploit.
A serious issue with generating reports is determining the threat to the organization, the potential for that threat to be realized, and the impact to the organization if the threat is realized. It may be thought that to indicate issues are serious, using a lot of superlatives and adjectives to highlight the issue would be a good way to get attention. The problem with that approach is that it’s much like the proverbial boy who cried wolf. You can have only so many severity 0 issues (the highest priority event) before people quickly become aware that nothing you have rated can be trusted. It can be hard if you take information security seriously, but it’s essential to remain objective when reporting issues.
Where Kali comes in here, aside from doing the testing, is providing tools that can be used to take notes, record data, and help organize your findings. You could even write your report in Kali Linux, since word processors are available in Kali. You can use Kali Linux for all of your testing, from preparation to performing to gathering data, and finally, writing reports.
Determining Threat Potential and Severity
Determining a threat’s potential and severity is one of the more challenging parts of security testing. You will need to determine the threat potential and risk that is associated with any of your findings. Part of the problem with doing this is that people sometimes have an unclear understanding of what risk is. They may also not understand the difference between risk and threat. Before we go too far down the road of talking about determining the threat potential and severity, let’s all get on the same page with respect to our understandings of these terms. They are critically important to understand so you can make a clear, understandable, and justifiable recommendation.
Risk is the intersection of probability and loss. These are two factors you need to get a quantitative figure for. You can’t assume that because there is uncertainty, there is risk. You also can’t assume that because the loss may be high, there is risk. When people think about risk, they may tend to catastrophize and jump to the worst possible scenario. That only factors in loss, and probably does a poor job at that. You need to factor in both loss and probability. Just because crossing the road, for example, can lead to death were you to be hit by a car, doesn’t make it an endeavor that incurs a lot of risk. The probability of getting hit by a car, causing the loss of life, would be small. This probability also decreases in certain areas (the neighborhood I live in, for instance) because there is little traffic, and what traffic is around is going fairly slow. However, in urban areas, the probability increases.
If you had an event that was extremely likely, that doesn’t mean you have much in the way of risk either. It doesn’t seem that uncommon for people to use the words risk and chance interchangeably. They are not the same. You need to be able to factor in loss. This is a multidimensional problem. Think about the case of crossing the street. What are the potential loss scenarios there? Death is not the only potential for loss. That’s just an absolute worst-case scenario. There are so many other cases. Each will have its own probability and loss. Let’s say our concern is not picking my feet up enough to get over the curb from the street to the sidewalk. Were I to miss, I might trip. What is the potential loss there? I may break a wrist. I may get abrasions. What is the probability for each of these situations? It’s unlikely to be the same for each.
You will hear that quantitative is much better than qualitative. The problem with that is that quantitative is hard to come by. What is the actual probability that I might fall? I’m not especially old and am in reasonable shape, so it seems to me like the probability is probably low. What is the numeric value of that? I have no idea. Sometimes the best we can do is low, medium, high. Adding adjectives to these values isn’t meaningful. What does very low mean? What does very high mean? Unless you can make your intended meaning clear, adjectives will only raise questions. What you may do is use comparatives. Getting skin abrasions is probably a higher probability than breaking a bone, but both are low probability. Is this a useful distinction? Perhaps. It gives you a little more space to make some priorities.
A threat is a possible danger. When we talk about danger, we are talking about something that may take advantage of a weakness or vulnerability to cause harm or damage. An attack vector, a term sometimes used when we are talking about threats and risk, is the method or pathway an attacker takes to exploit a vulnerability.
Let’s pull all of this together now. When we are calculating a value to assign for a severity of a finding, you have to factor in the probability that the vulnerability found may be triggered. This itself has a lot of factors. You have to think about who the threat agent is (who is your adversary), because you need to think about mitigations that are in place. Let’s say you are evaluating the security posture of an isolated system. Who are we most concerned about? If there are multiple badging points between the outside and the system, where one of them is a mantrap, the probability is extremely low if we’re thinking about an outside adversary. If it’s an inside adversary, though, we have to think about a different set of parameters.
Once you have thought through who your adversary is and the probability, you then have to think about what happens if the vulnerability is exploited. Again, you can’t think about the worst-case scenario. You have to think rationally. What is the most likely scenario? Who are your adversaries? You can’t use movie scenarios when you are working on this. What is the highest-priority resource? This may be data, systems, or people. Any of these are fair game when it comes to attacks. Each will have a different value to the organization you are doing testing for.
Don’t assume, however, that what you think a business cares about has any relation at all to what an attacker cares about. Some attackers may want to gather intellectual property, which is something businesses will care a lot about. Other attackers are just interested in gathering personal information, installing malware that can be leveraged to gain money from the business (think ransomware), or maybe even just installing software that turns systems into bots in a large network. Attackers today may be criminal enterprises as often as they are anything else. In fact, you may assume that’s generally the case. These people can make a lot of money from attaching systems to botnets and renting out their use.
Once you have all of this data thought through with respect to each of your findings, you can start writing up the report. When you write up your findings, make sure you are clear about your assumptions with respect to your adversary and motivations. You have two sides to this equation. One is what the business cares to protect and apply resources to, and the other is what the adversary is actually looking for. One may have nothing to do with the other, but that doesn’t mean there aren’t some points of intersection.
Writing Reports
Report writing is important. It’s hard to overstate that fact. Different situations will have different needs when it comes to reporting. You may be working in a situation where there is a template you have to plug data into. If that’s the case, your job is easier. Not easy, but easier than starting from nothing. If you are without a template to use, there are some sections you might consider creating when you are writing your report. These are the executive summary, methodology, and findings. Within each of these are elements you may consider.
Audience
When you are writing reports, you need to consider your audience. You may be interested in writing up excruciating detail about exactly what you did because you found it really cool, but you have to consider whether the person you expect to be reading your report will care. Some people will want to know the technical details. Others will want an overview with just enough detail to demonstrate that you know what you are talking about. You need to be aware of the kind of engagement you are on so you can write your report accordingly.
There are a couple of reasons for this. First, you want to spend a reasonable amount of time on writing the report. You don’t want to spend too much time, because your time is valuable. If you aren’t getting paid to do it, you could be spending your time doing something that you are getting paid to do. If you don’t spend enough time on the report, you probably aren’t providing enough information to your client or employer that will cause them to want to keep using you. If you are a contractor, you want repeat business. If you are in-house doing your testing, you likely want to keep your job.
This brings up another situation to consider when it comes to audience. Are these people you work for? Who is going to be reading the report? Depending on who you think will be reading the report, you may be able to skip different segments or at least change their focus. Are you starting to see here how difficult and important report writing can be? No matter who you are writing for, you need to make sure you are putting your best foot forward. Not everyone can write well and clearly. If you don’t, you may want to make sure you have an editor or someone who can help you out with the writing aspect.
One last thing to consider with respect to audience: you may find that there are different audiences for different sections of your report. Again, this may be situationally dependent. You need to consider what section you are working on and what information you need to convey as well as the best way to convey that information.
Executive Summary
An executive summary is tricky. You want to convey the important elements from your testing. You want to do it succinctly. These two requirements may be conflicting. This is where some experience can be beneficial. After you’ve written a few reports, especially if you can get some feedback as you go, you will start to get the balance of how much detail to provide in order to keep the interest of those who are reading it. The most important part of the executive summary may be the length. Remember that the people who are likely to spend the most time on the executive summary are people who don’t understand the technical details, so they want an overview. They won’t read five to ten pages of overview. If you have so much detail that it takes that much time to provide a summary, consider that your test is probably improperly scoped.
My own rule of thumb when it comes to writing executive summaries is try to keep it to a page if at all possible. If absolutely necessary, you can go to two pages, but no more than that. Of course, if you have a lot of experience with a particular group you are writing for, you may find that more or less works better. None of these are hard rules to follow. Instead, they are guidelines to consider.
You should start your report with some context. Indicate briefly what you did (e.g., tested networks X, Y, and Z). Indicate why you did it (e.g., you were contracted, it was part of project Wubble, etc.). Make it clear when the work happened. This provides some history in case the report needs to be referred to later. You will know what you did and why you did it, as well as who asked you if that’s relevant.
It’s probably also useful to mention that you had a limited amount of time to perform the testing—no matter who you are working for, you will be time-bound. There is some expectation to get the testing done in a reasonable period of time. The difference between you and your adversaries is they have considerably more time to attack. There is also, perhaps, more motivation on their part.
Imagine you’re a car salesman and you have a quota. You’re getting down to the last of the month and haven’t met your quota yet. This is much like your adversary. Your adversaries are people who make their money, probably, attacking your site (selling cars). If they aren’t successful, they don’t make money, so you can think a little in terms of quotas for your attackers. The reason for mentioning this is that there may be an unrealistic expectation that if all the issues in the report are remediated, there will be no ways for attackers to get in. Management may get a false sense of security. It’s helpful to clearly set expectations. Just because you were able to find only seven vulnerabilities in the time you had doesn’t mean that an attacker with far more time wouldn’t be able to find a way in.
In the executive summary, provide a brief summary of findings. You may find the best way to do this is providing numbers of the different categories of findings. Indicate how many high-priority findings, medium-priority findings, low-priority findings, and informational findings. With the numbers, hit the high notes. Provide a brief summary of what you found. You found five vulnerabilities, which could all lead to data exfiltration, for instance. Whatever way you can bundle issues together that makes sense and is meaningful can work here—just so you are providing a little understanding of what you found.
The goal of the summary and the highlights is to help executives, who are only going to read this section, understand where they stand with respect to issues their infrastructure may be facing. Additionally, they can get some insight into some quick-hit items that can get them some big wins. Anything you can provide in this section to highlight potential wins for the information technology (IT) team can be beneficial.
You may also find it useful to create charts. Visuals are useful. They make it easier to see what’s happening. You can easily plug values into Excel, Google Sheets, SmartSheet, or any other spreadsheet program. They don’t have to take up a lot of space. You are, after all, considering ways to keep the report short and to the point. However, taking a little space for some charts and tables to make your points clear may go a long way.
Keep in mind that you are not writing this report to scare anyone. It is not your job to suggest the sky is falling. Be objective and factual without resorting to sensationalism. You will get much further if you are to the point and rely on the facts to speak for you. Always keep in mind, and you’ve heard this before, that your objective is to help improve the application, system, or network you have been engaged to test. You want to increase the security position, making it harder to compromise.
Methodology
The methodology is a high-level overview of the testing that was performed. You may indicate that you performed reconnaissance, vulnerability testing, exploitation testing, and verifications of findings. You can indicate whatever steps you take to perform your testing. You don’t need to get granular and include any test plan with specific steps. Just keep it high level. If you provide a methodology, you are making it clear that you have a process and are not just approaching testing randomly. Having a defined process means you can repeat your results. This is important. If you can’t repeat a finding, you need to think carefully about whether to report it. Again, your objective is to present issues that can and should be fixed. If you can’t repeat a finding, it’s not something that can be fixed.
When you report your methodology, it may be helpful to include the toolset you use. There are a few reasons for this. This is an area some people are a little squeamish about, because they feel they may be giving away trade secrets that set them apart from others. The reality is that there are tools that nearly everyone uses. Telling your client or employer that you are using them isn’t going to be a big revelation. There are common commercial tools. There are common open source tools. The reality is, the toolset isn’t where the magic is. The magic is all in how you use the tools, interpret the results, verify the results, and do the work to determine the risk and then provide remediation recommendations.
Findings
The Findings section is where the bulk of the report is, probably unsurprisingly. There are a lot of ways to format this section, and you can probably include a lot of different sets of details. One thing to consider, though, is the way you structure it. There are countless ways of organizing your findings, including by system or by vulnerability type. I have generally organized findings by severity because people I’ve worked for want to see the most important issues first so they can prioritize. You may find other organizational methods work better for you. Using severity, you would start with the high-priority issues, then medium and low, and end with informational. I’ve found the informational items to be useful. These are issues that might not necessarily be a threat but may be worth mentioning. This may be where you noticed an anomaly but couldn’t replicate it. It may be something that would be serious if you could replicate it. Keep in mind that exploits can be hit-or-miss for some conditions. You may not have had the time to be able to reproduce the right conditions.
You may find that different situations will have different needs when it comes to providing information related to each finding. However, in general, there are some factors to consider. The first is to provide a short description of the finding to use as a title. This helps you to index the findings so they can be placed into a table of contents and found quickly by those reading the report. After that, you should make sure to add your details related to the severity. You may provide an overall rating and then also include the factors that go into the overall rating—probability and impact. The impact is what may happen if the vulnerability were triggered. How is the business affected? You don’t want to assume anything other than the vulnerability. You can’t assume subsequent vulnerabilities or exploits. What happens if that vulnerability is exploited? What does an attacker get?
The vulnerability needs to be explained in as much detail as possible. This can include specifics about what the attacker gets in order to justify the severity rating you made. Explain how the vulnerability can be exploited, what subsystems are affected, and any mitigating circumstances. At the same time, you should be providing details and a demonstration that you were able to exploit it. This can be screen captures or text-based captures as needed. Screen captures are probably the best as a way of demonstrating what you did. Text is too easily manipulated or misinterpreted. Keep in mind that you will be putting this report into the hands of others. You want it clear that you performed the exploit, gained access, retrieved data, or whatever you managed to do.
It may be helpful to provide references. If what you found has a Common Vulnerabilities and Exposures (CVE) number or a Bugtraq ID (BID), you should consider providing a link to those reports. You may also consider providing links explaining the underlying vulnerability. As an example, if you managed to use a SQL injection attack, providing a link clearly explaining what a SQL injection attack is will be useful in case some people aren’t as familiar. Finally, you should absolutely put remediation steps in. You may not be familiar with the company’s processes if you are a contractor or even in another group entirely. As a result, just an overview rather than an entire procedure will be good. You want to make it clear that you are here to help them. Even if you are doing a complete red versus blue scenario and everything was black box, you still don’t want the report to be adversarial when it comes to letting them know where their shortcomings are.
You can include appendices as they seem useful. There may be details that are just too long to include in findings, or there may be details that are relevant across multiple findings. These can go into appendices and referred to in your report. One thing you should not do is include entire reports from your vulnerability scanner or your port scanner. You are being paid, unless otherwise specified, to cull through those reports yourself and determine what’s worthwhile to look at. Resist the urge to include them just to make the report look longer. More isn’t better in most cases. Make sure your audience has enough information to understand what the vulnerability is, how it was and can be exploited, what can happen, and what to do about it. This is where you will demonstrate your value.
Taking Notes
You could be working on testing for a client or an employer for a couple of weeks. It’s unlikely that you’ll remember everything you did and in what order over that period of time. If you get screen captures, you will want to document each. This means taking notes. You can, and some people prefer this, take them in a physical notebook. These can be damaged or destroyed, though, especially if you are working long hours and on-site with a customer. This is not to deter you from this approach if it suits you best. However, Kali comes with tools that can assist you with taking notes. Since you are working in Kali already, you can take a look at how to use these tools.
Text Editors
Decades ago, now, were the vi versus emacs wars. They were long. They were bloody. They saw zealots on both sides entrenched in their opinions as to which was the better editor. It seems as though that war is over, and a victor has been declared. The winner in the end appears to have been vi. Both of these are text editors designed, initially anyway, to be used in a terminal, which later became a terminal window in a larger managed display. There are two significant differences between vi and emacs. First, vi is what is referred to as a dual-mode editor. You have edit mode and you have command mode. With emacs, there are no modes. You can edit and send commands without having to do anything. The other significant difference is that emacs uses key combinations for commands. You may use the Alt, Ctrl, Shift, and Option keys. You may have to press multiple keys simultaneously to send a command to emacs. This frees up the rest of the keyboard, where you would normally do typing, to enter text. By comparison, vi, as a dual-mode editor, uses a mode change to let the user send commands.
Let’s go over the basics of both editors, starting with vi, since it is the more predominant editor. It’s also the only editor installed by default in Kali. If you want to use emacs, you need to install it. As noted earlier, vi is a dual-mode editor. When you start up vi, you are in command mode. One of the reasons for this is that when vi was written, keyboards may not have had arrow keys; other keys had to be dual-purposed to allow you to maneuver around the text. The letters H, J, K, and L are all used to maneuver around the text. H is left, J is down, K is up, and L is right. Those keys replace your arrow keys.
To send more-complex commands or commands that are not specific to moving around or altering the text on the screen, you would type : (colon). If you want to write out (save), you type w. To quit the editor, you type q. You can put the two of these together, saving and quitting in the same command, and type :wq, you’d be back at a command prompt with your file written out to disk. You may find a case where you made changes you didn’t mean to make. You can force a quit without a write by typing :q! since the ! lets vi know that you want to override any concerns or issues, if you can.
This is an editor that is so complex that it takes books to explain all its capabilities. However, you don’t need to know an awful lot about the density of commands and configurations you can use in vi. To edit, you need to know how to get into editing mode and then how to return to command mode. From command mode, you type a for append, and i for insert. Just the lowercase a places you after the character you are at and in editing mode so you can start typing text. The capital A places your cursor at the end of the line and in edit mode. The difference between a and i is that the i lets you start placing characters right where you are (before the character you are at), whereas the a is after. The Esc key takes you from edit mode to command mode.
vi has a lot of customization capabilities. This lets you get a working environment you are comfortable in. You can make changes, like adding in line numbers, by just using :number. This makes the change to the session you are in. If you want to make the change persistent, you need to add all the settings in the .vimrc file. The older vi editor is most commonly implemented by the vi Improved (vim) package so you make changes in the resource file for vim rather than vi. To set values, you would use set number as a line in the .vimrc file. The set command sets a parameter. You may want to add values, so you can add that to the end of the line. As an example, you can set the tab stop, the column positions, by using set ts 4. This means when you hit the Tab key, your cursor will move to the column that is the next multiple of 4.
emacs is a completely different editor altogether. When you load up emacs, you are immediately editing. You can start typing text. If you aren’t comfortable keeping track of whether you are in edit mode or command mode, you can use emacs. You would need to install it first, of course. Since there is no command mode, the expectation is that your keyboard has arrow keys. If you want to save the file, you would press Ctrl-X, Ctrl-S. If you want to just quit emacs, you can press Ctrl-X, Ctrl-C. If you want to open a file, you would press Ctrl-X, Ctrl-F.
Of course, just as with vi/vim, there is far more to emacs than what we’ve covered here. The idea is to give you just enough that you can start entering data into a plain-text file. If you want to do more customization or editing, there are a lot of resources that you can use to learn more editing commands and how to customize the environment to work the way you want. If you really want to use a GUI version, there are GUI-based versions of both emacs and vi. There are other GUI editors and note-taking apps as well.
GUI-Based Editors
Both vi and emacs are available as GUI programs. Using these programs, you can use the commands in the way they work in the console-based applications, but there are also menus and toolbars you can use as well. If you want to migrate to using one of these editors, using the GUI-based program may be a way to get you started. You can rely on the menus and toolbars until you feel more comfortable with the keyboard commands. One advantage of using console-based editors is that your hands are already on the keyboard typing. Moving to a mouse or a trackpad requires changing your hand position, and altering your flow. If you get familiar with the keyboard commands, it just becomes part of your typing without altering your hand position. Figure 11-1 shows the gvim editor, which is the graphical version of vim. This is the startup screen if you don’t open a file. You can see the hints that are provided for using keyboard commands.

Figure 11-1. The Gvim editor
In addition to that, however, other programs can be used to take notes and jot down ideas. You may be familiar with the basic text editor that you can get on most operating system implementations. Kali Linux also has one of those, unsurprisingly called Text Editor. It is simple. It is a graphical window where you can edit text. You can open files. You can save files. There isn’t much more, though, to this application. Other programs in Kali Linux are much more capable than this editor.
One of these is Leafpad. Whereas Text Editor is basic, with no frills, Leafpad offers the same capabilities you would normally expect in a GUI-based text editor. You get menus, just like those in the Windows text editor. You can also use rich text, allowing you to change fonts including bold face and italics. This may help you to better organize your thoughts by letting some stand out.
Notes
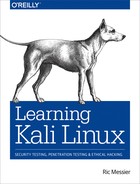
You may find it useful to just take notes individually. You may have run across applications that implement sticky notes. Kali Linux comes with the same sort of application. Figure 11-2 shows the Notes apps. This will look much like the Notes applications you are probably used to seeing. The idea of these applications is to replicate Post-It Notes. What you see in this screen capture is the note window pulled open to accommodate the flyout menu. Normally, the window you have is narrower than what you see here—more like the regular size Post-It Notes.
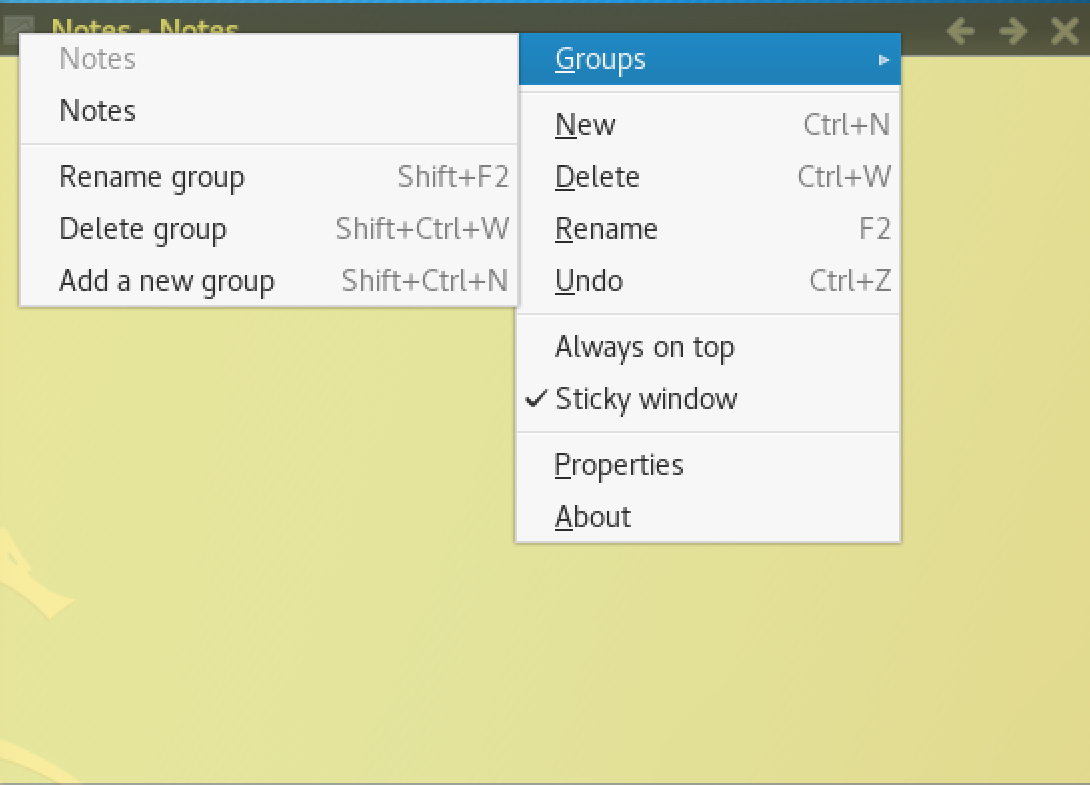
Figure 11-2. Notes application
An advantage to using this approach is, much like the idea of Post-It Notes—you write down something in a note and then paste it on the screen so you can refer to it later. It’s a good way to capture commands you may want to paste in to a terminal window later. Rather than a single text file carrying a large number of notes, you can have individual notes in separate windows. Much of this depends on how you like to organize yourself.
Capturing Data
When you get around to writing your reports, you will need screen captures. You may also want other artifacts. Screen captures are easy enough to handle. GNOME, as a start, works like Windows in this regard. You can use the PrtScn button to capture the desktop. Alt-PrtScn will let you capture a single window, and Shift-PrtScn will allow you to select a rectangle to capture. Additionally, you can use the ScreenShot application. Once you have the images you want, you can use an image editor like Gimp to crop or annotate as you need to. You may be able to find other utilities that will capture the screen or sections of it. These screen captures are going to be the best way to introduce artifacts into your report.
In some cases, you may have a need to record entire sequences of events. This is best done using a screen recording application. Kali includes a utility called EasyScreenCast that’s an extension to GNOME. Figure 11-3 shows the upper right of the screen in the GNOME desktop. You will see the movie camera icon in the top panel. This is how you get access to EasyScreenCast. Underneath the menu for the extension is the options dialog box. This will generate a file in WebM format stored in the Videos directory of your home directory. This is something you may need to have for complex operations or it may simply be a way to capture your actions as you are experimenting so you can play it back later and know how you got where you are.

Figure 11-3. EasyScreenCast in Kali Linux
Another utility you may find interesting or useful is CutyCapt. This lets you grab screen captures of entire web pages. You provide the URL, and CutyCapt generates an image from the page source. This is another command-line tool, and you can use the result in the document as an image. This utility will capture the entire web page and not just a section of it. There are advantages and disadvantages to this. The capture may be too large to fit into a document, but you may have other reasons to keep the web page in an image form. Figure 11-4 shows the result of running cutycapt --url=https://www.oreilly.com --out=oreilly.png.

Figure 11-4. Output from CutyCapt
This output is from the entire O’Reilly home page. This particular capture is multiple pages in length. You can scroll through the static image just as you would be able to from a web page. The utility uses WebKit to render the page exactly as a web browser would. This allows you to capture an entire page rather than just snippets.
Organizing Your Data
There is so much more to keeping notes than just a few text files and screen captures. Additionally, when it comes down to it, you may need to organize more than your results. Tools can help keep you organized. Kali provides a few tools that function in different ways for different purposes. You may find that one of them suits the way you think better than others. We’re going to take a look at the Dradis Framework, which is a way of organizing testing and findings. It will help you create a test plan and organize it and then provide a way to organize and document your findings. Additionally, we’ll take a look at CaseFile, which uses Maltego as an interface and framework for keeping track of details related to the case you are working with.
Dradis Framework
The Dradis Framework comes installed in Kali Linux. It’s a framework that can be used to manage testing. You can keep track of the steps you expect to take as well as any findings that you have. You access Dradis through a web interface. You can get to the link that opens it through the Kali menu, but the menu item will open a web browser taking you to http://127.0.0.1:3000. The first thing you will have to do is create a password and a username. Once you have logged in, you will be presented with a page that looks like the one in Figure 11-5. This screen capture shows one issue that has been reported. Of course, if you had a fresh install, your page would show nothing.

Figure 11-5. Starting page of Dradis Framework
You will notice along the left side that there is an item referring to Methodologies. This will take you to a page that looks like Figure 11-6. Dradis will have an initial methodology in place that shows you what an outline view will look like. The titles of each entry are reflective of what the entry is. What you see in the screen capture is that initial methodology edited to reflect the type of testing we are working on. This would be the start of a basic penetration test. You can have multiple methodologies you can keep track of for various types of testing. You may have one for web application testing, one for penetration testing, and one for performance testing.

Figure 11-6. Methodologies in Dradis
Once you have a methodology and start testing, you will want to start creating issues. These are all text-based but multilayered. You can create an issue with a title and a description, but once you have an issue created, you can also add evidence. You can have multiple pieces of evidence to add to each issue. Figure 11-7 shows an open issue being created. Once the issue has been created, you can reopen it and there will be a tab for evidence. The evidence follows the same basic structure as an issue.

Figure 11-7. Opening an issue in Dradis
The issue you see in Figure 11-7 was created using a template with basic fields. You could also create an issue with just a blank template if you prefer. Underneath the hood, Dradis is using MediaWiki and VulnDB to manage the issues and methodologies. Along with the text-based evidence you can add to the issues, you can also add the output from tools. Dradis has plug-ins that understand the output from the different programs you may have used to perform testing. This includes commercial tools as well as open source programs. The tools that are included in Kali (such as Burp Suite, Nmap, OpenVAS, and ZAP) are all supported with plug-ins in Dradis.
In addition to being able to organize data for you, Dradis is intended, as much as anything else, to be a collaboration tool. If you are working with a team, Dradis can be a central repository of all the data you are working with. You can see the findings or issues that the other members of your team have found. This can save you time by making sure you aren’t chasing down issues that have already been handled.
CaseFile
CaseFile is not a tool you would normally use to manage a test and archive test results. However, it is a tool that can be used to keep track of events. As CaseFile is built on top of Maltego, it has the same graph structure and organization as Maltego does. You can still use the entities and relationships that you would have in place with Maltego. Starting with a blank graph, we can start adding nodes. Each of these nodes will have a set of characteristics. Figure 11-8 shows the start of a graph with one node. The context menu shows that you can change the type of the node to something more relevant to what we are doing. The left side of the screen shows some basic node types you drag into the graph before you edit them with additional details.

Figure 11-8. Basic CaseFile graph
Each node has a set of properties that you can alter as you need to, based on the details you want to capture. Figure 11-9 shows the details dialog box. This is set on the Properties tab, which may or may not be useful for you, depending on whether you are working across multiple sites. It would be useful for an incident response or even forensic work. The Notes and Attachment tabs would be useful for capturing details. Using CaseFile, you could even create systems on the graph and capture notes, and then link them in ways that make sense—perhaps generating a logical topology based on systems you have discovered.
Figure 11-9. Properties tab of a CaseFile node
One feature you don’t get if you are running CaseFile is the transforms, which can make Maltego itself useful. This doesn’t mean, though, that CaseFile can’t be used as an organization and visualization tool. With CaseFile, you don’t get the explicit issues as you do with Dradis, but you do get a way to visualize the systems and networks you are interfacing with as well as a way to attach notes and other artifacts to the nodes on your graph. This may be a good way of organizing your data as you are pulling everything together to write your report.
Summary
Kali Linux comes with many tools that are useful for taking notes, organizing information, and preparing your report. Some key pieces of information to take away from this chapter include the following:
-
Reporting is perhaps the most important aspect of security testing, since you are presenting your findings so they can be addressed.
-
Risk is the intersection of probability and loss.
-
Risk and chance are not the same thing just as risk and threat are not the same thing.
-
Catastrophizing and sensationalizing when you are putting your findings together isn’t helpful and will marginalize your findings.
-
A good report may consist of the following sections: executive summary, methodology, and findings.
-
Severity can be a mixture of probability and impact (or potential for loss).
-
Both vi and emacs are good, and very old, text editors that are useful for taking text notes.
-
Kali also has other text editors if you prefer graphical interfaces.
-
Both Dradis Framework and CaseFile (based on Maltego) can be useful to organize information, though they work in completely different ways.
Once you have concluded your report, you are done with your test. Continuing to do test after test and write report after report will really help you get a better understanding for shortcuts that work for you as well as areas you think should be highlighted in your reports. You’ll also get a good understanding of how to help different teams implement your recommendations, especially if you have been testing them yourself, as best you can.
Useful Resources
-
Ron Schmittling and Anthony Munns, “Performing a Security Risk Assessment”, ISACA
-
Phil Sung, “A Guided Tour of Emacs”, Free Software Foundation, Inc.
-
Joe “Zonker” Brockmeier, “Vim 101: A Beginnners Guide to Vim”, The Linux Foundation
-
Infosec Institute, “Kali Reporting Tools”