
Chapter 2. Network Security Testing Basics
Security testing is a broad term that means a lot of different things. Some of this testing will be network-based, and the goal may not necessarily be about system compromise. Instead, the testing may be more focused on impacting the service in negative ways, like causing the service to stop or be otherwise unavailable. When a service is taken offline, it’s considered a security issue. Because of that, stress testing can be an important element of security testing.
To perform network-based testing in which you are testing more of the networking elements than the applications, you need to understand how network protocol stacks are defined. One way of defining protocols and, more specifically, their interactions, is using the Open Systems Interconnection (OSI) model. Using the OSI model, we can break the communications into different functional elements and see clearly where different pieces of information are added to the network packets as they are being created. Additionally, you can see the interaction from system to system across the functional elements.
Stress testing not only creates a lot of information for the systems and applications to handle, but also generates data the application may not expect. You can perform stress testing, and should, by deliberately breaking the rules that the application or operating system expects communications should follow. Many attacks use this rule-breaking. They can cause application failures, either by getting them to shut down or by causing application exceptions that may be exploited for application or system compromise.
Security Testing
When many people hear the term security testing, they may think of penetration testing where the goal is to get into systems and acquire the highest privileges possible. Security testing isn’t entirely about popping boxes. In fact, you might suggest that the majority of security testing isn’t penetration testing. There are just so many areas of protecting systems and software that aren’t related to what would commonly be thought of as penetration testing. Before we start talking about what we can do with Kali Linux when it comes to network security testing, we should go over what security is so you can better understand what testing means in this context.
When professionals, and certainly certification organizations, talk about security, they make reference to what is commonly known as the triad. Some will add elements, but at the core of information security are three fundamentals: confidentiality, integrity, and availability. Anything that may impact one of these aspects of systems or software impacts the security of that software or system. Security testing will or should take all of those aspects into consideration and not the limited view that a penetration test may provide insight into.
As you may know, the triad is generally represented as an equilateral triangle. The triangle is equilateral because all three elements are considered to have equal weight. Additionally, if any of the elements are lost, you no longer have a triangle. You can see a common representation in Figure 2-1, where all three sides are the same length. Every one of these elements is considered crucial for information to be considered reliable and trustworthy. These days, because businesses and people rely so heavily on information that is stored digitally, it’s essential that information be available, be confidential when necessary, and have integrity.
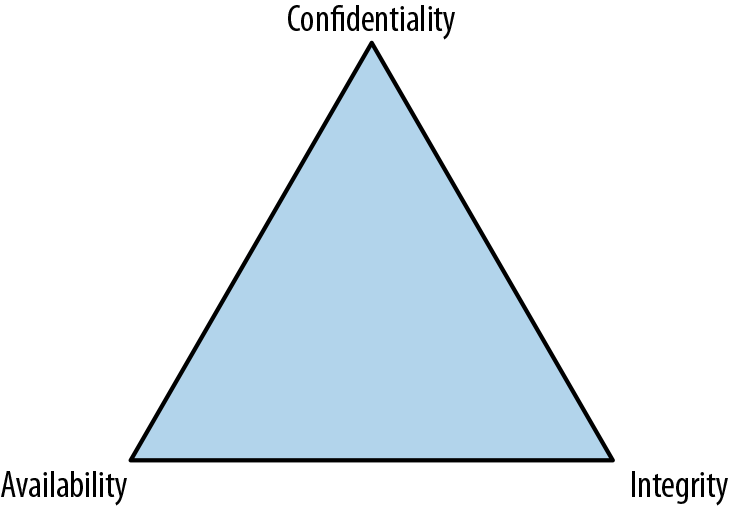
Figure 2-1. The CIA triad
Most businesses run on secrets. People also have secrets: their social security number, passwords they use, tax information, medical information, and a variety of other pieces of data. Businesses need to protect their intellectual property, for one thing. They may have many trade secrets that could have negative impacts on the business if the information were to get out of the organization. Keeping this information secret, regardless of what it is, is confidentiality. Anytime that information can be removed from the place where it is kept safe, confidentiality has been breached. This is the primary element that has been impacted in countless thefts of data, from Target, to the Office of Personnel Management, to Equifax and Sony. When consumer information is stolen, the confidentiality of that information has been compromised.
Generally, we expect that when we store something, it will be the same when we go to retrieve it. Corrupted or altered data may be caused by various factors, which may not necessarily be malicious in nature. Just because we talk about security doesn’t always mean we are talking about malicious behavior. Certainly, the cases I mentioned previously were malicious. However, bad or failing memory can cause data corruption on a disk. I say this from personal experience. Similarly, failing hard drives or other storage media can cause data corruption. Of course, in some cases malicious and deliberate actions will lead to corrupted or incorrect data. When that information has been corrupted, no matter the cause, it’s a failure or breach of integrity. Integrity is entirely about something being in a state you reasonably expect it to be in.
Finally, let’s consider availability. If I kick the plug to your computer out of the wall, likely falling to the floor and maybe hitting my head in the process, your computer will become unavailable (as long as we are talking about a desktop system and not a system with a battery). Similarly, if you have a network cable and the clip has come off such that the connector won’t stay in the wall jack or in the network interface card, your system will be unavailable on the network. This may impact you, of course, and your ability to do your job, but it may also impact others if they need anything that’s on your computer. Anytime there is a server failure, that’s an impact to availability. If an attacker can cause a service or entire operating system to fail, even temporarily, that’s an impact to availability, which can have serious ramifications to the business. It may mean consumers can’t get to advertised services. It may mean a lot of expenditure in manpower and other resources to keep the services running and available, as in the case of the banks that were hit with enormous, sustained, and lengthy denial-of-service attacks. While the attempt at an availability failure wasn’t successful, there was an impact to the business in fighting it.
Testing anything related to these elements is security testing, no matter what form that testing may take. When it comes to network security testing, we may be testing service fragility, encryption strength, and other factors. What we will be looking at when we talk about network testing is a set of stress-testing tools to start with. We will also look at other tools that are sometimes known to cause network failures. While a lot of bugs in the network stacks of operating systems were likely fixed years ago, you may sometimes run into lighter weight, fragile devices that may be attached to the network. These devices may be more susceptible to these sorts of attacks. These devices may include printers, Voice over IP phones, thermostats, refrigerators, and nearly countless other devices that are being connected, more and more, to networks these days.
Network Security Testing
We live by the network; we die by the network. How much of your personal information is currently either stored outright or at least available by way of the internet, often referred to as the cloud? When we live our lives expecting everything to be available and accessible by the network, it’s essential that we assure that our devices are capable of sustaining attack.
Monitoring
Before we do any testing at all, we need to talk about the importance of monitoring. If you are doing any of the testing we are talking about for your company or a customer, ideally you aren’t taking anything down deliberately unless you have been asked to. However, no matter how careful you are, there is always the possibility that something bad may happen and services or systems may get knocked over. This is why it’s essential to communicate with the people who own the systems so they can keep an eye on their systems and services. Businesses are not going to want to impact their customers, so they will often want staff to be available to restart services or systems if that’s necessary.
Note
Some companies may want to test their operations staff, meaning they expect you to do what you can to infiltrate and knock over systems and services, without doing any long-term or permanent damage. In this case, you wouldn’t communicate with anyone but the management who hired you. In most cases, though, companies are going to want to make sure they keep their production environment operational.
If the operations staff is involved, they will want to have some sort of monitoring in place. This could be watching logs, which is generally advisable. However, logs are not always reliable. After all, if you are able to crash a service, the service may not have long enough to write anything useful to the logs before failing. This does not mean, though, that you should discount logs. Keep in mind that the purpose of security testing is to help improve the security posture of the company you are working for. The logs may be essential to get hints as to what is happening with the process before it fails. Services may not fail in the sense that the process stops, but sometimes the service may not behave as expected. This is where logs can be important, to get a sense of what the application was trying to do.
There may be a watchdog in place. Watchdogs are sometimes used to ensure that a process stays up. Should the process fail, the PID would no longer appear in the process table, and the watchdog would know to restart that process. This same sort of watchdog capability can be used to determine whether the process has failed. Even if you don’t want the process restarted, just keeping an eye on the process table to see whether the process has failed will be an indicator if something has happened to the process.
Runaway processes can start chewing up processor resources. As a result, looking at processor utilization and memory utilization is essential. This can be done using open source monitoring utilities. You can also use commercial software or, in the case of Windows or macOS, built-in operating system utilities for the monitoring. One popular monitoring program is Nagios. On one of my virtual systems, I have Nagios installed. In Figure 2-2, you can see the output of the monitoring of that host. Without any additional configuration, Nagios monitors the number of processes, processor utilization, and service state of both the SSH and HTTP servers.
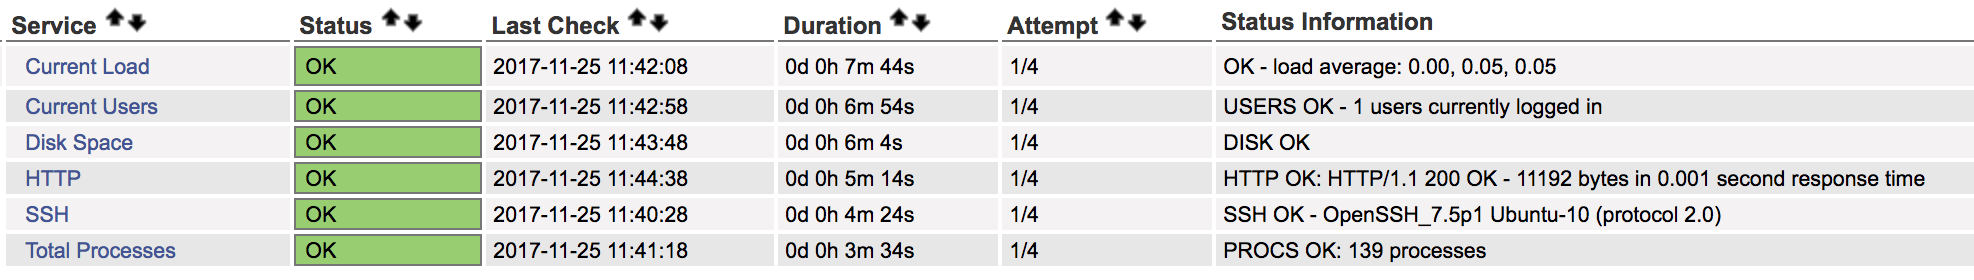
Figure 2-2. Monitoring resources
If you aren’t getting the cooperation, for whatever reason, of the operations staff, and you don’t have direct access to the systems under test, you may need to be able to track at least the service state remotely. When you are using some of the network test tools that we’ll be talking about here, they may stop getting responses from the service being tested. This may or may not be a result of the service failing. It could be a problem with the monitoring or it could be some security mechanism in place to shut down network abuses. Manually verifying the service to ensure it is down is important.
Essential to Reporting
When you are testing and you notice that a service has failed, make sure you have noted, to the best of your ability, where the failure occurred. Telling a customer or your employer that a service failed isn’t very helpful because they won’t know how to fix it. Keeping detailed notes will help you when you get to reporting so you can tell them exactly what you were doing when the service failed if they need to be able to recreate it in order to resolve the problem.
Manual testing can be done using a tool like netcat or even the telnet client. When you connect to a service port by using one of these tools, you will get an indication as to whether the service is responsive. Doing this manual verification, especially if it’s done from a separate system to rule out being blocked or blacklisted, can help to rule out false positives. Ultimately, a lot of security testing can come down to ruling out false positives that result from the different tools that we use. Monitoring and validation are essential to make sure that what you are presenting to your employer or customer is valid as well as actionable. Remember, you are trying to help them improve their security posture, not just point out where things are broken.
Layers
As Donkey in the movie Shrek suggests, layers are important. Actually, Shrek says that ogres have layers, and Donkey says cakes have layers, but Shrek likens ogres to onions, and cake is better than onions. Plus, I still hear Eddie Murphy as Donkey saying cakes have layers. None of which is really the point, of course. Except for cake. Cake may be the point—because when we talk about networks and communications between systems, we usually talk about layers. If you think about a seven-layer cake, with thin layers of cake, you may be able to envision the way we think about networks. Plus, in order to envision the best process, you’d need to envision two slices of cake. Two slices of cake have to be better than one slice of cake, right?
Figure 2-3 shows a simple representation of the seven layers of the OSI model and how each layer communicates with the same layer on remote systems. You can imagine that the lines between each of the layers is really icing and maybe jam, just to make it more interesting. Plus, the jam will help the layers adhere to one another since it’s sticky. Each layer on every system you are communicating with is exactly the same, so when you are sending a message from one slice of cake to the other slice of cake, it’s the same layer that receives it.
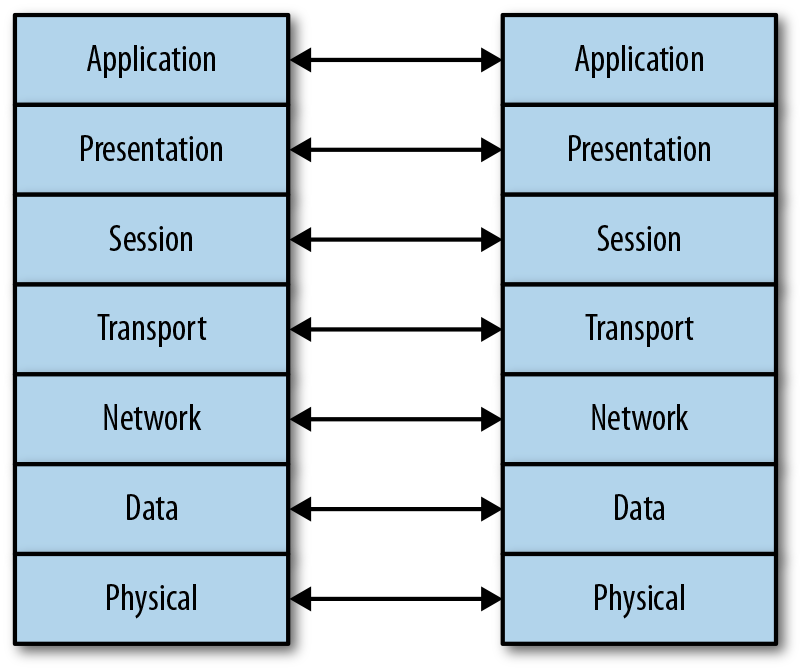
Figure 2-3. OSI model showing system-to-system communication
Let’s think about it this way. Our first layer at the very bottom is the physical layer, so we can think of that as pistachio. Our pistachio (physical) layer is where we connect to the network or, in this case, the plate that the cake sits on. As with cake, nothing is between the physical layer of the system and the network. You take your network interface and plug a cable into it, connecting it on the other end into a jack. That’s all the physical layer. In our cake, the pistachio sits directly on the plate, with nothing between.
Our next layer, which has to pass through icing and jam so the operating system can distinguish between one layer and another, is dulce de leche (think caramel made from milk). This is our data layer. The addressing of this layer is done using the media access control (MAC) address. This address includes 3 bytes that belong to the vendor (sometimes referred to as the organizationally unique identifier, or OUI). The other 3 bytes, since the entire MAC address is 6 bytes long, are the unique identifier for your network interface. The two components together are the MAC address. Any communication on your local network has to happen at this layer. If I want to talk to you from my dulce de leche to your dulce de leche (because who else would understand dulce de leche but another dulce de leche), I would need to use the MAC address because it’s the only address that your network interface and my network interface understand. The address is physically wired into the interface itself, which is why it’s sometimes called the physical address. In Example 2-1, you can see a MAC address in the second column from the output of the program ifconfig.
Example 2-1. MAC address
ether 52:54:00:11:73:65 txqueuelen1000(Ethernet)
The next layer we come across, again crossing through our icing and jam to clearly distinguish one from the other, is Nilla wafer (vanilla), and our network layer. At the Nilla wafer layer (network), we address using IP addresses. This is also the address that enables us to pass outside our local network. The MAC address never passes outside the local network. The IP address does, though. Since we can communicate with different bakeries, all having cakes designed exactly like ours, using IP addresses, this is the layer that enables routing. It’s the routing address that allows us to get directions from one bakery to another by using the IP address. Example 2-2 shows an IP address, which is comprised of 4 bytes, sometimes known as octets because they are each 8 bits long. This is a version 4 IP address. Version 6 IP addresses are 16 bytes (128 bits) long. As with the earlier example, this is from the output of ifconfig.
Example 2-2. IP address
inet 192.168.86.35 netmask 255.255.255.0 broadcast 192.168.86.255
The fourth layer in our cake is the teaberry layer (transport). Yes, it’s going to be a strangely flavored cake, but stay with me. Plus, if you don’t know what teaberry is, you should find it. Teaberry gum is very good. So, the teaberry layer gives us ports. This is another form of addressing. Think about it this way. Once you get to the bakery, you need to know which shelf you are looking for. This is the same sort of thing with ports. Once you have found your bakery with the IP address, you then need to find the shelf in the bakery, which is your port. The port will connect you to a service (program) that is running and has attached itself to that shelf (port). There are well-known ports that particular services run on. These are registered, and while the services (e.g., web server) can bind to a different port and listen on that, the well-known port is common because it’s what everyone knows to look for.
At layer five, it becomes challenging, simply because this layer is not always well understood. The fifth layer is strawberry, because we need some fruit in our cake, even if it’s just fruit flavoring. This is the session layer. The session layer is all about coordinating long-standing communications to make sure everything is synchronized. You can think about it as the session layer making sure that when you and I are eating our slices of cake at the same time (communicating), we are going at the same pace, so we start and finish at the same time. If we need to stop and take a drink of water, the session layer will make sure we do that at the same time. If we want to drink milk rather than water, the session layer will make sure that we are completely in sync so that we can start and finish at the same time and essentially look the same while we are eating. Because it’s all about how it looks.
Which brings us to the peanut butter layer, because what’s a cake without peanut butter? Especially if we have jam in our cake. This is the presentation layer. The presentation layer takes care of making everything look okay and correct. The presentation layer will make sure that there aren’t crumbs all over the place, for instance, making sure that what you are putting in your mouth actually looks like cake.
Finally, we have the amaretto layer. This is the application layer. Ultimately, this is the layer that sits closest to the eater (user). This takes what comes out of the presentation layer and gets it to the user in a way that it can be consumed as the user expects it to be consumed. One element of the cake analogy here that’s important is that when you use your fork to get a mouthful, you cut through the layers from amaretto down to pistachio. That’s how you load it onto the fork. When it’s consumed, however, it goes into your mouth pistachio end first. This is the same way we send and receive data messages. They are constructed from the application layer down and sent along. When they are received, they are consumed from the physical layer up, pulling off the headers at each layer to expose the next layer.
As we are working on network testing, we may be working at different layers of our cake. This is why it’s important to understand what each layer is. You need to understand the expectations of each layer so you can determine whether the behavior you are seeing is correct. We will be dealing with testing across multiple layers as we go forward, but generally each tool we will look at will target a specific layer. Network communication is about consuming the entire cake, but sometimes we need to focus our efforts (taste buds) on a specific layer to make sure that it tastes correctly all by itself, outside the context of the rest of the cake, even if we have to consume the entire cake to get that layer.
Stress Testing
Some software, and even hardware, has a hard time handling enormous loads. There are many reasons for this. In the case of hardware, such as devices that are purpose built or devices that fall into the category of Internet of Things (IoT), there may be several reasons that it can’t survive a lot of traffic. The processor that’s built into the network interface could be underpowered because the design of the overall device never expected to see a lot of traffic. The application could be written poorly, and even if it is built into the hardware, a poorly designed application can still cause problems. As a result, it’s important for security testers to ensure that the infrastructure systems they are responsible for will not simply fall over when something bad happens.
It may be easy to think of stress testing as flooding attacks. However, there are other ways to stress applications. One way is to send the application unexpected data that it may not know how to handle. There are techniques to specifically handle this sort of attack, so we’re going to focus primarily on overwhelming systems here and deal with fuzzing attacks, where we specifically generate bogus data, later. Having said that, though, in some cases network stacks in embedded devices may not be able to handle traffic that doesn’t look like it’s supposed to. One way of generating this sort of traffic is to use a program called fragroute.
The program fragroute, written many years ago by Dug Song, takes a series of rules and applies them to any packet that it sees destined to an IP address you specify. Using a tool like fragroute, you can really mangle and manipulate packets originating from your system. These packets should be put back together again, since one of the main functions of fragroute is to fragment packets into sizes you identify. However, not all systems can handle really badly mangled packets. This may especially be true when the packet fragments are coming in with overlapping segments. With IP packets, the IP identification field binds all fragments together. All fragments with the same IP identification field belong to the same packet. The fragment offset field indicates where the fragment belongs in the overall scheme of the packet. Ideally, you would have something like bytes 0–1200 in one packet fragment and the offset in the second fragment would start at 1201, indicating that it’s the next one to be put back together. You may get several more of roughly the same size and the network stack on the receiving end puts them all together like squares in a quilt until the quilt is whole.
If, though, we have one fragment that says it starts at 1150, and we assume a transmission unit of 1200, but the next one says it starts at 1201, there is a fragment overlap. The network stack needs to be able to handle that event correctly and not try to put overlapping packets together. In some cases, dealing with this sort of overlapping behavior has caused systems to crash because they just can’t deal with the conflicting information they are receiving. Example 2-3 shows a configuration file that can be used with fragroute to generate potentially problematic traffic.
Example 2-3. fragroute configuration
ip_chaff dup 7
ip_frag 64 new
drop random 33
dup random 40
order random
print
The first line indicates that IP packets should be interleaved with duplicates. The 7 in that line indicates to set the time to live field at 7 hops. This can cause packets to be dropped in transmission. The second line says to fragment IP packets at a packet size of 64 bytes. The new tells fragroute to overlap packets by favoring new data rather than old data. 33% of the time, we are going to drop packets. 40% of the time we are going to duplicate random packets. fragroute is also going to randomize the order that packets hit the wire, which means nothing will be in the correct sequence, ideally, when it hits the endpoint. Finally, the details are printed, indicating what was done to the packet that was received. In order to use this, we would use fragroute -f frag.rules 192.168.5.40. In this example, the name of the rules file is frag.rules and 192.168.5.40 is the target to which we want to send garbled traffic. These parameters can be changed to suit your own particular setup.
Using a tool like fragroute with a set of rules like this will likely mean nothing useful will end up at the target. However, that’s not really the point. The point is to check your target and see how it’s handling what it is receiving. Are the packets just being discarded? Is the operating system behaving correctly? This part is essential. Just knocking things over isn’t helpful. You need to be able to document the behavior so you can provide some indications of what may need to be done. Documenting your efforts in as detailed a way as possible is important in order to be successful and asked back or retained.
Ethics Warning
You need to ensure that the systems you are working on—especially when there could be damage or disruption, and just about everything we will be talking about has that potential—are either yours or systems you have permission to be testing. It’s unethical at a minimum and likely even illegal to be testing any system you don’t own or have permission to be testing. Testing, no matter how simple it may seem to be, always has the potential to cause damage. Get your permission in writing, always!
Once you have the configuration set, you can run fragroute on the system where you are originating traffic. If you can use it on a device that is capable of routing, you can manipulate traffic passing from one network to another, but this is generally going to be something to test from a single system. Testing out the fragmentation on my local network, I used the command line in Example 2-4 and received the results that you can see. The testing of the system was done by just issuing ping requests to the target. I could have just easily done testing against another system using traffic like web requests.
Example 2-4. fragroute output using rules file
root@kali:~# fragroute -f frag.rules 192.168.86.1 fragroute: ip_chaff -> ip_frag -> drop -> dup -> order -> print 192.168.86.227 > 192.168.86.1: icmp:type8code 0 192.168.86.227 > 192.168.86.1: icmp:type77code 74 192.168.86.227 > 192.168.86.1: icmp:type8code 0 192.168.86.227 > 192.168.86.1: icmp:type90code 83 192.168.86.227 > 192.168.86.1: icmp:type8code 0 192.168.86.227 > 192.168.86.1: icmp:type90code 83 192.168.86.227 > 192.168.86.1: icmp:type102code 77 192.168.86.227 > 192.168.86.1: icmp:type102code 77 192.168.86.227 > 192.168.86.1: icmp:type8code 0 Floating point exception
The interesting thing we see in this test is the floating-point error. This happened in fragroute from just manipulating the traffic. This particular testing appears to have turned up a bug in fragroute. The unfortunate thing is that once the floating-point error happened, network communication stopped. I was no longer able to get any network traffic off my Kali box, because of the way fragroute works. All traffic is set up to run through fragroute, but when the program fails, the hook doesn’t get unset. As a result, the operating system is trying to send network communication to something that just isn’t there. This is another example of the reason we test. Software can be complex, and especially when underlying libraries have changed, behaviors can also change.
Ultimately, any failure resulting from a stress test is a problem with availability. If the system crashes, no one can get to anything. If the application fails, the service isn’t available to users. What you are performing is a denial-of-service attack. As a result, it’s important to be careful when performing these sorts of attacks. There are definitely ethical implications, as noted earlier, but there are also very real possibilities to cause damage, including significant outage to customer-facing services. More on that in a moment. A simple way to do stress testing is to use a tool like hping3. This fabulous tool can be used to craft packets on the command line. Essentially, you tell hping3 what you want different fields to be set to, and it will create the packet the way you want.
This is not to say that you need to always specify all of the fields. You can specify what you want, and hping3 will fill the rest of the fields in the IP and transport headers as normal. hping3 is capable of flooding by not bothering to wait for any responses or even bothering to use any waiting periods. The tool will send out as much traffic as it can, as fast as it can. You can see the output from the tool in Example 2-5.
Example 2-5. Using hping3 for flooding
root@rosebud:~# hping3 --flood -S -p80192.168.86.1 HPING 192.168.86.1(eth0 192.168.86.1): Sset,40headers +0data bytes hping in flood mode, no replies will be shown ^C --- 192.168.86.1 hping statistic ---75425packets transmitted,0packets received, 100% packet loss round-trip min/avg/max=0.0/0.0/0.0 ms
When I ran this, I was connected to my Kali system remotely. As soon as I started it up, I tried to kill it because I had the output I was looking for. However, the system was cramming packets down the wire (and getting responses) as fast as it could. This made it hard to get the Ctrl-C I was trying to send to my Kali system, meaning hping3 wasn’t dying—it was just merrily sending a lot of packets out into the network (fortunately, I used my local network to test on, rather than trying to test someone else’s system). The operating system and network were otherwise engaged, so there was no response for a long period of time. In Example 2-5, I am using hping3 to send SYN messages to port 80. This is a SYN flood. In this example, I’m not only testing the ability of the system to handle the flood at the network stack (operating system) with just the capability of the hardware and operating system to respond to the traffic, but also testing the transport layer.
The operating system has to hold out a small chunk of memory with Transport Control Protocol (TCP) connections. Years ago, the number of slots available for these initial messages, called half-open connections, wasn’t very large. The expectation was that the connecting system was well-behaved and it would complete the connection, at which point it was up to the application to manage. Once the number of slots available to take half-open connections is exhausted, no new connections, including connections from legitimate clients, will be accepted. These days, most systems are far more capable of handling SYN floods. The operating system will just handle these inbound, half-open connections and dispose of them using a variety of techniques, including reducing the timeout period during which the connection is allowed to be half-open.
This test uses SYN messages (-S) to port 80 (-p 80). The idea is that we should get a SYN/ACK message back as the second stage of the three-way handshake. I don’t have to specify a protocol because that’s accomplished by just saying that I want to send a SYN message. TCP is the only protocol that has the SYN message. Finally, I tell hping3 that I want it to use flood mode (--flood). Other command-line flags will do the same thing by specifying the interleave rate (the amount of time to wait before sending the next message). This way is easier to remember and also pretty explicit.
Note
The program hping has been through a few versions, as you can likely guess from the use of the 3 at the end. This tool is commonly available across multiple Linux distributions. You may call the program by hping on some systems, while on others, you may need to specify the version number—hping2 or hping3, for instance.
Testing at the lower layers of the network stack using tools like hping3 can lead to turning up issues on systems, especially on more fragile devices. Looking higher up in the network stack, though, Kali Linux has numerous tools that will tackle different services. When you think about the internet, what service springs to mind first? Spotify? Facebook? Twitter? Instagram? All of these are offered over HTTP, so you’re interacting, often, with a web server. Not surprisingly, we can take on testing web servers. This is different from the application running on the web server, which is a different thing altogether and something we’ll take on much later. In the meantime, we want to make sure that web servers themselves will stay up.
Although Kali comes with tests for other protocols including the Session Initiation Protocol (SIP) and the Real-time Transport Protocol (RTP), both used for Voice over IP (VoIP). SIP uses a set of HTTP-like protocol commands to interact between servers and endpoints. When an endpoint wants to initiate a call, it sends an INVITE request. In order to get the INVITE to the recipient, it will need to be sent through multiple servers or proxies. Since VoIP is a mission-critical application in enterprises that use it, it can be essential to determine whether the devices in the network are capable of withstanding a large number of requests.
SIP can use either TCP or User Datagram Protocol (UDP) as a transport, though earlier versions of the protocol favored UDP as the transport protocol. As a result, some tools, particularly if they are older, will lean toward using UDP. Modern implementations not only support TCP but also support Transport Layer Security (TLS) to ensure the headers can’t be read. Keep in mind that SIP is based on HTTP, which means all the headers and other information are text-based, unlike H.323, another VoIP protocol, which is binary and can’t generally be read visually without something to do a protocol decode. The tool inviteflood uses UDP as the transport protocol, without the ability to switch to TCP. This does, though, have the benefit of allowing the flood to happen faster because there is no time waiting for the connection to be established. In Example 2-6, you can see a run of inviteflood.
Example 2-6. SIP invite flood
root@rosebud:~# inviteflood eth0 kilroy dummy.com 192.168.86.238 150000

inviteflood - Version 2.0
              June 09, 2006

source IPv4 addr:port   = 192.168.86.35:9
dest   IPv4 addr:port   = 192.168.86.238:5060
targeted UA             = [email protected]

Flooding destination with 150000 packets
sent: 150000
We can break down what is happening on the command line. First, we specify the interface that inviteflood is supposed to use to send the messages out. Next, is the username. Since SIP is a VoIP protocol, it’s possible that this may be a number, like a phone number. In this case, I am targeting a SIP server that was configured with usernames. Following the username is the domain for the username. This may be an IP address, depending on how the target server is configured. If you don’t know the domain for the users, you could try using the IP address of the target system. In that case, you’d have the same value twice, since the target is the next value on the command line. At the end is the number of requests to send. That 150,000 requests took seconds to send off, meaning that the server was capable of supporting a large volume of requests per second.
Before moving on to other matters, we need to talk about IPv6. While it isn’t yet commonly used as a network protocol across the internet, meaning I couldn’t send IPv6 traffic from my system to, say, Google’s website, the time will come when that should be possible. I mention Google in particular because Google publishes an IPv6 address through its Domain Name System (DNS) servers. Beyond being able to send IPv6 through the internet, though, is the fact that some enterprises are using IPv6 today to carry traffic within their own enclaves. However, even though IPv6 is more than 20 years old, it has not had the same run-in time that IPv4 has had—and it took decades to chase some of the most egregious bugs out of various IPv4 implementations. This is all to say that in spite of the time that operating system vendors like Microsoft and the Linux team have put into development and testing, more real-world testing across a wide variety of devices is still needed to be comprehensive.
This is all to say that Kali includes IPv6 testing tool suites. There are two of them, and each suite has a good-sized collection of tools because in the end, IPv6 includes more than just changes to addressing. A complete implementation of IPv6 includes addressing, host configuration, security, multicasting, large datagrams, router processing, and a few other differences. Since these are different functional areas, multiple scripts are necessary to handle those areas.
The way IPv6 behaves on the local network has changed. Instead of the Address Resolution Protocol (ARP) being used to identify neighbors on the local network, IPv6 replaces and enhances that functionality through new Internet Control Message Protocol (ICMP) messages. Coming with IPv6 is the Neighbor Discovery Protocol, which is used to help a system connecting to the network by providing details about the local network. ICMPv6 has been enhanced with the Router Solicitation and Router Advertisement messages as well as the Neighbor Solicitation and Neighbor Advertisement messages. These four messages help a system to get situated on a network with all the relevant information needed, including the local gateway and domain name servers used on that network.
We will be able to test some of these features to determine how a system might perform under load but also by manipulating the messages in ways that may cause the target system to misbehave. The tools na6, ns6, ra6, and rs6 all focus on sending arbitrary messages to the network by using the different ICMPv6 messages indicated previously. Whereas most systems will provide reasonable information to the network, to the best of their knowledge and configuration, these tools allow us to inject potentially broken messages out to the network to see how systems behave with such messages. In addition to those programs, the suite provides tcp6, which can be used to send arbitrary TCP messages out to the network, allowing the possibility of TCP-based attacks.
No matter what sort of stress testing you are doing, it’s important to keep as many notes as possible so you can provide detailed information as to what was going on when a failure occurred. Monitoring and logging are important here.
Denial-of-Service Tools
Denial of service is not the same as stress testing. The objective may be different when it comes to the two sets of tools being used. Stress testing is commonly done by development tools to be able to provide performance metrics. It is used to determine the functionality of a program or system under stress—whether it’s the stress of volume or the stress of malformed messages. There is a fine line, though. In some cases, stress testing will cause a failure of the application or the operating system. This will result in a denial-of-service attack. However, stress testing may also just lead to CPU or memory spikes. These are also valuable findings, since this would be an opportunity to improve the programming. CPU or memory spikes are bugs, and bugs should be eradicated. What we are looking at in this section will be programs that are specifically developed for the purpose of knocking over services.
Slowloris attack
Much like the SYN flood that intends to fill up the partial connection queue, there are attacks that will do similar things to a web server. Applications don’t necessarily have unlimited resources at their disposal. Often there are caps on the connections the application server will take on. This depends on how the application is designed, and not all web servers are susceptible to these attacks. One thing to note here is that embedded devices often have limited resources when it comes to their memory and processor. Think about any device that has a web server for remote management—your wireless access point, your cable modem/router, a printer. These devices have web servers to make management easier, but the primary purpose of these devices isn’t to provide web services; it’s to act as a wireless access point, a cable modem/router, or a printer. The resources for these devices will be primarily applied to the device’s intended function.
These devices are one place to use this sort of testing, because they simply won’t expect a lot of connections. This means that an attack such as Slowloris may be able to take these servers offline, denying service to anyone else who may try to connect. The Slowloris attack is designed to hold a lot of connections open to a web server. The difference between this attack and a flooding attack is this is a slow play attack. It’s not a flood. Instead, the attack tool holds the connection open by sending small amounts of data over a long period of time. The server will maintain these connections as long as the attack tool continues to send even small amounts of data partial requests that never quite get completed.
Slowloris is not the only type of attack that goes after web servers, though. In recent years, there have been a few vulnerabilities that go after web servers. Another one is Apache Killer, which sends bytes in chunks that overlap. The web server, in trying to put the chunks together, eventually runs out of memory trying to make it work correctly. This was a vulnerability found in both the 1.x and 2.x versions of Apache.
One program that Kali has available is slowhttptest. Using slowhttptest, you can launch one of four HTTP attacks at your target. The first is a slow headers attack, otherwise known as Slowloris (as noted previously). The second is a slow body attack, otherwise known as R-U-Dead-Yet. The range attack, known as Apache Killer, is also available, as is a slow read attack. All of these are essentially the reverse of the flooding attacks discussed earlier in that they accomplish the denial of service with a limited number of network messages. In Example 2-7, the default slow headers attack (Slowloris) was run against Apache on my Kali box. No traffic has left my system, and you can see that after the 26th second, the test ended with no connections left available. Of course, this was a simply configured web server with very few threads configured. A web application with multiple web servers available to manage load would survive considerably longer, if they were available at all.
Example 2-7. slowhttp output
slowhttptest version 1.6 - https://code.google.com/p/slowhttptest/ -test type: SLOW HEADERS number of connections: 50 URL: http://192.168.86.35/ verb: GET Content-Length header value: 4096 follow up data max size: 68 interval between follow up data:10seconds connections per seconds: 50 probe connection timeout:5secondstestduration:240seconds using proxy: no proxy Thu Nov2319:53:52 2017: slow HTTPteststatus on 25th second: initializing: 0 pending: 0 connected: 30 error: 0 closed: 20 service available: YES Thu Nov2319:53:54 2017: Test ended on 26th second Exit status: No open connections left
The Apache server targeted here uses multiple child processes and multiple threads to handle requests. Caps are set in the Apache configuration: the default here is 2 servers, a thread limit of 64, 25 threads per child, and a maximum of 150 request workers. As soon as the number of connections available was maxed out by slowhttptest, the number of Apache processes was 54 on this system. That would be 53 child processes and a master or parent process. To handle the number of connections required for the requests being made, Apache spawned multiple children and would have had multiple threads per child. That’s a lot of processes that have been started up. Considering that the Apache server that was running was completely up-to-date at the time of this writing, it seems clear that these types of attacks can be successful, in spite of how many years they have been around. Of course, as noted earlier, that entirely depends on the architecture of the site under test.
SSL-based stress testing
Another resource-based attack that isn’t about bandwidth, but instead is about processor utilization, targets the processing requirements for encryption. For a long time, e-commerce sites have used Secure Sockets Layer (SSL) or Transport Layer Security (TLS) to maintain encryption between the client and the server in order to ensure the privacy of all communication. These days, many servers use SSL/TLS as a matter of course. If you attempt to search at Google, you will see that it is encrypted by default. Similarly, many other large sites, such as Microsoft and Apple, encrypt all traffic by default. If you try to visit the site by using an unencrypted uniform resource locator (URL) by specifying http:// instead of https://, you would find that the server converts the connection automatically to https for you.
The thing about SSL/TLS, though, is that encryption requires processing power. Modern processors are more than capable of keeping up with normal encryption loads, especially as modern encryption algorithms are generally efficient with processor utilization. However, any server that uses SSL/TLS incurs a lot of processing overhead. First, the messages that are sent from the server are generally larger, which means that it takes more processing to encrypt those larger messages than the comparably small messages originating from a client. Additionally, the client system is probably sending only a few messages at a time whereas the server is expected to be encrypting messages to a number of concurrent clients, which may all have multiple concurrent connections going to the server. The load primarily comes from the creation of the keys that are needed to encrypt the session.
Capabilities exist in Kali to target outdated services and capabilities. The problem is that some of these long superseded programs still remain in service in a lot of places. As a result, it’s still important to be able to test them. One of those services is the SSL encryption. The final denial-of-service testing program we’ll look at here targets servers that use SSL. SSL is generally no longer in use, having been supplanted by better technology, but that’s not to say that you won’t run across one. The program thc-ssl-dos targets servers based on the idea that encryption is computationally expensive, especially on the server side.
Example 2-8 shows a run of thc-ssl-dos against a server that has been configured to use SSL. However, the issues with SSL have been known for so long that the underlying libraries often have SSL disabled. In spite of running against an older installation, you can see that the program was unable to achieve a complete SSL handshake. However, if you were to find a server that did have SSL configured, you would be able to test whether it was vulnerable to a denial of service.
Example 2-8. SSL DoS using thc-ssl-dos utility
root@rosebud:~# thc-ssl-dos -l100192.168.86.239443--accept ______________ ___ _________\__ ___/|\____||/ ~//||Y /\____|____|\___|_ /\______ ///http://www.thc.org Twitter @hackerschoice Greetingz: the french underground Waitingforscript kiddies to piss off................ The force is with those whoreadthe source... Handshakes0[0.00 h/s],1Conn,0Err SSL: error:140770FC:SSL routines:SSL23_GET_SERVER_HELLO:unknown protocol#0: This does not look like SSL!
This failure highlights one of the challenges of doing security testing: finding vulnerabilities can be hard. Exploiting known vulnerabilities can also be hard. This is one reason that modern attacks commonly use social engineering to make use of humans and their tendency toward trust and behaviors that can lead to exploitation—often technical vulnerabilities are harder to exploit than manipulating people. This does not mean that these nonhuman issues are not possible given the number of vulnerabilities discovered and announced on a regular basis. See Bugtraq and the Common Vulnerabilities and Exposures project for evidence of this.
DHCP attacks
The Dynamic Host Configuration Protocol (DHCP) has a test program called DHCPig, which is another consumption attack, designed to exhaust resources available in a DHCP server. Since the DHCP server hands out IP addresses and other IP configuration, it would be a problem for enterprises if their workers weren’t able to obtain addresses. While it’s not uncommon for the DHCP server to hand out addresses with long leases (the period of time a client can use the address without having to renew it) a lot of DHCP servers have short lease times. A short lease time is important when everyone is mobile. As users come on and off the network regularly, sometimes staying for short periods of time, having clients hang onto leases can also consume those resources. What this means, though, is that when clients have short leases, a tool like DHCPig can grab expiring leases before the client can get them, leaving the clients out in the cold without an address and unable to do anything on the network. Running DHCPig is as simple as running the Python script pig.py and specifying the interface that is on the network you want to test against.
Encryption Testing
We’ve had the ability to encrypt traffic over internet connections for over 20 years now. Encryption, like so much else that’s information security related, is a moving target. When the first version of SSL was released by Netscape in 1995, one version had already been discarded because of identified problems with it. The second version didn’t last long before identified problems with it forced a third version, released the following year in 1996. Both SSLv2 and SSLv3 were both determined to be prohibited as a result of the problems with the way they handle encryption.
Network traffic that is encrypted follows a process that is not as simple as just taking a message, encrypting it, and sending it along, though that’s a part of the overall process. Encryption relies on keys. The most sensitive part of any encryption process is always the key. A message that is encrypted is valuable only if it can be decrypted, of course. If I were to send you an encrypted message, you would need the key to be able to decrypt it. This is where the challenge starts to come in.
There are two means of handling keys. The first is asymmetric encryption. This is where there are two keys, one for encryption and one for decryption. You may also hear this referred to as public key encryption. The idea is that everyone has two keys—a public key and a private key. The public key is something everyone can have. In fact, it works only if everyone has the ability to access everyone else’s public key. Encrypting a message using a public key means that the message can be decrypted only by using the private key. The two keys are mathematically related and based on calculations using large numbers. This all seems like a reasonable approach, right? The problem with asymmetric encryption is that it is computationally hard.
This leads us to symmetric encryption. With symmetric encryption, as you may have guessed, we have a single key. The same key encrypts and decrypts. Symmetric key encryption is computationally easier. However, symmetric key encryption has two problems. The first is that the longer a symmetric key is used, the more vulnerable to attack it is. This is because an attacker can gather a large volume of ciphertext (the result of feeding plain text into an encryption algorithm) and start performing analysis on it in the hopes of deriving the key. Once the key has been identified, any traffic encrypted with that key can be easily decrypted.
The second and more important problem is that after we have a key, how do we both get it? This works, after all, only if both of us have the key. So, how do we both have the key if we are not physically proximate? And if we are physically proximate, do we need to encrypt messages between us? We could have met at some point and shared the key, but that means that we are stuck using the key until we meet again and can create a new key so we both have it. The longer we use the same key without meeting again brings us to problem #1 noted previously.
As it turns out, two mathematicians solved this problem, though they were not the first. They were just the first who could publish their work. Whitfield Diffie and Martin Hellman came up with the idea of having both sides independently derive the key. Essentially, we both start with a value that is shared. This can be safely shared unencrypted because it’s what happens to it after that matters. We both take this initial value and apply a secret value using a mathematical formula that we both know. Again, it doesn’t matter whether this is public because it’s the secret value that matters. We share each other’s result from our individual computations and then reapply our secret values to the other’s result. In this way, we will have both gone through the same mathematical process from a single starting point, so we will both have the same key in the end.
The reason for going through all of this is that in practice, all of these mechanisms are used. The Diffie-Hellman key exchanged is used along with public-key cryptography to derive a session key, which is a symmetric key. This means that the session uses a less computationally intensive key and algorithm to do the heavy lifting of encrypting and decrypting the bulk of the communication between the server and the client.
As noted earlier, SSL is no longer used as the cryptographic protocol. Instead, TLS is the current protocol used. It has been through a few versions itself, again demonstrating the challenges of encryption. The current version is 1.2, while 1.3 is in draft stage at the moment. Each version introduces fixes and updates based on continuing research in breaking the protocol.
One way to determine whether a server you are testing is using outdated protocols is to use a tool like sslscan. This program probes the server to identify what encryption algorithms are in use. This is easy to determine, because as part of the handshake with the server, it will provide a list of ciphers that are supported for the client to select from. So, all sslscan needs to do is initiate an encrypted session with the server to get all the information needed. Example 2-9 shows the results of testing an Apache server with encryption configured.
Example 2-9. Running sslscan against local system
root@rosebud:~# sslscan 192.168.86.35 Version: 1.11.10-static OpenSSL 1.0.2-chacha(1.0.2g-dev)Testing SSL server 192.168.86.35 on port443using SNI name 192.168.86.35 TLS Fallback SCSV: Server supports TLS Fallback SCSV TLS renegotiation: Secure session renegotiation supported TLS Compression: Compression disabled Heartbleed: TLS 1.2 not vulnerable to heartbleed TLS 1.1 not vulnerable to heartbleed TLS 1.0 not vulnerable to heartbleed Supported Server Cipher(s): Preferred TLSv1.2256bits ECDHE-RSA-AES256-GCM-SHA384 Curve P-256 DHE 256 Accepted TLSv1.2128bits ECDHE-RSA-AES128-GCM-SHA256 Curve P-256 DHE 256 Accepted TLSv1.2256bits DHE-RSA-AES256-GCM-SHA384 DHE2048bits Accepted TLSv1.2128bits DHE-RSA-AES128-GCM-SHA256 DHE2048bits Accepted TLSv1.2256bits ECDHE-RSA-AES256-SHA384 Curve P-256 DHE 256 Accepted TLSv1.2256bits ECDHE-RSA-AES256-SHA Curve P-256 DHE 256 Accepted TLSv1.2256bits DHE-RSA-AES256-SHA256 DHE2048bits Accepted TLSv1.2256bits DHE-RSA-AES256-SHA DHE2048bits Preferred TLSv1.1256bits ECDHE-RSA-AES256-SHA Curve P-256 DHE 256 Accepted TLSv1.1256bits DHE-RSA-AES256-SHA DHE2048bits Preferred TLSv1.0256bits ECDHE-RSA-AES256-SHA Curve P-256 DHE 256 Accepted TLSv1.0256bits DHE-RSA-AES256-SHA DHE2048bits SSL Certificate: Signature Algorithm: sha256WithRSAEncryption RSA Key Strength: 2048 Subject: rosebud Issuer: rosebud Not valid before: Nov2414:58:322017GMT Not valid after: Nov2214:58:322027GMT
sslscan will determine whether the server is vulnerable to Heartbleed, a vulnerability that was identified and that targeted server/client encryption, leading to the exposure of keys to malicious users. Most important, though, sslscan will give us the list of ciphers supported. In the list, you will see multiple columns with information that may not mean a lot to you. The first column is easily readable. It indicates whether the protocol and cipher suite are accepted and whether they are preferred. You will note that each of the versions of TLS has its own preferred cipher suite. The second column is the protocol and version. SSL is not enabled on this server at all, as a result of support for SSL having been removed from the underlying libraries. The next column is the key strength.
Note
Key sizes can’t be compared except within the same algorithm. Rivest-Shamir-Adleman (RSA) is an asymmetric encryption algorithm and has key sizes that are multiples of 1,024. AES is a symmetric encryption algorithm and has key sizes of 128 and 256. That doesn’t mean that RSA is orders of magnitude stronger than AES, because they use the key in different ways. Even comparing algorithms that are the same type (asymmetric versus symmetric) is misleading because the algorithms will use the keys in entirely different ways.
The next column is the cipher suite. You will note that it’s called a cipher suite because it takes into account multiple algorithms that have different purposes. Let’s take this listing as an example: DHE-RSA-AES256-SHA256. The first part, DHE, indicates that we are using Ephemeral Diffie-Hellman for key exchange. The second part is RSA, which stands for Rivest-Shamir-Adleman, the three men who developed the algorithm. RSA is an asymmetric-key algorithm. This is used to authenticate the parties, since the keys are stored in certificates that also include identification information about the server. If the client also has a certificate, there can be mutual authentication. Otherwise, the client can authenticate the server based on the hostname the client intended to go to and the hostname that is listed in the certificate. Asymmetric encryption is also used to encrypt keys that are being sent between the client and the server.
Note
I am using the words client and server a lot through the course of this discussion, and it’s useful for you to understand what these words mean. In any conversation over a network, there is always a client and a server. This does not mean that the server is an actual server sitting in a data center. What it means is that there is a service that is being consumed. The client is always the side originating the conversation, and the server is always the one responding. That makes it easy to “see” the two parties—who originated and who responded to the origination.
The next part is the symmetric encryption algorithm. This suggests that the Advanced Encryption Standard (AES) is being offered with a key size of 256 bits. It’s worth noting here that AES is not an algorithm itself but a standard. The algorithm has its own name. For decades, the standard in use was the Data Encryption Standard, based on the Lucifer cipher developed at IBM by Horst Feistel and his colleagues. In the 1990s it was determined that DES was a bit long in the tooth and would soon be breakable. A search for a new algorithm was undertaken, resulting in the algorithm Rijndael being selected as the foundation for the Advanced Encryption Standard. Initially, AES used a key size of 128 bits. It’s only been relatively recently that the key strength is commonly increased to 256.
AES is the algorithm used for encrypting the session. This means a 256-bit key is used for the session key. It is the key that was derived and shared at the beginning of the session. If the session were to last long enough, the session key may be regenerated to protect against key derivation attacks. As noted before, the key is used by both sides of the conversation for encryption and decryption.
Finally, you’ll notice the algorithm SHA256. This is the Secure Hash Algorithm using a 256-bit length. SHA is a cryptographic algorithm that is used to verify that no data has changed. You may be familiar with the Message Digest 5 (MD5) algorithm that does the same thing. The difference is the length of the output. With MD5, the length of the output is always 32 characters, which is 128 bits (only 4 bits out of every byte are used). This has been generally replaced with SHA1 or higher. SHA1 generates 40 characters, or 160 bits (again, only 4 bits out of every byte are used). In our case, we are using SHA256, which generates 64 characters. No matter the length of the data, the output length is always the same. This value is sent from one side to the other as a way of determining whether the data has changed. If even a single bit is different, the value of the hash—the word used for the output of the SHA or MD5 algorithm—will be different.
All of these algorithms work together to make up the protocol of TLS (and previously SSL). To accomplish effective encryption that is protected against compromise, all of these algorithms are necessary. We need to be able to derive a session key. We need to be able to authenticate the parties and share information using encryption before we have generated our session key. We need to have a session key and an algorithm to encrypt and then decrypt our session data. Finally, we need to make sure that nothing has been tampered with. What you see in the example is a collection of strong encryption suites.
If you were to see something like 3DES in the output, you would have an example of a server that was susceptible to attacks against the session key. This could result in the key being compromised, which would result in the ciphertext being decrypted into plain text in the hands of someone for whom it was not meant. Additionally, though it was breezed over earlier, a tool like sslscan can verify that the protocols used are not vulnerable to attack using known exploits.
You may on rare occasions see NULL in the place where we have seen AES256. This means that the request is that no encryption is used. There are reasons for this. You may not care so much about protecting the contents of the transmissions, but you may care very much that you know who you are talking to and that the data hasn’t been modified in transit. So, you ask for no encryption so as not to incur any overhead from the encryption, but you get the benefit of the other parts of the cipher suite selected.
The war over encryption never ends. Even now research is being done to identify vulnerabilities that can be exploited in the encryption algorithms and protocols in use. You will see differences in the suites listed in your testing output over time as stronger keys begin to be used and new algorithms are developed.
Packet Captures
As you are performing network testing, you will find it useful to be able to see what is being transmitted over the network. To see what is sent, we need to use a program that captures packets. In fairness, though, what we are doing is capturing frames. The reason I say that is each layer of the network stack has a different term for the bundle of data that includes that layer. Keep in mind that headers are tacked on as we move down the network stack, so the last set of headers added is the layer 2 headers. The protocol data unit (PDU) at that layer is the frame. When we get up to layer 3, we are talking about a packet. Layer 4 has datagrams or segments, depending on the protocol used there.
Years ago, capturing packets was an expensive proposition, because it required a special network interface that could be put into promiscuous mode. The reason it’s called that is because by default, network interfaces look at the MAC address. The network interface knows its own address because it is attached to the hardware. If the address of an inbound frame matches the MAC address, the frame is forwarded up to the operating system. Similarly, if the MAC address is the broadcast address, the frame is forwarded up. In promiscuous mode, all comers are welcome. This means that all frames, whether they are addressed for this particular system or not, are forwarded up to the operating system. Being able to look at only frames addressed to that interface is nice and valuable, but it’s far more valuable to be able to see all frames that come across a network interface.
Modern network interfaces typically support not only things like full duplex and auto-negotiation but also promiscuous mode. This means we don’t need protocol analyzers anymore (as the hardware that could do this work was often called) because every system is capable of being a protocol analyzer. All we need is to know how to grab the frames and then peer into them to see what is going on.
Using tcpdump
While other operating systems have had other packet capture programs, like Solaris had snoop, the de facto packet capture program these days, especially on Linux systems, is tcpdump if all you have is access to a command line. We will take a look at a GUI a little later, but there is a lot of value in learning about tcpdump. You won’t always have access to a full desktop with a GUI. In many cases, you will have only a console or just an SSH session that you can use to run command-line programs. As a result, tcpdump will become a good friend. As an example, I used it earlier to verify that the protocol being used by our SIP testing program was really just using UDP and not using TCP. It has a lot of value in understanding what is going on with a program that isn’t otherwise telling you.
Before we start looking at options, let’s take a look at the output from tcpdump. Being able to read what is happening by looking at the output takes some getting used to. When we run tcpdump without any options, we get a short summary of the packets that are passing through. Example 2-10 is a sample of tcpdump output.
Example 2-10. tcpdump output
10:26:26.543550 IP binkley.lan.57137 > testwifi.here.domain: 32636+ PTR? c.0.0.0.0.0.0.0.0.0.0.0.0.0.0.0.0.0.0.0.0.0.0.0.0.0.0.0.2.0.f.f.ip6.arpa.(90)10:26:26.555133 IP testwifi.here.domain > binkley.lan.57137:32636NXDomain 0/1/0(154)10:26:26.557367 IP binkley.lan.57872 > testwifi.here.domain: 44057+ PTR? 201.86.168.192.in-addr.arpa.(45)10:26:26.560368 IP testwifi.here.domain > binkley.lan.57872: 44057* 1/0/0 PTR kilroyhue.lan.(99)10:26:26.561678 IP binkley.lan.57726 > testwifi.here.domain: 901+ PTR? 211.1.217.172.in-addr.arpa.(44)10:26:26.583550 IP testwifi.here.domain > binkley.lan.57726:9014/0/0 PTR den16s02-in-f19.1e100.net., PTR iad23s26-in-f211.1e100.net., PTR den16s02-in-f19.1e100.net., PTR iad23s26-in-f211.1e100.net.(142)10:26:26.585725 IP binkley.lan.64437 > testwifi.here.domain: 23125+ PTR? 0.0.0.0.in-addr.arpa.(38)10:26:26.598434 IP testwifi.here.domain > binkley.lan.64437:23125NXDomain 0/1/0(106)10:26:26.637639 IP binkley.lan.51994 > 239.255.255.250.ssdp: UDP, length 174
The first column in the output in Example 2-9 is the timestamp. This is not anything that has been determined from the packet itself, since time is not transmitted as part of any of the headers. What we get is the time as the hours, minutes, seconds, and fractions of seconds after midnight. In other words, it’s the time of day down to a fraction of a second. The second field is the transport protocol. We don’t get the layer 2 protocol because it’s determined by the network interface, so it goes without saying. In order to know the layer 2 protocol, you need to know something about your network interface. Commonly, the layer 2 protocol will be Ethernet.
The next set of data is the two endpoints of the conversation. This includes not only the IP addresses but also the port information. So, binkley.lan is the source of the first packet, and testwifi.here is the destination. Without telling it not to, tcpdump will convert IP addresses to hostnames. To disable that function, you would need to provide an -n on the command line. This would speed up your capture and lower the number of packets captured, since your system won’t be doing a DNS lookup for every frame that comes by.
You will notice that along with each IP address is another value. From our source address, binkley.lan.57137, the 57137 is a port number. This is the source port, and on the receiving side, you can see testwifi.here.domain. This means that testwifi.here is receiving a message on the port used by domain name servers. Again, just as in the hostname versus IP address, if you don’t want tcpdump to do a lookup on the port number, based on well-known port numbers, you can add -n to the command line, and tcpdump will just present you numeric information. In this case .domain translates to .53, which is the numeric value. We know that this is a UDP message because it tells us after the destination information.
Primarily, what you see in Example 2-10 are DNS requests and responses. This is a result of having tcpdump doing reverse DNS lookups to determine the hostname associated with the IP address. The remainder of each line from tcpdump output is a description of the packet. In the case of a TCP message, you may see the flags that are set in the TCP header or you may see sequence number information.
This time, we’ll take a look at more verbose output by using the -v flag. tcpdump supports multiple -v flags, depending on the level of verbosity you are looking for. We’ll also take a look at using the -n flag to see what it looks like without any address lookup. Example 2-11 shows the more verbose output.
Example 2-11. Verbose output for tcpdump
11:39:09.703339 STP 802.1d, Config, Flags[none], bridge-id 7b00.18:d6:c7:7d:f4:8a.8004, length35message-age 0.75s, max-age 20.00s, hello-time 1.00s, forwarding-delay 4.00s root-id 7000.2c:08:8c:1c:3b:db, root-pathcost 4 11:39:09.710628 IP(tos 0x0, ttl 233, id 12527, offset 0, flags[DF], proto TCP(6), length 553)54.231.176.224.443 > 192.168.86.223.62547: Flags[P.], cksum 0x6518(correct), seq 3199:3712, ack 1164, win 68, length 513 11:39:09.710637 IP(tos 0x0, ttl 233, id 12528, offset 0, flags[DF], proto TCP(6), length 323)54.231.176.224.443 > 192.168.86.223.62547: Flags[P.], cksum 0x7f26(correct), seq 3712:3995, ack 1164, win 68, length 283 11:39:09.710682 IP(tos 0x0, ttl 64, id 0, offset 0, flags[DF], proto TCP(6), length 40)192.168.86.223.62547 > 54.231.176.224.443: Flags[.], cksum 0x75f2(correct), ack 3712, win 8175, length 0 11:39:09.710703 IP(tos 0x0, ttl 64, id 0, offset 0, flags[DF], proto TCP(6), length 40)
The output looks largely the same except that this is all numbers with no hostnames or port names. This is a result of using the -n flag when running tcpdump. You will still see the two endpoints of each conversation identified by IP address and port number. What you get with -v is more details from the headers. You will see that checksums are verified as correct (or incorrect). You will also see other fields including the time-to-live value and the IP identification value.
Even if we switch to -vvv for the most verbosity, you aren’t going to get a complete packet decode for analysis. We can, though, use tcpdump to capture packets and write them out to a file. What we need to talk about is the snap length. This is the snapshot length, or the amount of each packet that is captured in bytes. By default, tcpdump grabs 262144 bytes. You may be able to set that value lower. Setting the value to 0 says that tcpdump should grab the maximum size. In effect, this tells tcpdump to set the snap length to the default value of 262144. To write the packet capture out, we need to use the -w flag and specify a file. Once we’ve done that, we have a packet capture (pcap) file that we can import into any tool that will read these files. We’ll take a look at one of those tools a little later.
Berkeley Packet Filters
Another important feature of tcpdump, which will serve us well shortly, is the Berkeley Packet Filter (BPF). This set of fields and parameters allows us to limit the packets that we are grabbing. On a busy network, grabbing packets can result in a lot of data on your disk in a short period of time. If you have an idea of what you are looking for ahead of time, you can create a filter to capture only what you are going to be looking at. This can also make it quite a bit easier to visually parse through what you have captured, saving you a lot of time.
A basic filter is to specify which protocol you want to capture. As an example, I could choose to capture only TCP or UDP packets. I might also say I want to capture only IP or other protocols. In Example 2-12, you can see a capture of ICMP-only packets. You will notice that in order to apply a filter, I just put it on the end of the command line. What results is the display of only ICMP packets. Everything still comes into the interface and is sent up to tcpdump, but it then determines what to display or write out to a file, if that’s what you are doing.
Example 2-12. tcpdump using BPF
root@rosebud:~# tcpdump icmp tcpdump: verbose output suppressed, use -v or -vvforfull protocol decode listening on eth0, link-type EN10MB(Ethernet), capture size262144bytes 12:01:14.602895 IP binkley.lan > rosebud.lan: ICMPechorequest, id 8203, seq 0, length 64 12:01:14.602952 IP rosebud.lan > binkley.lan: ICMPechoreply, id 8203, seq 0, length 64 12:01:15.604118 IP binkley.lan > rosebud.lan: ICMPechorequest, id 8203, seq 1, length 64 12:01:15.604171 IP rosebud.lan > binkley.lan: ICMPechoreply, id 8203, seq 1, length 64 12:01:16.604295 IP binkley.lan > rosebud.lan: ICMPechorequest, id 8203, seq 2, length 64
One thing I can do with these filters is use Boolean logic; I can use logic operators to be able to develop complex filters. Let’s say, for instance, that I want to capture web traffic. One way I could do that would be to say tcp and port 80: I am grabbing all TCP packets that have the port as 80. You’ll notice that I don’t mention source or destination with respect to the port number. I certainly can. I could use src port 80 or dst port 80. However, if I don’t specify source or destination, I get both ends of the conversation. When a message goes out with port 80 as its destination, when the receiving system replies, the port numbers get swapped. Port 80 on the response becomes the source port. If I were to capture only src port 80, I wouldn’t get any of the messages in the other direction. This may be exactly what you are looking for, of course, but it’s something to keep in mind. You may find that you need to indicate a range of ports to be grabbed. You could use the port-range primitive to capture a range of ports, like 80–88, for example.
The language used for BPF provides a lot of capability. If you need really complex filters, you can certainly look up the syntax for BPF and examples that may provide you something specific that you are looking for. What I have often found is that specifying the port is valuable. Also, I often know the host I want to capture traffic from. In that case, I would use host 192.168.86.35 to grab only traffic with that IP address. Again, I have not specified either source or destination for the address. I could by specifying src host or dst host. If I don’t indicate, I get both directions of the conversation.
Developing even a simple understanding of BPF will help you focus what you are looking at down to data that is relevant. When we start looking at packet captures, you will see how complex a job it can be to do packet analysis because there are just so many frames that contain a lot of detail to look over.
Wireshark
When you have your packet capture file, you will probably want to do some analysis. One of the best tools for that is Wireshark. Of course, Wireshark can also capture packets itself and generate pcap files if you want to store the capture for later analysis or for analysis by someone else. The major advantage to Wireshark, though, is providing a way to really dig deep into the contents of the packet. Rather than spending time walking through what Wireshark looks like or how we can use Wireshark for capturing packets, let’s jump into breaking apart a packet using Wireshark. Figure 2-4 shows the IP and TCP headers from an HTTP packet.
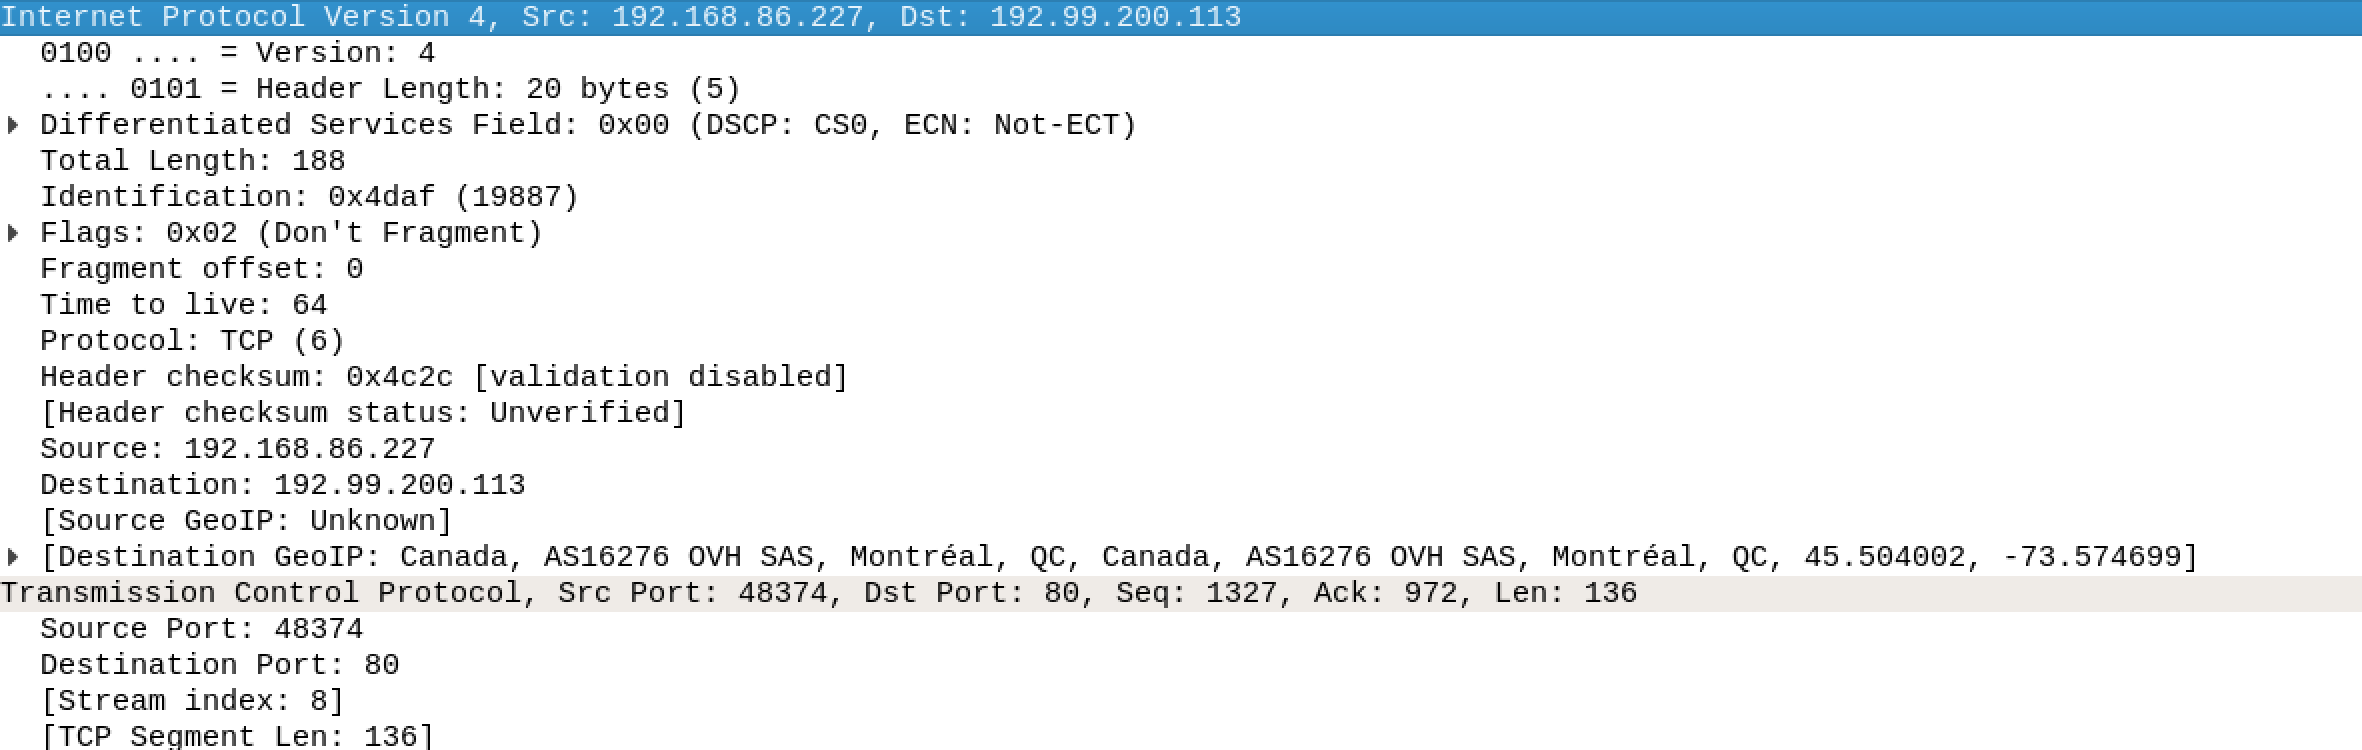
Figure 2-4. Header fields in Wireshark
You can see from just this image that Wireshark provides far more details than we were getting from tcpdump. This is one area where GUIs have a significant advantage. There is just more room here and a better way to present the amount of data in each of these headers. Each field in the header is presented on its own line so it’s clear what is happening. You’ll also see here that some of the fields can be broken out even more. The flags field, for example, can be broken open to see the details. This is because the flags field is really a series of bits, so if you want, you can open that field by clicking the arrow (or triangle) and you will be able to see the value of each of the bits. Of course, you can also see what is set just by looking at the line we have presented by Wireshark because it has done the work for us. For this frame, the Don’t Fragment bit is set.
Another advantage to using a tool like Wireshark is that we can more easily get to the contents of the packet. By finding a frame that we are interested in because it’s part of a conversation that we think has some value, we just need to select Follow TCP Stream. What we will get, in addition to only the frames that are part of that conversation, is a window showing the ASCII decode of the payloads from all of the frames. You can see this in Figure 2-5. Wireshark also color-codes the output. Red is the client messages, and blue is the server messages. You will also get a brief summary at the bottom of the window indicating how much of the conversation was the client’s and how much was the server’s.
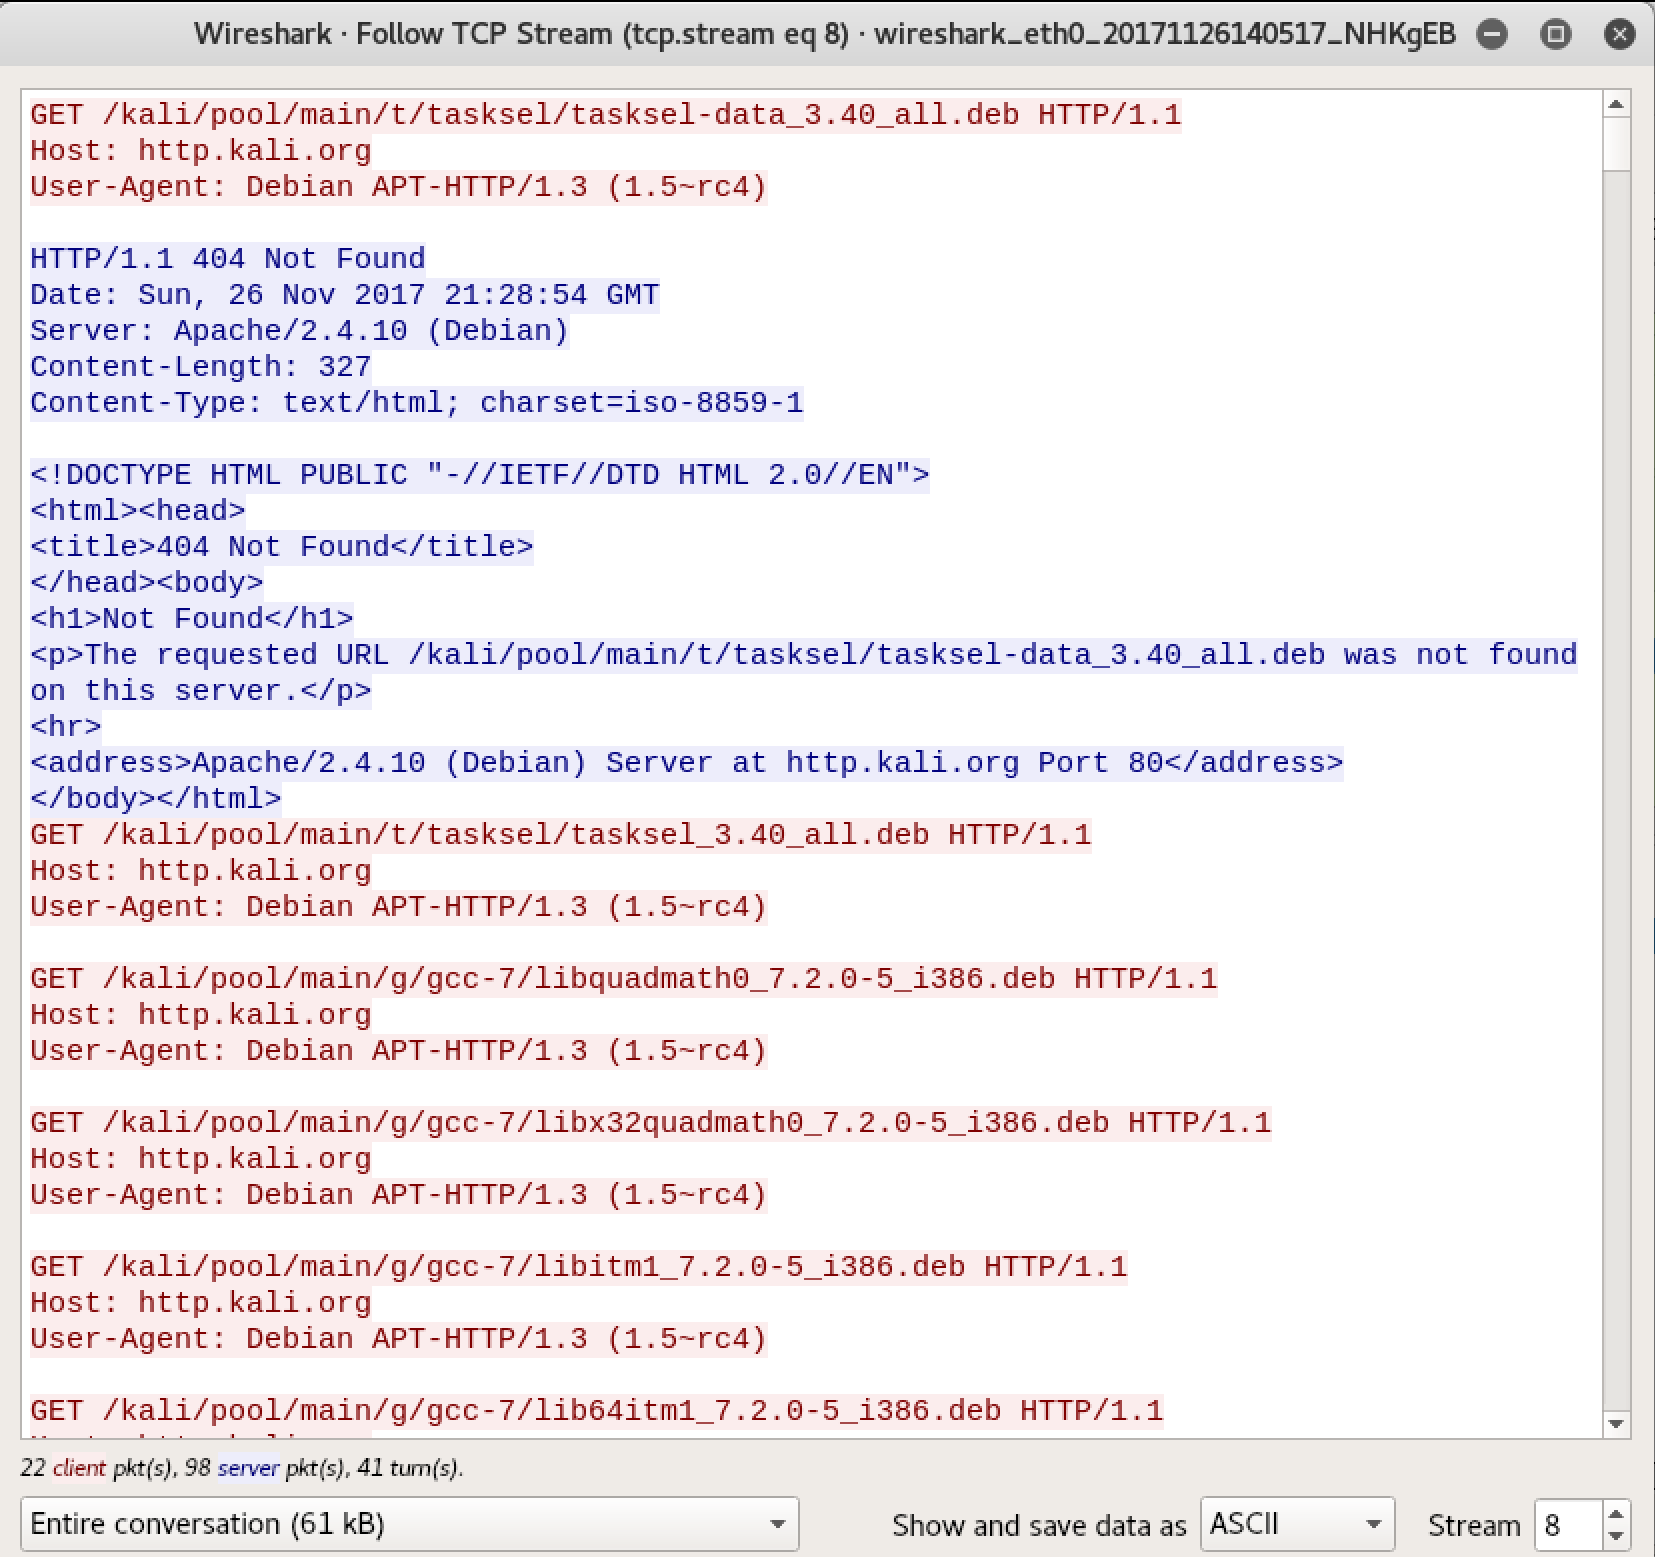
Figure 2-5. Follow TCP stream output
Wireshark has the same filtering capabilities that we had with tcpdump. In the case of Wireshark, we can apply the filter as a capture filter, meaning we will capture only packets that match the filter, or we can apply the filter as a display filter to be applied to packets already captured. Wireshark will provide a lot of help when it comes to filtering. When you start typing in the filter box at the top of the screen, Wireshark will start trying to autocomplete. It will also indicate whether you have a valid filter by color-coding the box red when you have an invalid filter, and green when it’s valid. Wireshark has the ability to get to about every field or property of the protocols it knows about. As an example, we could filter on the type of HTTP response code that was seen. This may be valuable if you generated an error and you want to look at the conversation that led to the error.
Wireshark will also do a lot of analysis for us. As an example, when we were fragmenting packets earlier using fragroute, Wireshark would have colored frames that weren’t right. If a packet’s checksum didn’t match, for instance, the frames belonging to that packet would have been colored black. Any error in the protocol where the packet is malformed would result in a frame that was colored red. Similarly, TCP resets will get a frame colored red. A warning would be colored yellow and may result from an application generating an unusual error code. You may also see yellow if there are connection problems. If you want to save a little time, you can use the Analyze menu and select Expert Info to see the entire list of frames that have been flagged. You can see a sample of this view in Figure 2-6.

Figure 2-6. Expert information output
Wireshark has so many capabilities; we aren’t even skimming the surface of what it can do. A lot of what you may find it useful for is just to see the headers for each protocol broken out in a way that you can easily read them. This will help you see what is happening if you run into issues with your testing. One other feature I should mention is the statistics menu. Wireshark will provide graphs and different views of the data you have captured. One such view is the protocol hierarchy, as you can see in Figure 2-7.
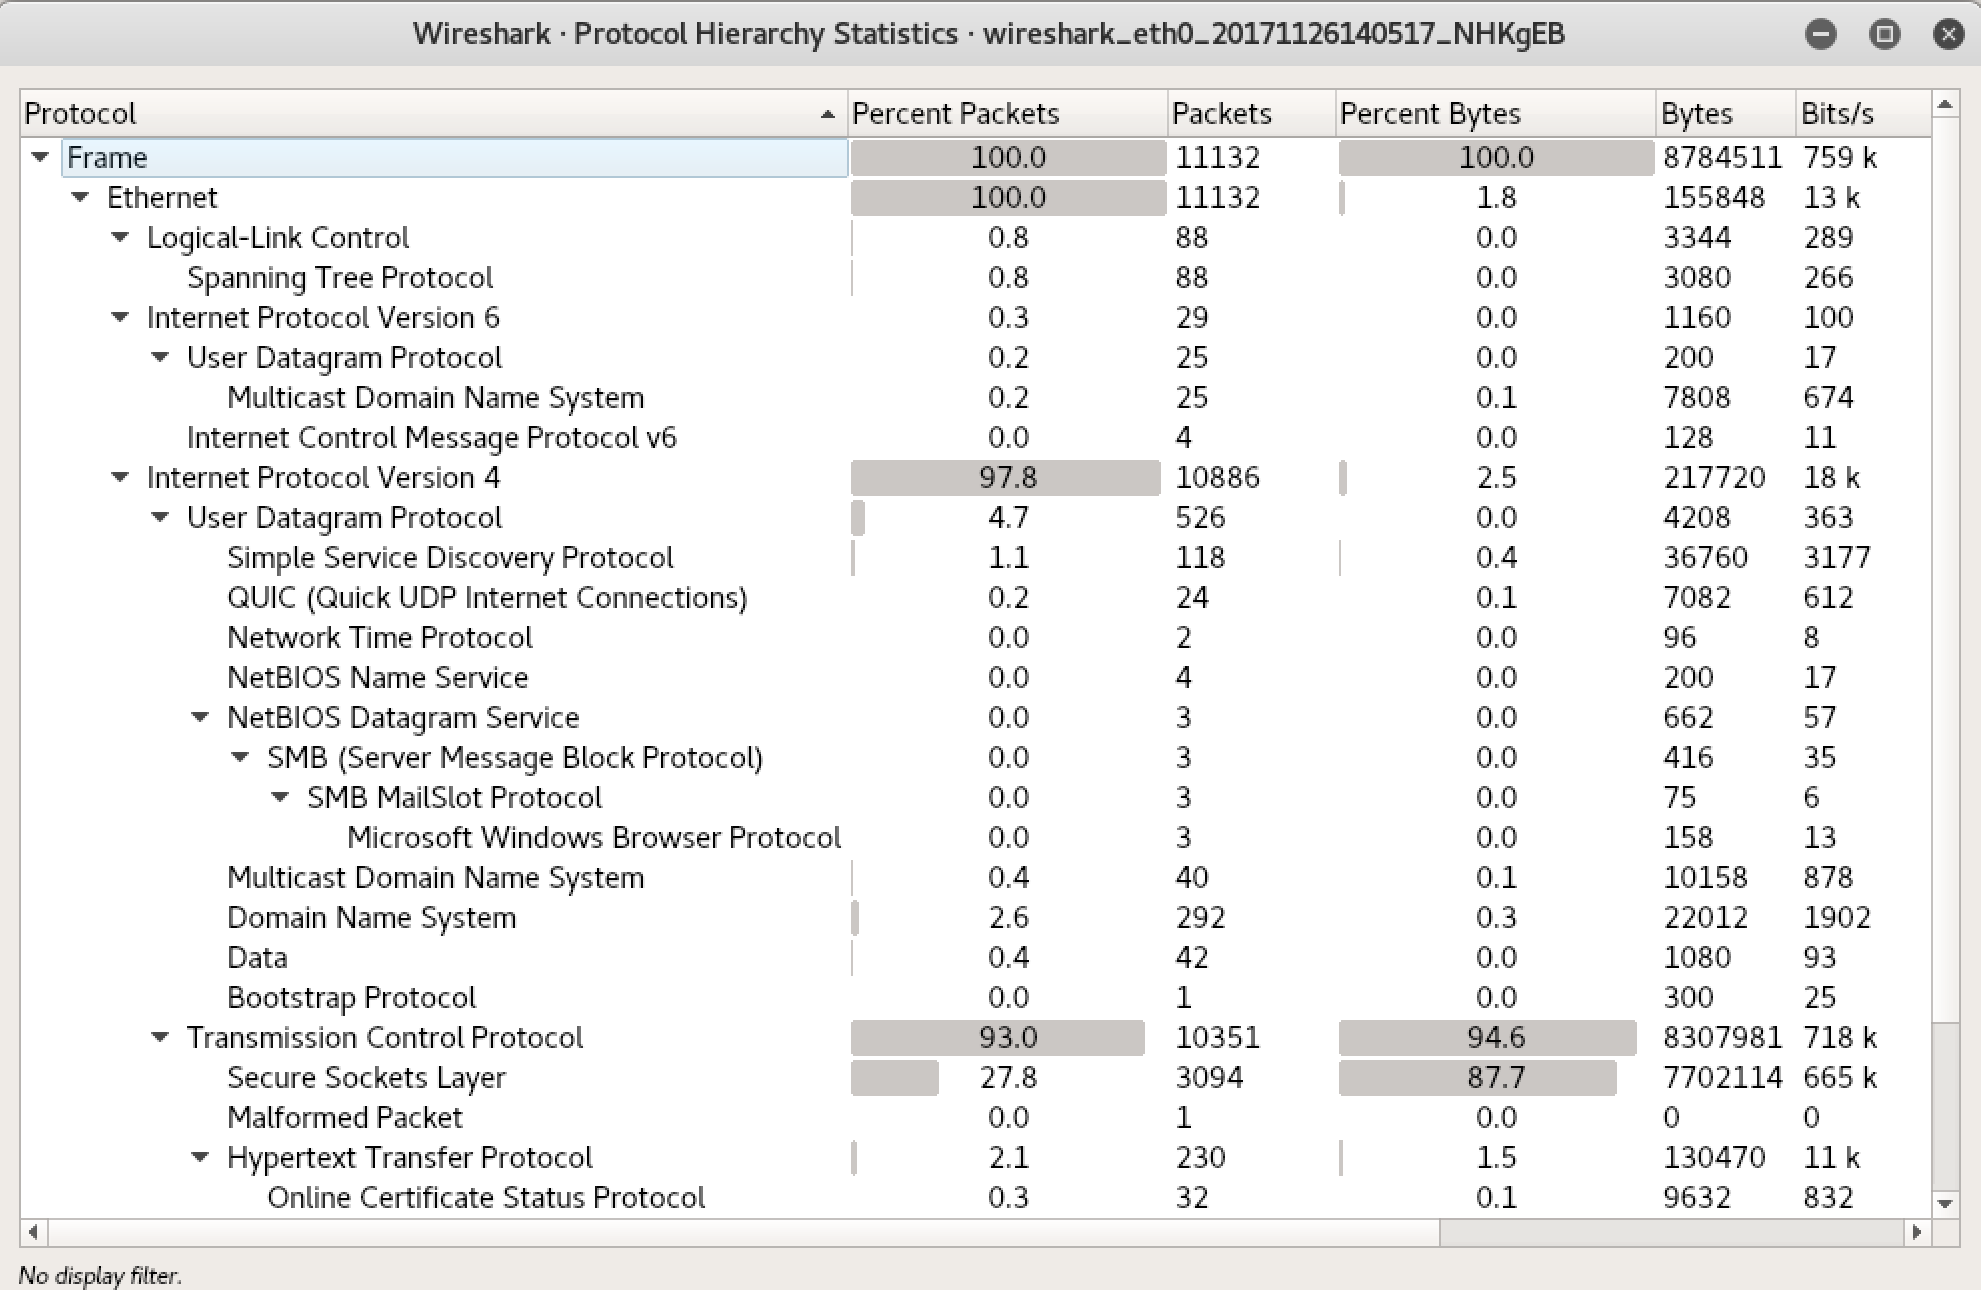
Figure 2-7. Protocol hierarchy in Wireshark
The protocol hierarchy view is good for, among other things, quickly identifying protocols that you don’t recognize. It also helps you to determine which protocols are the most used. If you believe, for instance, that you are using a lot of UDP-based attacks, but UDP is a small fraction of the total number of messages sent, you may want to do some further investigation.
Wireshark comes installed out of the box, so to speak, with Kali Linux. However, it can also be installed on other operating systems such as Windows and macOS as well as other Linux distributions. I can’t emphasize enough the value of this particular tool and the amount of work it can save after you get the hang of using it. Being able to completely decode application layer protocols so it can give you a little summary of what is happening with the application can be invaluable.
Poisoning Attacks
One of the challenges we have is that most networks are switched. The device you are connecting to sends messages only to the network port where your recipient is located. In the old days, we used hubs. Whereas a switch is a unicast device, a hub is a broadcast device. Any message that came into a hub was sent out to all other ports in the hub, letting the endpoints figure out who the frame belonged to, based on the MAC address. There was no intelligence in the hub at all. It was simply a repeater.
A switch changes all that. The switch reads the layer 2 header to determine the destination MAC address. It knows the port where the system that owns that MAC address is. It determines this by watching traffic coming into each port. The source MAC address gets attached to the port. The switch will commonly store these mappings in content addressable memory (CAM). Rather than having to scan through an entire table, the switch looks up the details by referring directly to the MAC address. This is the content that becomes the address the switch refers to in order to get the port information.
Why is this relevant here? Because you will sometimes want to collect information from a system that you don’t have access to. If you owned the network and had access to the switch, you may be able to configure the switch to forward traffic from one or more ports to another port. This would be a mirror, rather than a redirection. The recipient gets the traffic, but also a monitoring device or someone capturing traffic for analysis would get the packets.
To obtain the messages you need if you can’t get legitimate access to them, you can use a spoofing attack. In a spoofing attack, you pretend to be someone you are not in order to get traffic. There are a couple of ways to do that, and we’ll take a look at these different attacks.
Ethics Warning
While spoofing attacks are used by attackers, they are not something that you should be doing on a network you are testing, unless it falls into the scope of what you have said you would test against. There is the possibility of data loss using this technique.
ARP Spoofing
The Address Resolution Protocol (ARP) is a simple protocol. The assumption is when your system needs to communicate on the network but it has only the IP address and not the MAC address, it will send out a request (who-has) to the network. The system that has that IP address will respond (is-at) by filling in the MAC address for its system. Your system then knows the MAC address for the target system and can send the message it’s been holding to the correct destination.
To be efficient, your system will cache that mapping. In fact, it will cache any mapping that it sees go by. ARP assumes that the only time a system will indicate that it owns an IP address is when someone has asked. As it turns out, though, that’s not the case. If I were to have my system send out an ARP response (is-at) saying that I owned your IP address and that anyone trying to get to that IP address should send to my MAC address, I would get messages destined for you. By sending out an ARP response indicating your IP address is at my MAC address, I put myself into the middle of the communication flow.
This is only single-direction, though. If I end up spoofing your IP address with my MAC address, I’m getting only messages that were supposed to go to you. To get the other end of the conversation, I would need to spoof other addresses. You may, for example, spoof the local gateway in order to capture messages to and from you and the internet. This takes care of only getting the messages to me. I have to also get the messages back out to the intended targets, or the communication just stops because no one is getting messages they expect to get. This requires my system to forward the initial message out to the intended target.
Since ARP caches do time out, if I don’t keep having my system sending these messages, eventually the cache will time out and then I won’t get the messages I want anymore. This means that I need to keep sending out these messages, called gratuitous ARP messages. A gratuitous ARP message is one that hasn’t been requested but offered nonetheless. There are legitimate reasons for this behavior, but they aren’t common.
While other tools can be used for this, we can use the program Ettercap. Ettercap has two modes of functioning. The first is a curses-style interface, meaning it runs in a console but isn’t strictly command line. It presents a character-based GUI. The other one is a full Windows-based GUI. Figure 2-8 shows Ettercap after our target hosts have been selected and the ARP poisoning has been started. To start the spoofing attack, I scanned for hosts to get all of the MAC addresses on the network. Then, I selected the two targets and started the ARP spoofing attack.
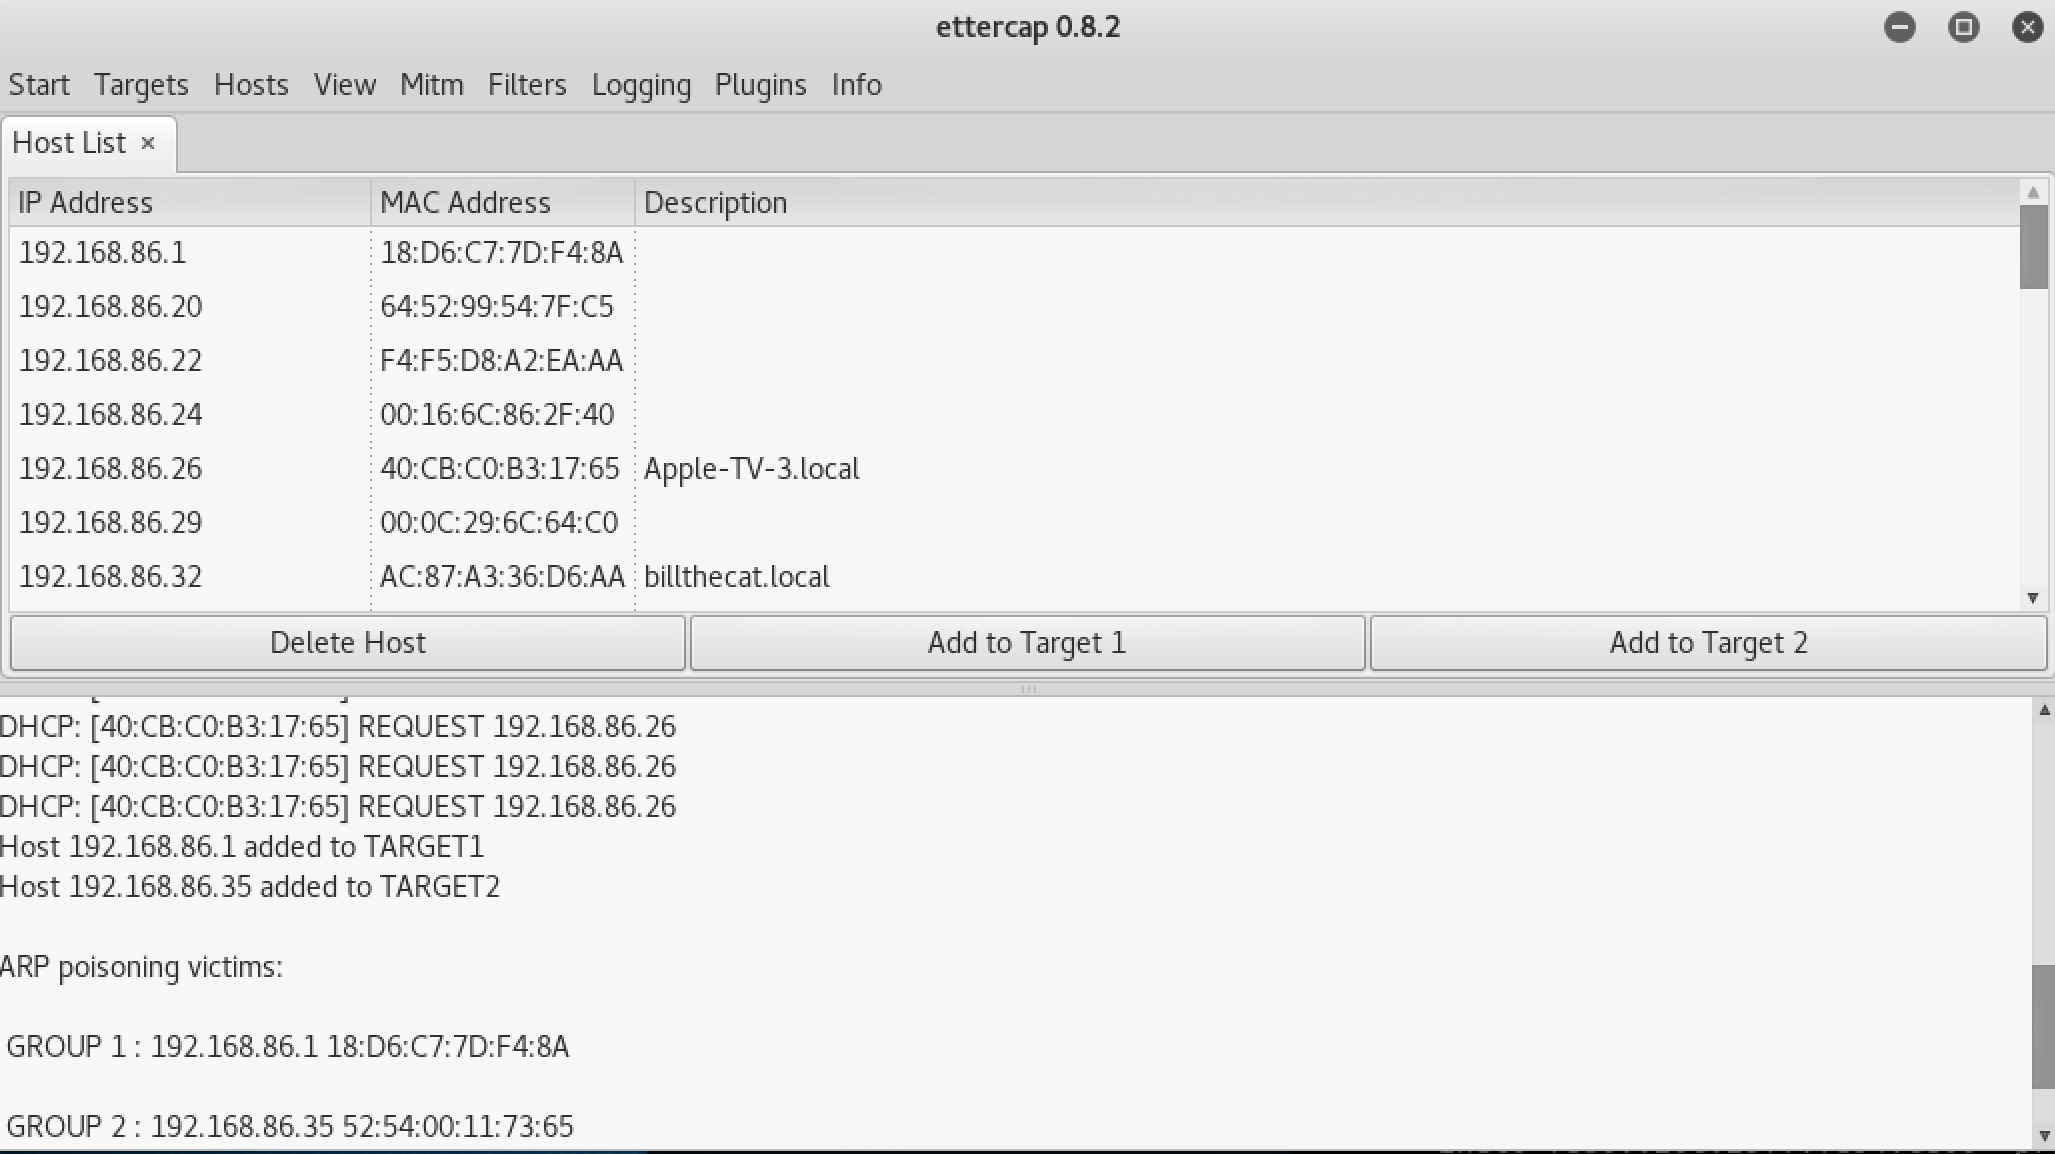
Figure 2-8. Using Ettercap
The reason for having two targets is to make sure to get both sides of a conversation. If I poison only one party, I will get only half of the conversation. I assume that what I want to gather is communication between my target and the internet. As a result, I set my target as one host and the router on my network as the second host. If I needed to acquire traffic between two systems on my network, I would select those. One would be in Target 1, and the other would be in Target 2. In Example 2-13, you can see what an ARP poison attack looks like from a packet capture. You will see the two ARP replies where the IP addresses belong to my targets. I included a portion of the ifconfig output on my system so you can see that the MAC address caught in the packet capture is the MAC address of my system, where I was running the ARP spoofing attack.
Example 2-13. tcpdump showing ARP poison attack
17:06:46.690545 ARP, Reply rosebud.lan is-at 00:0c:29:94:ce:06(oui Unknown), length 28 17:06:46.690741 ARP, Reply testwifi.here is-at 00:0c:29:94:ce:06(oui Unknown), length 28 17:06:46.786532 ARP, Request who-has localhost.lan tell savagewood.lan, length 46 ^C43packets captured43packets received by filter0packets dropped by kernel root@kali:~# ifconfig eth0 eth0:flags=4163<UP,BROADCAST,RUNNING,MULTICAST> mtu 1500 inet 192.168.86.227 netmask 255.255.255.0 broadcast 192.168.86.255 inet6 fe80::20c:29ff:fe94:ce06 prefixlen64scopeid 0x20<link> ether 00:0c:29:94:ce:06 txqueuelen1000(Ethernet)
Once I have an ARP spoofing attack in place, I can capture entire conversations by using tcpdump or Wireshark. Keep in mind that this sort of attack works on only the local network. This is because the MAC address is a layer 2 address so it stays on the local network and doesn’t cross over any layer 3 boundary (moving from one network to another). Ettercap also supports other layer 2 attacks like DHCP poisoning and ICMP redirect attacks. Any of these may be ways to ensure you are grabbing traffic from other systems on your local network.
DNS Spoofing
One solution to the issue of needing to capture traffic that may be outside the local network is using a DNS spoofing attack. In this attack, you interfere with a DNS lookup to ensure that when your target attempts to resolve a hostname into an IP address, the target gets the IP address of a system you control. This type of attack is sometimes called a cache poisoning attack. The reason for this is that what you may do is exploit a DNS server close to your target. This would generally be a caching server, meaning it looks up addresses from authoritative servers on your behalf and then caches the answer for a period of time determined by the authoritative server.
Once you have access to the caching server, you can modify the cache that’s in place to direct your targets to systems that you control. You can also include any entries that don’t exist by editing the cache. This would impact anyone who used that caching server. This process has the benefit of working outside the local network but has the disadvantage of requiring you to compromise a remote DNS server.
Perhaps easier, though still requiring you to be on the local network, is the program dnsspoof. When a system sends out a DNS request to a server, it expects a response from that server. The request includes an identifier so it is protected against attackers sending blind responses. If the attacker can see the request go out, though, it can capture the identifier and include it in a response that has the IP address belonging to the attacker. dnsspoof was written by Dug Song many years ago, at a time when it may have been less likely that you would be on a switched network. If you are on a switched network, you would have to go through the extra step of grabbing the DNS messages in order to see the request.
Running dnsspoof is easy, even if preparing for running it may not be. You need a hosts file mapping IP addresses to hostnames. This takes the form of single-line entries with the IP address followed by spaces and then the hostname that is meant to be associated with that IP address. Once you have the hosts file, you can run dnsspoof, as you can see in Example 2-14.
Example 2-14. Using dnsspoof
root@kali:~# dnsspoof -i eth0 -f myhosts udp dst port 53 dnsspoof: listening on eth0[udp dst port 53]192.168.86.227.37972 > 192.168.86.1.53: 10986+ A? www.bogusserver.com 192.168.86.227.49273 > 192.168.86.1.53: 28879+ A? www.bogusserver.com 192.168.86.227.48253 > 192.168.86.1.53: 53068+ A? www.bogusserver.com 192.168.86.227.49218 > 192.168.86.1.53: 45265+ A? www.bogusserver.com
You’ll notice that at the end of the command line, I have included BPF to focus the packets that are captured. Without this, tcpdump would default to looking only at UDP port 53, but not the IP address of the host it is being run on. I removed that part and included my own BPF in order to run tests on my local system. You’ll see the requests get flagged when they come in. This output is similar to what you might see from tcpdump.
You may be wondering why you’d bother to take the extra step of using dnsspoof if you have to use Ettercap or arpspoof (another ARP spoofing utility, though this one was written by Dug Song and included in the same suite of tools as dnsspoof). What you can do with dnsspoof that you can’t do with just ARP spoofing is directing a system to actually visit another IP address, thinking they are going to somewhere legitimate. You could create a rogue web server, for example, making it look like the real server but including some malicious code to gather data or infect the target. This is not the only purpose for doing DNS spoofing, but is a popular one.
Summary
Typically, attacks against systems will happen over the network. Although not all attacks go after network protocols, there are enough that do that it’s worth spending some time understanding the network elements and the protocols associated with the different layers. Here are some key points to take away from this chapter:
-
Security testing is about finding deficiencies in confidentiality, integrity, and availability.
-
The network stack based on the OSI model is physical, data, network, transport, session, presentation, and application.
-
Stress testing can reveal impacts to at least availability.
-
Encryption can make it difficult to observe network connections, but weak encryption can reveal issues with confidentiality.
-
Spoofing attacks can provide a way to observe and capture network traffic from remote sources.
Useful Resources
-
Dug Song’s dsniff Page
-
Ric Messier’s “TCP/IP” video (Infinite Skills, 2013)
-
TCP/IP Network Administration, 3e, by Craig Hunt (O’Reilly, 2010)