
Debugging
Bugs happen.
Five minutes ago, your code was working perfectly and you swear, all you did was change the color of some object! But now, when the spaceship hits the asteroid, it doesn’t spin any more. But it was totally spinning five minutes ago! And your friend agrees: “Yeah, I saw it spin. That was cool.” The rotate() function is there. What happened? It should work. This makes no sense at all! The computer is probably broken. Yeah. Yeah. It is definitely the computer’s fault.
No matter how much time you spend studying computer science, reading programming books, or playing audio recordings of code while you sleep hoping it will soak in that way, there is just no way to avoid getting stuck on a bug.
It can be really frustrating.
A bug is any defect in a program. Sometimes it’s obvious that you have a bug; your sketch will quit (or not run at all) and display an error in the message console. These types of bugs can be caused by simple typos, variables that were never initialized, looking for an element in an array that doesn’t exist, and so on. For some additional clues on “error” bugs, take a look at the Appendix on errors at the end of this book.
Bugs can also be more sinister and mysterious. If your Processing sketch does not function the way you intended it to, you have a bug. In this case, your sketch might run without producing any errors in the message console. Finding this type of bug is more difficult since it will not necessarily be as obvious where to start looking in the code.
In this chapter, I will discuss a few basic strategies for fixing bugs (“debugging”) with Processing.
11-1 Tip #1: Take a break
Seriously. Go away from your computer. Sleep. Go jogging. Eat an orange. Play scrabble. Do something other than working on your code. I can’t tell you how many times I have stared at my code for hours unable to fix it, only to wake up the next morning and solve the problem in five minutes.
11-2 Tip #2: Get another human being involved
Talk through the problem with a friend. The process of showing your code to another programmer (or non-programmer, even) and walking through the logic out loud will often reveal the bug. In many cases, it’s something obvious that you did not see because you know your code so well. The process of explaining it to someone else, however, forces you to go through the code more slowly. If you do not have a friend nearby, you can also do this out loud to yourself. Yes, you will look silly, but it helps.
11-3 Tip #3: Simplify
Simplify. Simplify! SIMPLIFY!
In Chapter 10, I focused on the process of incremental development. The more you develop your projects step-by-step, in small, easy-to-manage pieces, the fewer errors and bugs you will end up having. Of course, there is no way to avoid problems completely, so when they do occur, the philosophy of incremental development can also be applied to debugging. Instead of building the code up piece by piece, debugging involves taking the code apart piece by piece.
One way to accomplish this is to comment out large chunks of code in order to isolate a particular section. Following is the main tab of an example sketch. The sketch has an array of Snake objects, a Button object, and an Apple object. (The code for the classes is not included.) Let’s assume that everything about the sketch is working properly, except that the Apple is invisible. To debug the problem, everything is commented out except for the few lines of code that deal directly with initializing and displaying the Apple object.
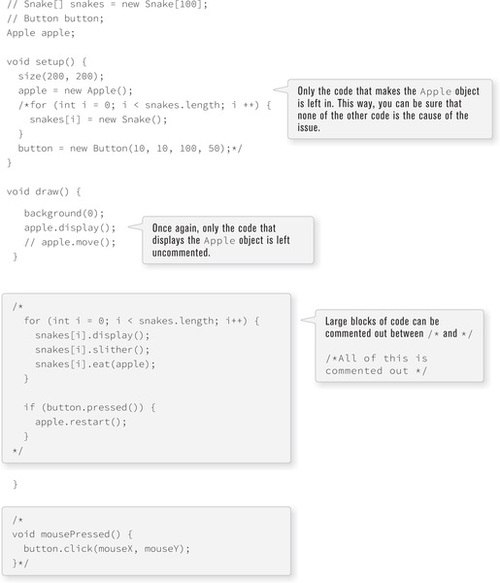
Once all the code is commented out, there are two possible outcomes. Either the apple still does not appear or it does. In the former, the issue is most definitely caused by the apple itself, and the next step would be to investigate the insides of the display() function and look for a mistake.
If the apple does appear, then the problem is caused by one of the other lines of code. Perhaps the move() function sends the apple offscreen so that you do not see it. Or maybe the snakes cover it up by accident. To figure this out, I would recommend putting back lines of code, one at a time. Each time you add back in a line of code, run the sketch and see if the apple disappears. As soon as it does, you have found the culprit and can root out the cause. Having an object-oriented sketch as above (with many classes) can really help the debugging process. Another tactic you can try is to create a new sketch and just use one of the classes, testing its basic features. In other words, do not worry about fixing your entire program just yet. First, create a new sketch that only does one thing with the relevant class (or classes) and reproduce the error. Let’s say that, instead of the apple, the snakes are not behaving properly. To simplify and find the bug, you could create a sketch that just uses one snake (instead of an array) without the apple or the button. Without the bells and whistles, the code will be much easier to deal with.

Although I have not yet looked at examples that involve external devices (I will in many of the chapters that follow), simplifying your sketch can also involve turning off connections to these devices, such as a camera, microphone, or network connection and replacing them with “dummy” information. For example, it’s much easier to find an image analysis problem if you just load a JPG, rather than use a live video source. Or load a local text file instead of connecting to a URL XML feed. If the problem goes away, you can then say definitively: “Aha, the web server is probably down” or “My camera must be broken.” If it does not, then you can dive into your code knowing the problem is there. If you’re worried about worsening the problem by taking out sections of code, just make a copy of your sketch first before you begin removing features.
11-4 Tip #4: println() is your friend
Using the message window to display the values of variables can be really helpful. If an object is completely missing on the screen and you want to know why, you can print out the values of its location variables. It might look something like this:
println(x, y);
Let’s say the result is:
9000000 −900000
9000116 −901843
9000184 −902235
9000299 −903720
9000682 −904903
It’s pretty obvious that these values are not reasonable pixel coordinates. So something would be off in the way the object is calculating its (x,y) location. However, if the values were perfectly reasonable, then you would move on. Maybe the color is the problem?
println("brightness:" + brightness(thing.col) + " alpha: " + alpha(thing.col));
brightness: 150.0 alpha: 0.0
Well, if the alpha value of the object’s color is zero, that would explain why you can’t see it! Let’s take a moment here to remember Tip #3: Simplify. This process of printing variable values will be much more effective if you are doing it in a sketch that only deals with the Thing object. This way, you can be sure that it is not another class which is, say, drawing over the top of the thing by accident.
You may have also noticed that the above print statements are written two different ways. The first one includes two variables separated by a comma. println() can receive any number of variables and will automatically display them separated by a space. You can also concatenate actual text with the variables or the results of function calls, as seen with brightness() and alpha()). The specifics of how this works will be explained in Chapter 17. It’s generally a good idea to do this. For example, take the following line of code that only prints the value of x, with no explanation.
println(x);
This can be confusing to follow in the message window, especially if you’re printing different values in different parts of the code. How do you know what is x and what is y? If you include your own notes in println(), there can’t be any confusion:
println("The x value of the thing I’m looking for is: " + x);
In addition, println() can be used to indicate whether or not a certain part of the code has been reached. For example, what if in the “bouncing ball” example, the ball never bounces off of the right-hand side of the window? The problem could be (a) you are not properly determining when it hits the edge, or (b) you are doing the wrong thing when it hits the edge. To know if your code correctly detects when it hits the edge, you could write:
if (x > width) {
println("x is greater than width. This code is happening now!");
xspeed *= −1;
}
If you run the sketch and never see the message printed, then something is probably flawed with your boolean expression.
Finally, for examining the contents of an array in the console, printArray() should be used. The printArray() function will format the array contents nicely as well as show the index values.
float[] values = new float[10];
for (int i = 0; i < values.length; i++) {
values[i] = random(10);
}
printArray(values);
Admittedly, println() and printArray() are not perfect debugging tools. It can be hard to track multiple pieces of information with the message window. It can also slow your sketch down rather significantly (depending on how much printing you are doing). The newest version of Processing (3) also includes a debugging tool (which you can enable via the “Debug” menu option or by clicking the debugger icon as pictured below).
The debugger allows you to pause the program (by specifying a breakpoint) and advance line by line in the code (known as stepping). Figure 11-1 shows a sketched paused at a specific breakpoint. You can see the state of current variables in the debugger window. You then have the option of either continuing which will run the code again until the next breakpoint or stepping line by line.

Figure 11-1
While the debugger tool is very useful, sometimes some sleep, a friend to talk to, and a little common sense is all you need.