
Chapter 20. Monitoring Servers
This chapter covers the following subjects:
![]() Performance Monitor: This intense GUI tool offers incredible monitoring capabilities for your system. This section of the chapter details this.
Performance Monitor: This intense GUI tool offers incredible monitoring capabilities for your system. This section of the chapter details this.
![]() Resource Monitor: Need quick, but accurate, information about the performance of your system? Resource Monitor provides this, and more.
Resource Monitor: Need quick, but accurate, information about the performance of your system? Resource Monitor provides this, and more.
This chapter ensures that you are proficient in the use of both Performance Monitor and Resource Monitor.
“Do I Know This Already?” Quiz
The “Do I Know This Already?” quiz allows you to assess whether you should read the entire chapter. Table 20-1 lists the major headings in this chapter and the “Do I Know This Already?” quiz questions covering the material in those headings so you can assess your knowledge of these specific areas. The answers to the “Do I Know This Already?” quiz appear in Appendix A, “Answers to the ‘Do I Know This Already?’ Quizzes and Q&A Questions.”
Caution
The goal of self-assessment is to gauge your mastery of the topics in this chapter. If you do not know the answer to a question or are only partially sure of the answer, you should mark your answer as incorrect for purposes of the self-assessment. Giving yourself credit for an answer you correctly guess skews your self-assessment results and might provide you with a false sense of security.
1. What counter does Performance Monitor display by default?
a. Disk Faults/Sec
b. Total Pages/Sec
c. % Processor Time
d. Total Avail Memory
2. What Performance Monitor tool is often used to create baselines?
a. Report Export
b. Alerts
c. Graphing
d. Data Collection Set
3. What tab appears when you first launch Resource Monitor in its default configuration?
a. Memory
b. Network
c. Overview
d. CPU
4. What visual representation does Resource Monitor use when information is filtered?
a. A red filter label
b. A green highlight
c. An exclamation point
d. An orange bar
Foundation Topics
Performance Monitor
You use Windows Performance Monitor to examine how programs and services you run affect your server’s performance. You can do this in real time and by collecting log data for later analysis.
Windows Performance Monitor uses performance counters, event trace data, and configuration information. You can combine all this information into Data Collector Sets.
Performance counters are measurements of system state or activity. These measurements might be from the operating system or from individual applications. Windows Performance Monitor pulls the current values of performance counters at specified time intervals.
Performance Monitor collects event trace data from trace providers, which are components of the operating system or of individual applications that report actions or events. Performance Monitor can collect output from multiple trace providers and combine it into a trace session.
Performance Monitor collects configuration information from key values in the Windows registry. Performance Monitor can also record the value of a registry key at a specified time or interval as part of a log file.
Monitoring Workloads Using Performance Monitor
To launch Performance Monitor, enter Performance Monitor in the Search area. Note that Performance Monitor launches in a Microsoft Management Console (MMC) with the Performance node selected, as shown in Figure 20-1. This view gives an overview of Performance Monitor and an important System Summary area where you can quickly view key system performance metrics.

To see the Performance Monitor tool itself, click Performance Monitor in the Monitoring Tools node, as shown in Figure 20-2.

Notice that, by default, Performance Monitor displays a graph of the single counter % Processor Time and samples this data every 1 second.
At the top of the graph are the following buttons:
![]() View Current Activity
View Current Activity
![]() View Log Data
View Log Data
![]() Change Graph Type
Change Graph Type
![]() Add
Add
![]() Delete
Delete
![]() Highlight
Highlight
![]() Paste Counter List
Paste Counter List
![]() Properties
Properties
![]() Zoom
Zoom
![]() Freeze Display
Freeze Display
![]() Update Data
Update Data
Right-clicking in the graph produces the following powerful shortcut menu items:
![]() Add Counters: Permits the addition of more counters to monitor other elements of server performance
Add Counters: Permits the addition of more counters to monitor other elements of server performance
![]() Save Settings As: Allows current settings to be saved
Save Settings As: Allows current settings to be saved
![]() Save Image As: Permits the saving of the graph as an image file
Save Image As: Permits the saving of the graph as an image file
![]() Save Data As: Permits the saving of the data captured by the graph
Save Data As: Permits the saving of the data captured by the graph
![]() Clear: Clears the current graph settings
Clear: Clears the current graph settings
![]() Zoom To: Allows the zooming to a time period on the graph
Zoom To: Allows the zooming to a time period on the graph
![]() Show Selected Counters: Allows the display of selected performance monitor counters on the graph
Show Selected Counters: Allows the display of selected performance monitor counters on the graph
![]() Hide Selected Counters: Hides the display of selected performance monitor counters on the graph
Hide Selected Counters: Hides the display of selected performance monitor counters on the graph
![]() Scale Selected Counters: Allows the adjustment of the time scale for selected counters
Scale Selected Counters: Allows the adjustment of the time scale for selected counters
![]() Remove All Counters: Removes all the counters added to the graph
Remove All Counters: Removes all the counters added to the graph
![]() Properties: Provides access to additional settings for the graph
Properties: Provides access to additional settings for the graph
Configuring Data Collector Sets
A Data Collector Set allows the capture of key Performance Monitor data for later review. This can be critical for many performance monitoring tasks, including the creation of a baseline. A baseline allows you to get a snapshot of server performance under various conditions. At the very least, most administrators like to get a snapshot of performance during “normal” workloads so they can easily see if something is abnormal with a server. After all, how can you identify abnormal performance if you do not know what normal performance looks like?
Follow these steps to configure a Data Collector Set:
Step 1. In the Performance Monitor MMC, expand the Data Collector Sets node.
Step 2. Right-click the User Defined node and choose New > Data Collector Set.
Step 3. In the Create New Data Collector Set Wizard, name your Data Collector Set. You now have the option to choose one of the following options:
![]() Create from a template (recommended)
Create from a template (recommended)
![]() Create manually (advanced)
Create manually (advanced)
Step 4. Select Create manually (advanced) and click Next.
Step 5. From the dialog box shown in Figure 20-3, select the type of data you want to include.
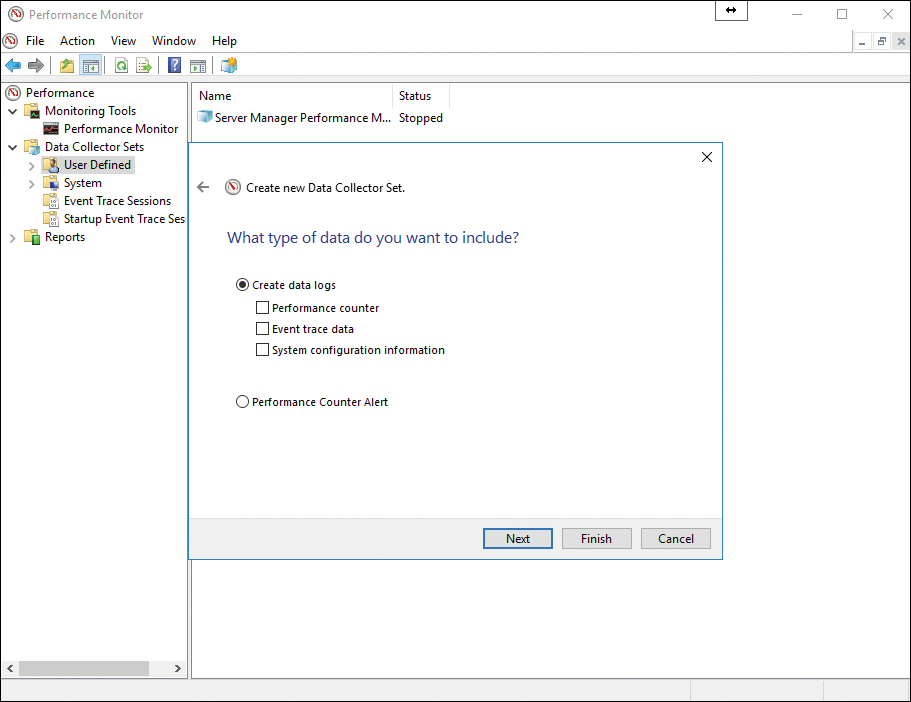
Step 6. Choose Performance Counter under Create Data Logs and click Next. Event trace data and system configuration information are for special use case scenarios.
Step 7. Select the performance counters you want to include by using the Add button, choose the sample interval and unit, and click Next.
Step 8. Select where you want Performance Monitor to save the data and click Next.
Step 9. On the Create the Data Collector Set page, select an account for running the collector from in the Run As drop-down and then select from the following:
![]() Open Properties for This Data Collector Set
Open Properties for This Data Collector Set
![]() Start This Data Collector Set Now
Start This Data Collector Set Now
![]() Save and Close
Save and Close
Step 10. Click Finish.
Congratulations! Your collector is complete. You now see your collector in the User Defined node. A right-click of your collector brings up the following options:
![]() Start
Start
![]() Stop
Stop
![]() Save Template
Save Template
![]() Data Manager
Data Manager
![]() Latest Report
Latest Report
![]() New - Data Collector
New - Data Collector
![]() New Window from Here
New Window from Here
![]() Delete
Delete
![]() Refresh
Refresh
![]() Properties
Properties
![]() Help
Help
Determining Appropriate CPU, Memory, Disk, and Networking Counters for Storage and Compute Workloads
The number of Performance Monitor counters you can add to a graph or Data Collector Set is truly astounding. In fact, consider that this number increases as you add server roles and features!
Here are some examples of critical counters along with desired values for general server health:
![]() LogicalDisk - % Free Space: Greater than 15%
LogicalDisk - % Free Space: Greater than 15%
![]() PhysicalDisk - % Idle Time: Greater than 20%
PhysicalDisk - % Idle Time: Greater than 20%
![]() PhysicalDisk - Avg. Disk Sec/Read: Less than 25 ms
PhysicalDisk - Avg. Disk Sec/Read: Less than 25 ms
![]() PhysicalDisk - Avg. Disk Sec/Write: Less than 25 ms
PhysicalDisk - Avg. Disk Sec/Write: Less than 25 ms
![]() PhysicalDisk - Avg. Disk Queue Length: Should not be larger than twice the number of physical disks
PhysicalDisk - Avg. Disk Queue Length: Should not be larger than twice the number of physical disks
![]() Memory - % Committed Bytes in Use: Less than 80%
Memory - % Committed Bytes in Use: Less than 80%
![]() Memory - Available Mbytes: Greater than 5% of total RAM
Memory - Available Mbytes: Greater than 5% of total RAM
![]() Processor - % Processor Time: Less than 85%
Processor - % Processor Time: Less than 85%
![]() System - Processor Queue Length: Should be more than twice the number of CPUs
System - Processor Queue Length: Should be more than twice the number of CPUs
![]() Network Interface - Output Queue Length: Less than 2
Network Interface - Output Queue Length: Less than 2
Configuring Alerts
Another incredibly powerful feature of Performance Monitor is its capability to alert you when a value is outside a threshold that you define. As discussed earlier in this chapter, you can configure these alerts when you configure a Data Collector Set. (Refer to Figure 20-3 to see the choice for configuring an alert.)
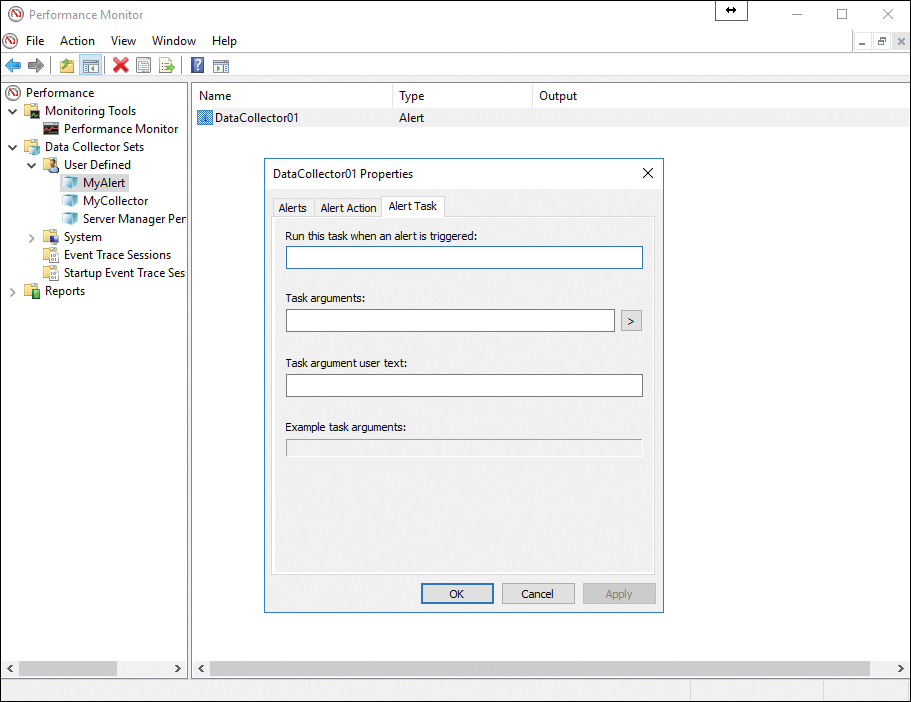
When you configure alerts, the values you can enter for the thresholds vary depending on what you select for your counters. In addition, once you have your alert created, you can right-click the data collector inside the alert and choose Properties to manipulate the following tabs:
![]() Alert Action
Alert Action
![]() Alert Task
Alert Task
Figure 20-4 shows the Properties window and the Alert Task tab.
Resource Monitor
Resource Monitor, which has been in use in Windows clients and servers since Windows Vista and Windows Server 2008 R2, is a powerful tool. By using this tool, you can understand how processes and services use your server system resources. In addition to monitoring resource usage in real time, Resource Monitor can help analyze unresponsive processes, determine which applications are using files, and control processes and services.
Monitoring Workloads Using Resource Monitor
To launch Resource Monitor, simply enter Resource Monitor in the Search area. Notice that Resource Monitor launches with the Overview tab selected (see Figure 20-5). This tab gives a quick view of CPU, disk, network, and memory usage.

To pause data collection and review the current data, select Monitor > Stop Monitoring. When you are ready to begin collecting data again, select Monitor > Start Monitoring.
Resource Monitor always starts in the same location and with the same display options as in the preceding session. However, at any time you can save your display state, including window size, column widths, optional columns, expanded tables, and the active tab. You can then open the configuration file to use the saved settings.
Resource Monitor includes the following elements and features:
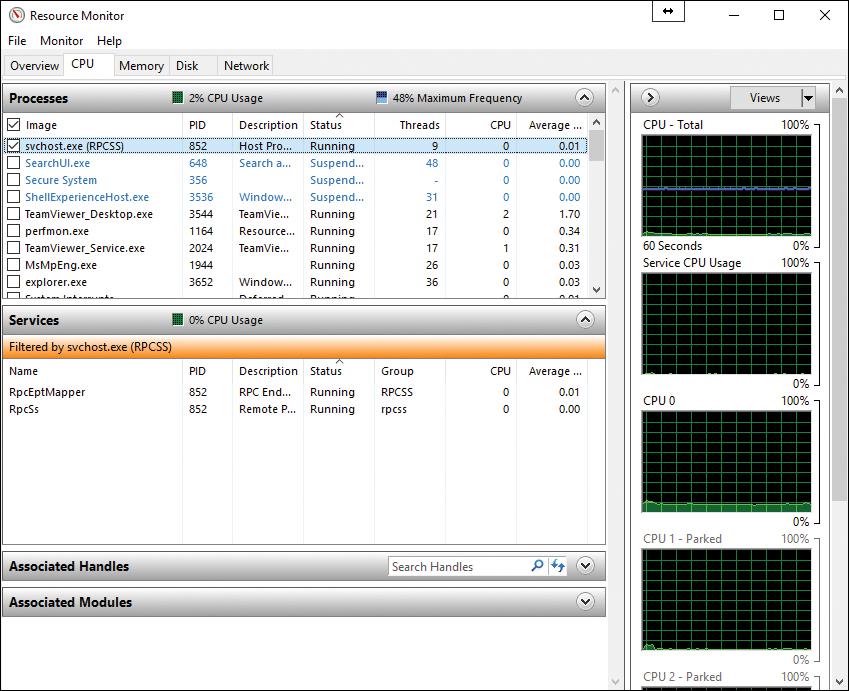
![]() Tabs: Resource Monitor has Overview, CPU, Memory, Disk, and Network tabs. If you filter results on one tab, only resources used by the selected processes or services display on the other tabs; Resource Monitor denotes filtered results with an orange bar below the title bar of each table. To stop filtering results while viewing the current tab, in the key table, clear the check box next to Image (see Figure 20-6).
Tabs: Resource Monitor has Overview, CPU, Memory, Disk, and Network tabs. If you filter results on one tab, only resources used by the selected processes or services display on the other tabs; Resource Monitor denotes filtered results with an orange bar below the title bar of each table. To stop filtering results while viewing the current tab, in the key table, clear the check box next to Image (see Figure 20-6).
![]() Tables: Each tab in Resource Monitor includes multiple tables that offer detailed information about the resource featured on that tab. Keep in mind the following about tables:
Tables: Each tab in Resource Monitor includes multiple tables that offer detailed information about the resource featured on that tab. Keep in mind the following about tables:
![]() To expand or collapse a table, click the arrow on the right side of the title bar of the table; not all tables are expanded by default.
To expand or collapse a table, click the arrow on the right side of the title bar of the table; not all tables are expanded by default.
![]() To add or hide data columns in a table, right-click any column label and then click Select Columns; select or clear the check boxes for the columns you want displayed; not all columns are displayed by default.
To add or hide data columns in a table, right-click any column label and then click Select Columns; select or clear the check boxes for the columns you want displayed; not all columns are displayed by default.
![]() The first table displayed is always the key table, and it always contains a complete list of processes using the resources included on that tab; for example, the key table on the Overview tab contains a complete list of processes running on the system.
The first table displayed is always the key table, and it always contains a complete list of processes using the resources included on that tab; for example, the key table on the Overview tab contains a complete list of processes running on the system.
![]() To sort table data, click the label of the column you want to sort by; to reverse the sort order, click the column label again.
To sort table data, click the label of the column you want to sort by; to reverse the sort order, click the column label again.
![]() You can filter the detailed data in tables other than the key table by one or more processes or services; to filter in the key table, select the check box next to each process or service you want to highlight; to stop filtering for a single process or service, clear its check box; to stop filtering altogether, in the key table, clear the check box next to Image.
You can filter the detailed data in tables other than the key table by one or more processes or services; to filter in the key table, select the check box next to each process or service you want to highlight; to stop filtering for a single process or service, clear its check box; to stop filtering altogether, in the key table, clear the check box next to Image.
![]() If you have filtered results, tables other than the key table display only data for the selected processes or services.
If you have filtered results, tables other than the key table display only data for the selected processes or services.
![]() To view definitions of data displayed in the tables, move the mouse pointer over the column title about which you want more information.
To view definitions of data displayed in the tables, move the mouse pointer over the column title about which you want more information.
![]() A process that is no longer running but that is included in the current displayed data appears as a gray entry in a table until the data expires.
A process that is no longer running but that is included in the current displayed data appears as a gray entry in a table until the data expires.
![]() Chart pane: Each tab in Resource Monitor includes a Chart pane on the right side of the window that displays graphs of the resources included on that tab. Keep in mind the following about the Chart pane:
Chart pane: Each tab in Resource Monitor includes a Chart pane on the right side of the window that displays graphs of the resources included on that tab. Keep in mind the following about the Chart pane:
![]() You can change the size of the graphs by clicking the Views button and selecting a different graph size.
You can change the size of the graphs by clicking the Views button and selecting a different graph size.
![]() You can hide the Chart pane by clicking the arrow at the top of the pane.
You can hide the Chart pane by clicking the arrow at the top of the pane.
![]() If you have filtered results, the resources used by the selected processes or services are shown in the graphs with an orange line.
If you have filtered results, the resources used by the selected processes or services are shown in the graphs with an orange line.
![]() If you have multiple logical processors, you can choose which ones are displayed in the Chart pane; on the CPU tab, click Monitor and then click Select Processors; in the Select Processors dialog box, clear the All CPUs check box and then select the check boxes for the logical processors you want to display.
If you have multiple logical processors, you can choose which ones are displayed in the Chart pane; on the CPU tab, click Monitor and then click Select Processors; in the Select Processors dialog box, clear the All CPUs check box and then select the check boxes for the logical processors you want to display.
Exam Preparation Tasks
As mentioned in the section “How to Use This Book” in the Introduction, you have a couple choices for exam preparation: the exercises here, Chapter 21, “Final Preparation,” and the exam simulation questions in the Pearson Test Prep Software Online.
Review All Key Topics
Review the most important topics in this chapter, noted with the Key Topics icon in the outer margin of the page. Table 20-2 lists these key topics and the page numbers on which each is found.

Table 20-2 Key Topics for Chapter 20
Complete Tables and Lists from Memory
This chapter does not have any memory tables.
Define Key Terms
Define the following key terms from this chapter and check your answers against the glossary:
Alert
Resource Monitor
Q&A
The answers to these questions appear in Appendix A. For more practice with exam format questions, use the Pearson Test Prep Software Online.
1. Where in Performance Monitor do you create alerts?
2. What are the five tabs in Resource Monitor?