
In this section, we'll take a look at how to run tcpdump on a Linux system to capture traffic.
If you have a Linux- or a Unix-based system (BSD; whatever it might be) that does not have Wireshark installed and you do not have the option of installing Wireshark, or if you have a system where you don't really want to spend the time to install Wireshark and you just want to do a quick capture, you can do so on almost all of them with tcpdump. This is a very common utility that's installed on almost every single NIC-based system out there.
What we have is a newer version of Ubuntu, and I've opened up the Terminal window, and all you have to do is run tcpdump. It's within the system variable path, so you don't have to go browse for it like we had to for the others on Windows, and I'll run it with --help. We can see that tcpdump has displayed its help contents and it shows us what arguments are available for it to receive:
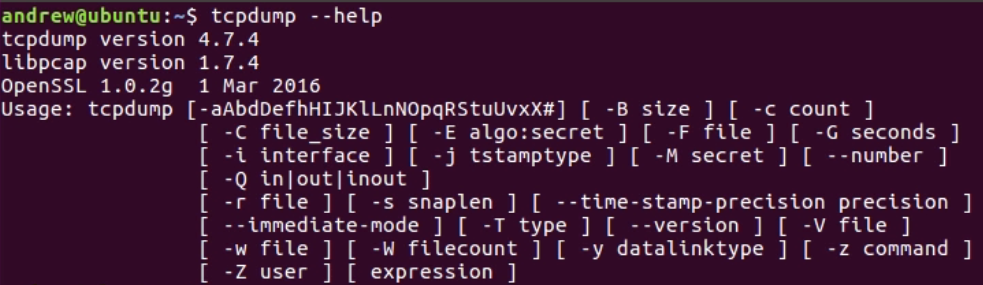
Now, you'll notice in the Usage line that the syntax for tcpdump and arguments and the flags that it has available are different from tshark and Wireshark, so we can't run the exact same commands. They're similar, but they're not exactly the same. For example, there's no -D for us to take a look at our interfaces. If you want to know the interfaces on your Linux system, usually you can run something like ifconfig or iwconfig, depending on what you're looking for, and it will output the interfaces that you have available, the IP addresses associated with them, and a bunch of other statistics:

Now, this is a virtual machine that's running right now, which is why it shows ens33 as the interface name. Quite often, this is eth0 or something like that. lo is our loopback on the system. Just like every other system you've seen in Windows and such, there's usually a loopback. This is a loopback on this system. If we look back to our information, we can run tcpdump, and we can also define an interface with the -i so that's where that interface comes in. We're going to do tcpdump -i ens33. Now, by default, tcpdump without the -i command will try to run on the default interface that you have, the ens33 interface in this example, and we can take a look at that in the following screenshot. When I try to do that, you'll see that I have an error. It says that You don't have permission to capture on that device:

Depending on your system, you'll probably have to run sudo and in order to do this, enter the password for your user which will elevate the privileges for your user so that you can run this command. You can see that it says tcpdump is now running. It would show us right now any packets that are coming into and out of the system if they were, but because this is the virtualized system, tcpdump is not functioning correctly on it right now:

Press Ctrl + C to cancel it, and you see that there are 0 packets. What we'll do instead is define the loopback interface for the example, using tcpdump -i lo for loopback, as we saw up here under the ifconfig command. If I do that now, it's listening; but, we don't have any traffic yet that is going to the loopback:

Now, we'll open up a new Terminal, and I'll generate some traffic. I'll simply ping my localhost. localhost as an alias name to 127.0.0.1, which is my loopback address. As I ping loopback, you'll now see that popping up in the tcpdump window:
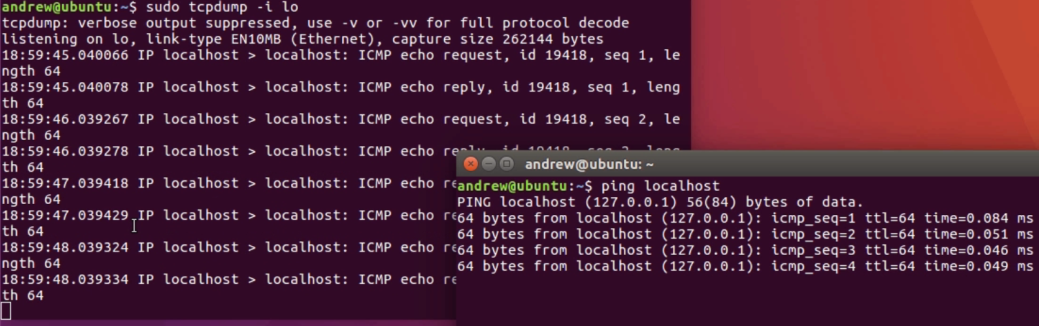
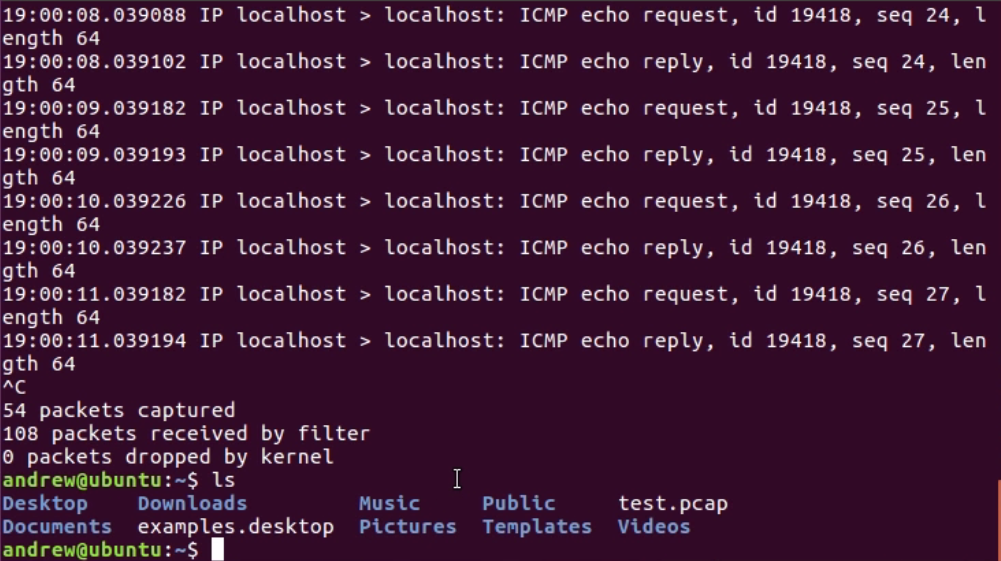
You see that, similar to tshark and Wireshark, we have the time that the packet occurred, from and to address, what kind of protocol is it, what's in the packet, and the details in there. We'll cancel that. Ctrl + C closes both of those.
Now if I were to do a listing, this is like dir in Windows: ls; I don't have any files here besides the test one that I did earlier:
By running that, it outputs to the stdout to the Terminal, but it doesn't actually save the file. In order to do so, we would have to define the file, just like in tshark. We'll remove my previous test files by typing the command rm test.pcap; you'll be able to see that it's now gone. We'll run tcpdump again, and this time, we'll define an output file for it to save to. As with tshark, luckily, we use -w for write. So, we're writing to a file test.pcap. After typing the command sudo tcpdump -i lo -w test.pcap and starting to generate some traffic, instead of outputting to the stdout, it's outputting to the file, and I can stop my traffic. I can also stop my capture, and it says it's saved 64 packets:
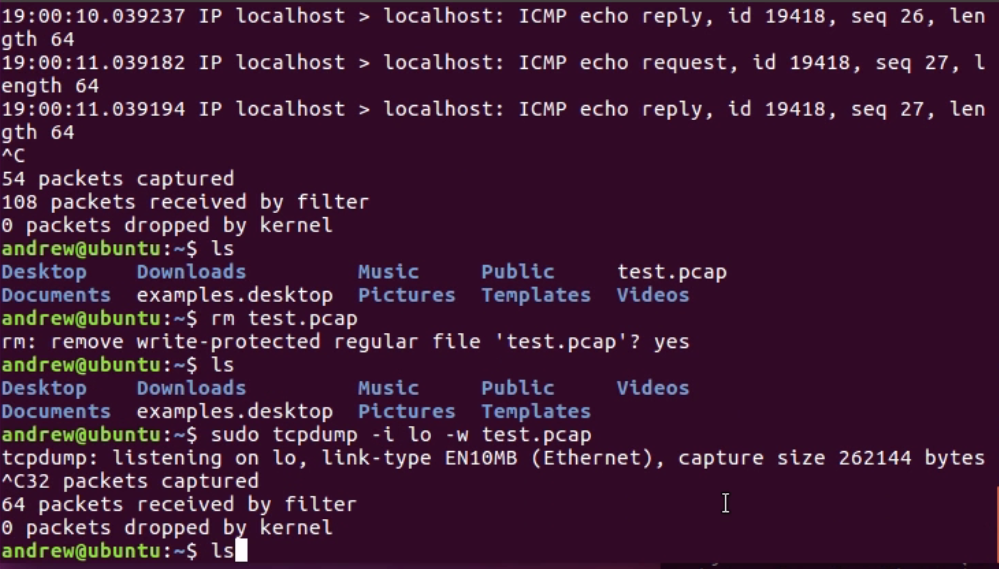
If I take a look at my listing, I do have test.pcap, and if I look at the size, I'll see that it does indeed have some bytes in there. There's also an option with W, and I wanted to point this out because I've been showing examples of ring buffers. This is a way of doing a ring buffer where it will automatically overwrite so many files. However, it will save many files you define and then, when you get to the maximum number, it will start overwriting the last oldest files. In the next section, we'll take a look at dumpcap, which is another option for tshark or tcpdump.