One of the coolest Statistics is flow graph.
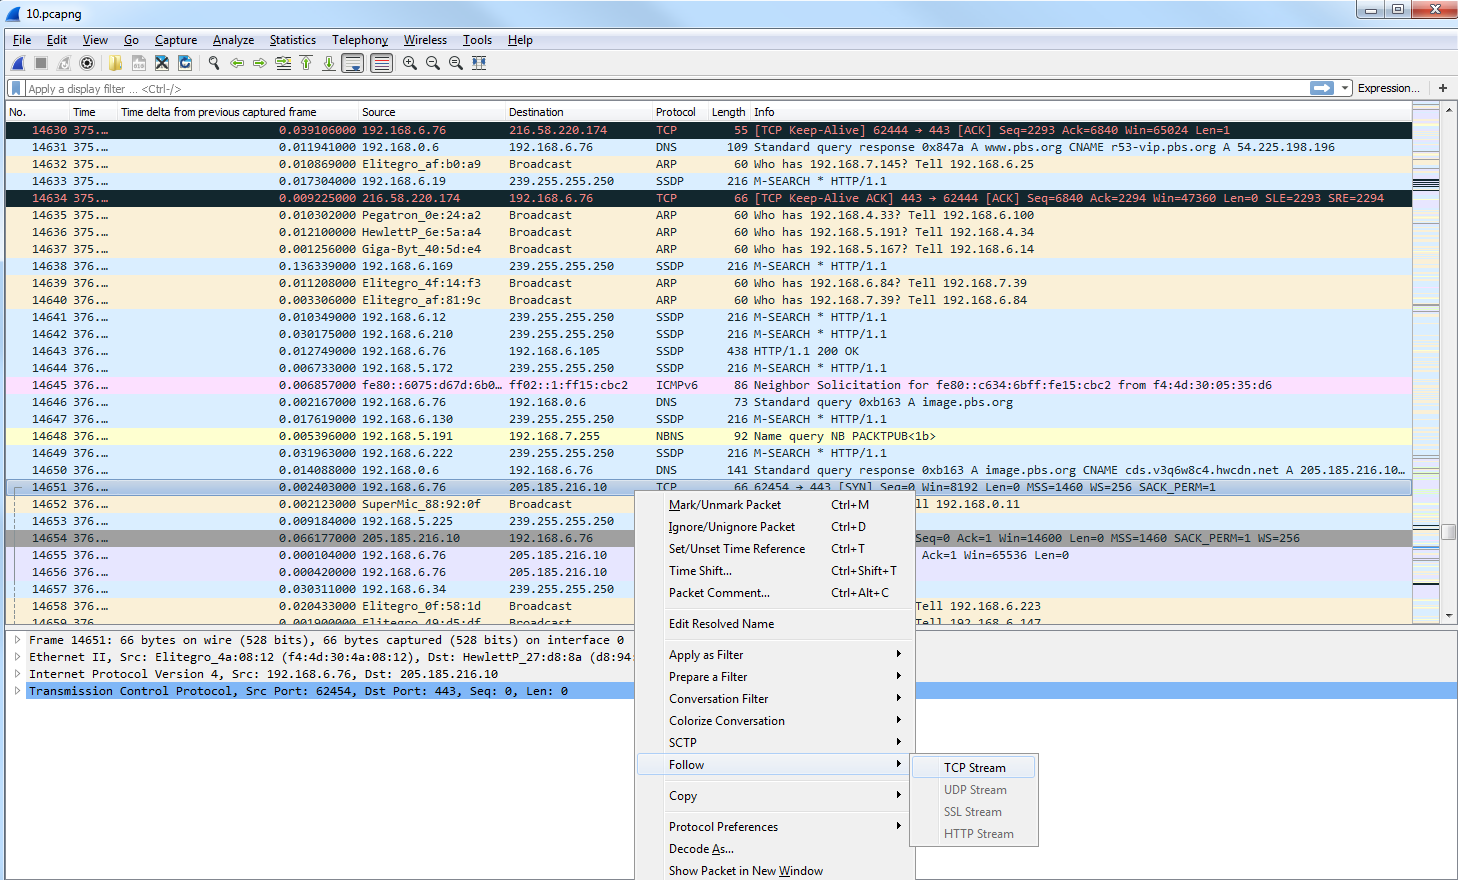
What we'll do is filter our traffic by this TCP flow. So we'll right-click on a TCP packet and go to Follow | TCP Stream:

Now, we will create a filter for that. We've snipped out just a little bit of our traffic, and what we'll do next is go to Statistics and click on Flow Graph:

By default, it shows all of the packets in our packet capture:

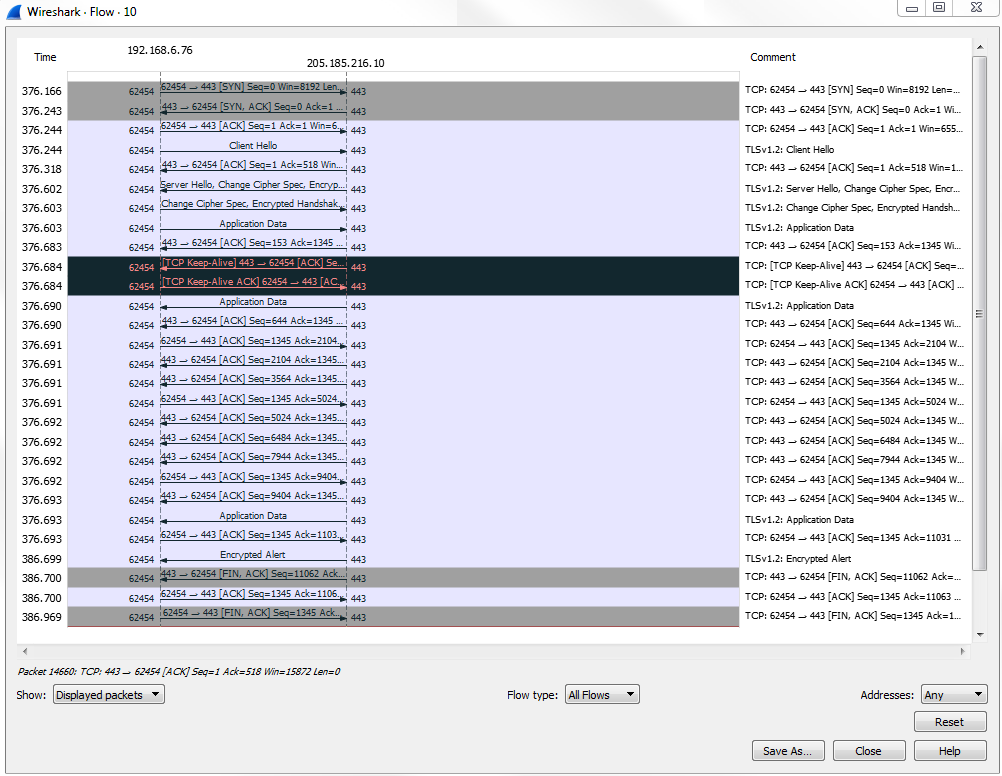
As we scroll through, you'll see all of the flows, all of the TCP handshakes-that is, the SYN, SYN, ACK, and ACK-and all of the requests and responses. Everything is in here, in a nice graphical format that you can use to diagnose your traffic. This is very useful for SIP traffic, for example.
What we can do is make the change in the bottom left where it says Show, and select Displayed packets here:

This change will be made for the filter that we have behind the screen. You can see the communication going from my computer to the server as I request for data such as a SYN:

It's a very useful way of graphically representing the data flows that occur within your packet capture.
