
Chapter 8 Fracture and fracture toughness
- 8.1 Introduction and synopsis 166
- 8.2 Strength and toughness 166
- 8.3 The mechanics of fracture 167
- 8.4 Material property charts for toughness 174
- 8.5 Drilling down: the origins of toughness 176
- 8.6 Manipulating properties: the strength–toughness trade-off 180
- 8.7 Summary and conclusions 183
- 8.8 Further reading 183
- 8.9 Exercises 184
- 8.10 Exploring design with CES 185
- 8.11 Exploring the science with CES Elements 185
It is easy to set a value on the engineering science that enables success, that makes things happen, but much harder to value engineering science that prevents failure, that stops things happening. One of the great triumphs of recent engineering science has been the development from the 1960s onward of a rigorous mechanics of material fracture. We have no numbers for the money and lives it has saved by preventing failures; all we know is that, by any measure, it is enormous. This chapter is about the ways in which materials fail when loaded progressively, and design methods to ensure that fracture won’t happen unless you want it to.

8.1 Introduction and synopsis
It is easy to set a value on the engineering science that enables success, that makes things happen, but much harder to value engineering science that prevents failure, that stops things happening. One of the great triumphs of recent engineering science has been the development from the 1960s onward of a rigorous mechanics of material fracture. We have no numbers for the money and lives it has saved by preventing failures; all we know is that, by any measure, it is enormous. This chapter is about the ways in which materials fail when loaded progressively, and design methods to ensure that fracture won’t happen unless you want it to.
Sometimes, of course, you do. Aircraft engines are attached to the wing by shear-bolts, designed to fail and shed the engine if it suddenly seizes. At a more familiar level, peel-top cans, seals on food containers and many other safety devices rely on controlled tearing or fracture. And processes like machining and cutting use a combination of plasticity and fracture.
We start by distinguishing strength from toughness. Toughness—resistance to fracture—requires a new material property, the fracture toughness developed in Section 8.3, to describe it. This new property is explored in Section 8.4 using charts like those we have already seen for modulus and strength. The underlying science mechanisms (Section 8.5) give insight into ways in which toughness can be manipulated (Section 8.6). The chapter ends in the usual way with a summary, suggestions for Further reading and Exercises.
8.2 Strength and toughness
Strength and toughness? Why both? What’s the difference?
Strength, when speaking of a material, is its resistance to plastic flow. Think of a sample loaded in tension. Increase the stress until dislocations sweep right across the section, meaning the sample just yields, and you measure the initial yield strength. Strength generally increases with plastic strain because of work hardening, reaching a maximum at the tensile strength. The area under the whole stress–strain curve up to fracture is the work of fracture. We’ve been here already—it was the subject of Chapter 5.
Toughness is the resistance of a material to the propagation of a crack. Suppose that the sample of material contained a small, sharp crack, as in Figure 8.1(a). The crack reduces the cross-section A and, since stress σ is F/A, it increases the stress. But suppose the crack is small, hardly reducing the section, and the sample is loaded as before. A tough material will yield, work harden and absorb energy as before—the crack makes no significant difference. But if the material is not tough (defined in a moment) then the unexpected happens; the crack suddenly propagates and the sample fractures at a stress that can be far below the yield strength. Design based on yield is common practice. The possibility of fracture at stresses below the yield strength is really bad news. And it has happened, on spectacular scales, causing boilers to burst, bridges to collapse, ships to break in half, pipelines to split and aircraft to crash. We get to that in Chapter 10.
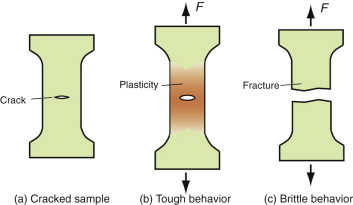
Figure 8.1Tough and brittle behavior. The crack in the tough material, shown in (b), does not propagate when the sample is loaded; that in the brittle material propagates without general plasticity, and thus at a stress less than the yield strength.
So what is the material property that measures the resistance to the propagation of a crack? And just how concerned should you be if you read in the paper that cracks have been detected in the track of the railway on which you commute or in the pressure vessels of the nuclear reactor of the power station a few miles away? If the materials are tough enough you can sleep in peace. But what is ‘tough enough’
This difference in material behaviour, once pointed out, is only too familiar. Buy a CD, a pack of transparent folders or even a toothbrush: all come in perfect transparent packaging. Try to get them out by pulling and you have a problem: the packaging is strong. But nick it with a knife or a key or your teeth and suddenly it tears easily. That’s why the makers of shampoo sachets do the nick for you. What they forget is that the polymer of the sachet becomes tougher when wet, and that soapy fingers can’t transmit much force. But they had the right idea.
Tests for toughness
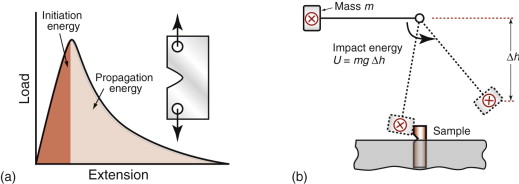
If you were asked to devise a test to characterise toughness, you might dream up something like those of Figure 8.2: notch the material, then yank it or whack it till it breaks, measuring the energy to do so. Tests like these (there are many variants) in fact are used for ranking and as an acceptance procedure when taking delivery of a new batch of material. The problem is that they do not measure a true material property, meaning one that is independent of the size and shape of the test sample, so the energy measurements do not help with design. To get at the real, underlying, material properties we need the ideas of stress intensity and fracture toughness.
8.3 The mechanics of fracture
Stress intensity Kl and fracture toughness Klc
Cracks concentrate stress. A remote stress σ applies a force that is transmitted through a cracked material in the way suggested by Figure 8.3. The local stress, σlocal, which is proportional to the number of lines of force crossing unit length of cross-section, is nonuniform, rising steeply as the crack tip is approached. The stress concentration factor, defined for notches and holes in Chapter 7, does not help here—it is relevant only for features with a finite radius of curvature. Cracks are sharp—the radius at the tip is essentially zero. Analysis of the stress field ahead of a sharp crack of length c shows that the local stress at a distance r from its tip caused by a remote uniform tensile stress σ is
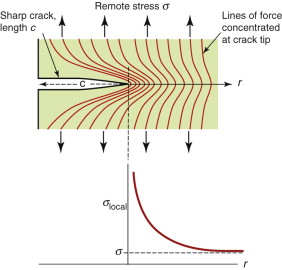
Figure 8.3 Lines of force in a cracked body under load; the local stress is proportional to the number of lines per unit length, increasing steeply as the crack tip is approached.
where Y is a constant with a value near unity that depends weakly on the geometry of the cracked body. Far from the crack, where r ≫ c, the local stress falls to the value σ, but near the tip, where r ≪ c, it rises steeply, as
So for any given value of r the local stress scales as ![]() , which therefore is a measure of the intensity of the local stress (the inclusion of the π is a convention used universally). This quantity is called the mode 1 stress intensity factor (the ‘mode 1’ means tensile loading normal to the crack) and given the symbol K1:
, which therefore is a measure of the intensity of the local stress (the inclusion of the π is a convention used universally). This quantity is called the mode 1 stress intensity factor (the ‘mode 1’ means tensile loading normal to the crack) and given the symbol K1:
It has units of MPa.m1/2.
For reasons explored later, cracks propagate when the stress intensity factor exceeds a critical value. This critical value is called the fracture toughness, K1c. Figure 8.4 shows two sample geometries used to measure K1c (there are others, described in Chapter 10). A sample containing a sharp crack of length c (if a surface crack) or 2c (if a contained crack) is loaded, recording the tensile stress σ* at which it suddenly propagates. It is essential that the crack be sharp—not an easy thing to achieve—because if it is not, the part of the stress field with the highest stresses, where the lines of force in Figure 8.3 are closest together, is changed. There are ways of making sharp cracks for doing this test—books on fracture mechanics describe them—but let us simply assume we have one. The value of Y for this geometry is 1 provided c ≪ w; when it is not, there is a small correction factor. Then the quantity K1c is given by
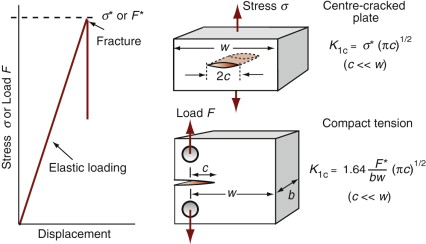
Figure 8.4 Measuring fracture toughness, K1c. Two test configurations are shown here; others are described in Chapter 10.
Example 8.1
The stainless steel and polystyrene rulers in Example 5.2 are loaded as cantilevers of length 250 mm. Both have transverse scratches of depth 0.2 mm, near the base of the cantilever, on the tensile side. For this surface crack geometry, assume the factor Y in equation (8.4) is 1.1. The fracture toughnesses Klc of steel and polystyrene are 80 and 1 MPa.m1/2, respectively. Calculate the stress needed to cause fast fracture in each case. Will the cantilevers fail by yielding or by fast fracture?
Answer. From equation (8.4), the stress at fast fracture for stainless steel is
This is far in excess of its yield strength, meaning that the ruler will yield before it fractures. Conversely, for polystyrene the fracture stress is
which is less than its yield strength, so the ruler will fracture before it yields.
Fracture toughness is a material property, and this means two things. The first is that its value is independent of the way it is measured—different test geometries, if properly conducted, give the same value of K1c for any given material (Figure 8.4). The second is that it can be used for design, in ways described in Chapter 10.
Energy release rate G and toughness Gc
When a sample fractures, a new surface is created. Surfaces have energy, the surface energy γ, with units of joules1 per square meter (typically γ = 1 J/m2). If you fracture a sample across a cross-section area A you make an area 2A of new surface, requiring an energy of at least 2Aγ joules to do so. Consider first the question of the necessary condition for fracture. It is that sufficient external work be done, or elastic energy released, to at least supply the surface energy, γ per unit area, of the two new surfaces that are created. We write this as
where G is called the energy release rate. In practice, it takes much more energy than 2γ because of plastic deformation round the crack tip. But the argument still holds: growing a crack costs energy Gc J/m2 for the two surfaces—a sort of ‘effective’ surface energy, replacing 2γ. It is called, confusingly, the toughness (or the critical strain energy release rate). This toughness Gc is related to the fracture toughness K1c in the following way.
Think of a slab of material of unit thickness carrying a stress σ. The elastic energy stored in it (Chapter 4) is
per unit volume. Now put in a crack of length c, as in Figure 8.5. The crack relaxes the stress in a half-cylinder of radius about c—the reddish half-cylinder in the figure—releasing the energy it contained:
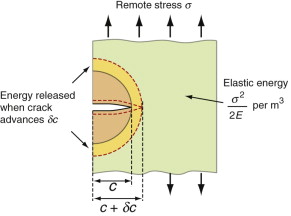
Suppose now that the crack extends by δc, releasing the elastic energy in the yellow segment. This energy must pay for the extra surface created, and the cost is Gcδc. Thus, differentiating the last equation, the condition for fracture becomes
But σ2πc is just ![]() , so from equation (8.4), taking Y = 1,
, so from equation (8.4), taking Y = 1,

This derivation is an approximate one. A more rigorous (but much more complicated) one shows that the form of equation (8.9) is right, but that it is too small by exactly a factor of 2. Thus, correctly, the result we want (taking the square root) is:
The crack tip plastic zone
The intense stress field at the tip of a crack generates a process zone: a plastic zone in ductile solids, a zone of micro-cracking in ceramics, a zone of delamination, debonding and fibre pull-out in composites. Within the process zone, work is done against plastic and frictional forces; it is this that accounts for the difference between the measured fracture energy Gc and the true surface energy 2γ. We can estimate the size of a plastic zone that forms at the crack tip as follows. The stress rises as ![]() as the crack tip is approached (equation (8.2)). At the point where it reaches the yield strength σy the material yields (Figure 8.6) and—except for some work hardening—the stress cannot climb higher than this. The distance from the crack tip where σlocal = σy is found by setting equation (8.2) equal to σy and solving for r. But the truncated part of the elastic stress field is redistributed, making the plastic zone larger. The analysis of this is complicated but the outcome is simple: the radius ry of the plastic zone, allowing for stress redistribution, is twice the value found from equation (8.2), giving
as the crack tip is approached (equation (8.2)). At the point where it reaches the yield strength σy the material yields (Figure 8.6) and—except for some work hardening—the stress cannot climb higher than this. The distance from the crack tip where σlocal = σy is found by setting equation (8.2) equal to σy and solving for r. But the truncated part of the elastic stress field is redistributed, making the plastic zone larger. The analysis of this is complicated but the outcome is simple: the radius ry of the plastic zone, allowing for stress redistribution, is twice the value found from equation (8.2), giving
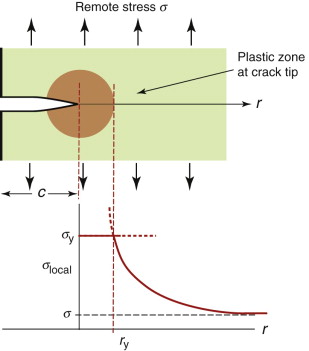
Figure 8.6 A plastic zone forms at the crack tip where the stress would otherwise exceed the yield strength σy.
(taking Y = 1). Note that the size of the zone shrinks rapidly as σy increases: cracks in soft metals have large plastic zones; those in ceramics and glasses have small zones or none at all.
The property K1c has well-defined values for brittle materials and for those in which the plastic zone is small compared to all dimensions of the test sample so that most of the sample is elastic. When this is not so, a more complex characterisation is needed. In very ductile materials the plastic zone size exceeds the width of the sample; then the crack does not propagate at all—the sample simply yields.
When cracks are small, materials yield before they fracture; when they are large, the opposite is true. But what is ‘small’? Figure 8.7 shows how the tensile failure stress varies with crack size. When the crack is small, this stress is equal to the yield stress; when large, it falls off according to equation (8.4), which we write (taking Y = 1 again) as
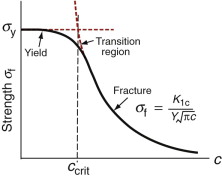

The transition from yield to fracture is smooth, as shown in the figure, but occurs around the intersection of the two curves, when σf = σy, giving the transition crack length

This is the same as the plastic zone size at fracture (equation (8.11)), when K1 = K1c.
Example 8.2
Estimate the plastic zone sizes for the cracks in the stainless steel and polystyrene rulers in Example 8.1.
Answer. The plastic zone size is given by
For stainless steel this is ![]() —much greater than the crackdepth of 0.2 mm and greater than the thickness of the ruler. For polystyrene it is
—much greater than the crackdepth of 0.2 mm and greater than the thickness of the ruler. For polystyrene it is![]() , which is less than the crack depth. So the stainless steel ruler yields and the polystyrene one fractures.
, which is less than the crack depth. So the stainless steel ruler yields and the polystyrene one fractures.
Table 8.1 lists the range of values for the main material classes. These crack lengths are a measure of the damage tolerance of the material. Tough metals are able to contain large cracks but still yield in a predictable, ductile, manner. Ceramics (which always contain small cracks) fail in a brittle way at stresses far below their yield strengths. Glass can be used structurally, but requires careful treatment to prevent surface flaws developing. Polymers are perceived as tough, due to their resistance to impact when they are not cracked. But the table shows that defects less than 1 mm can be sufficient to cause some polymers to fail in a brittle manner.
Table 8.1 Approximate crack lengths for transition between yield and fracture
| Material class | Transition crack length, ccrit (mm) |
|---|---|
| Metals | 1–1000 |
| Polymers | 0.1–10 |
| Ceramics | 0.01–0.1 |
| Composites | 0.1–10 |
8.4 Material property charts for toughness
The fracture toughness–modulus chart
The fracture toughness K1c is plotted against modulus E in Figure 8.8. The range of K1c is large: from less than 0.01 to over 100 MPa.m1/2. At the lower end of this range are brittle materials, which, when loaded, remain elastic until they fracture. For these, linear elastic fracture mechanics works well, and the fracture toughness itself is a well-defined property. At the upper end lie the super-tough materials, all of which show substantial plasticity before they break. For these the values of K1c are approximate but still helpful in providing a ranking of materials. The figure shows one reason for the dominance of metals in engineering; they almost all have values of K1c above 15 MPa.m1/2, a value often quoted as a minimum for conventional design.
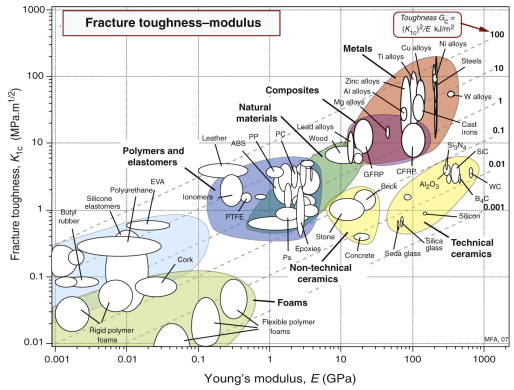
The log scales of Figure 8.8 allow us to plot contours of toughness, Gc, the apparent fracture surface energy (since Gc ≈ ![]() ). The diagonal broken lines on the chart show that the values of the toughness start at 10−3 kJ/m2 (about equal to the surface energy, γ) and range through almost five decades to over 100 kJ/m2. On this scale, ceramics (10−3 – 10−1 kJ/m2) are much lower than polymers (10−1 – 10 kJ/m2); this is part of the reason polymers are more widely used in engineering than ceramics, a point we return to in Chapter 10.
). The diagonal broken lines on the chart show that the values of the toughness start at 10−3 kJ/m2 (about equal to the surface energy, γ) and range through almost five decades to over 100 kJ/m2. On this scale, ceramics (10−3 – 10−1 kJ/m2) are much lower than polymers (10−1 – 10 kJ/m2); this is part of the reason polymers are more widely used in engineering than ceramics, a point we return to in Chapter 10.
The fracture toughness–strength chart
Strength-limited design relies on the component yielding before it fractures. This involves a comparison between strength and toughness— Figure 8.9 shows them on a property chart. Metals are both strong and tough—that is why they have become the workhorse materials of mechanical and structural engineering.
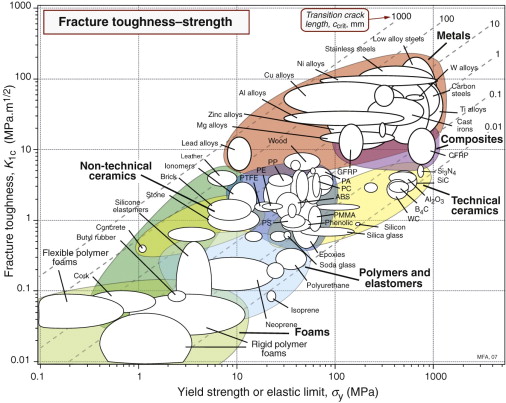
Figure 8.9 A chart of fracture toughness K1c and yield strength σy. The contours show the transition crack size, ccrit.
The stress at which fracture occurs depends on both K1c and the crack length c (equation (8.12)). The transition crack length ccrit at which ductile behaviour is replaced by brittle is given by equation (8.13). It is plotted on the chart as broken lines labeled ‘Transition crack length’. The values vary enormously, from near-atomic dimensions for brittle ceramics and glasses to almost a meter for the most ductile of metals like copper or lead. Materials toward the bottom right have high strength and low toughness; they fracture before they yield. Those toward the top left do the opposite: they yield before they fracture.
The diagram has application in selecting materials for the safe design of load-bearing structures (Chapter 10). The strength–fracture toughness chart is also useful for assessing the influence of composition and processing on properties.
8.5 Drilling down: the origins of toughness
Surface energy
The surface energy of a solid is the energy it costs to make it. It is an energy per unit area, units J/m2. Think of taking a 1 m cube of material and cutting it in half to make two new surfaces, one above and one below, as in Figure 8.10. To do so we have to provide the cohesive energy associated with the bonds that previously connected across the cut. The atoms are bonded on all sides so the surface atoms lose one-sixth of their bonds when the cut is made. This means that we have to provide one-sixth of the cohesive energy Hc (an energy per unit volume) to a slice 4ro thick, were ro is the atom radius, thus to a volume 4ro m3. So the surface energy should be:
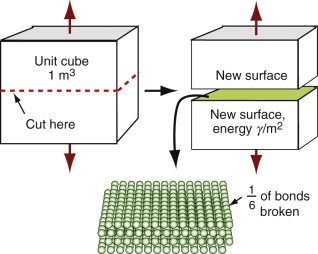
Figure 8.10 When new surface is created as here, atomic bonds are broken, requiring some fraction of the cohesive energy, Hc.
with Hc, typically, 3 × 10¹⁰ J/m3 and ro typically 10−10 m, so surface energies are around 1 J/m2.
The toughness Gc cannot be less than 2γ. The chart of Figure 8.8 shows contours of Gc; for most materials its value is hundreds of times larger than 2γ. Where is the extra energy going? The answer is: into plastic work. We will examine that in more detail in a moment. First, let’s examine cleavage fracture.
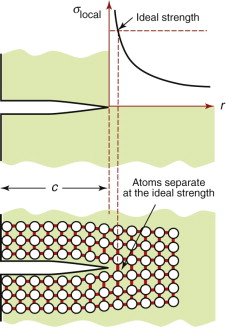
Brittle ‘cleavage’ fracture
Brittle fracture is characteristic of ceramics and glasses. These have very high yield strengths, giving them no way to relieve the crack tip stresses by plastic flow. This means that, near the tip, the stress reaches the ideal strength (about E/15, Chapter 6). That is enough to tear the atomic bonds apart, allowing the crack to grow as in Figure 8.11. And since ![]() , an increase in c means an increase in K1, causing the crack to accelerate until it reaches the speed of sound—that is why brittle materials fail with a bang. Some polymers are brittle, particularly the amorphous ones. The crack tip stresses unzip the weak Van der Waals bonds between the molecules.
, an increase in c means an increase in K1, causing the crack to accelerate until it reaches the speed of sound—that is why brittle materials fail with a bang. Some polymers are brittle, particularly the amorphous ones. The crack tip stresses unzip the weak Van der Waals bonds between the molecules.
Tough ‘ductile’ fracture
To understand how cracks propagate in ductile materials, think first of pulling a sample with no crack, as in Figure 8.12. Ductile metals deform plastically when loaded above their yield strength, work hardening until the tensile strength is reached. Thereafter, they weaken and fail. What causes the weakening? If ultra-pure, the metal may simply thin down until the cross-section goes to zero. Engineering alloys are not ultra-pure; almost all contain inclusions—small, hard particles of oxides, nitrides, sulfides and the like. As the material—here shown as a test specimen—is stretched, it deforms at first in a uniform way, building up stress at the inclusions, which act as stress concentrations. These either separate from the matrix or fracture, nucleating tiny holes. The holes grow as strain increases, linking and weakening the part of the specimen in which they are most numerous until they finally coalesce to give a ductile fracture. Many polymers, too, are ductile. They don’t usually contain inclusions because of the way in which they are made. But when stretched they craze—tiny cracks open up in the most stretched regions, whitening them if the polymer is transparent, simply because the Van der Waals bonds that link their long chains to each other are weak and pull apart easily. The details differ but the results are the same: the crazes nucleate, grow and link to give a ductile fracture.
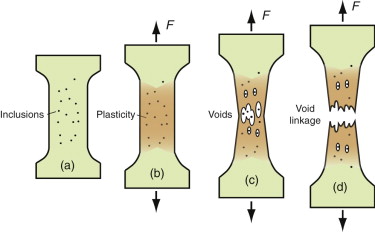
Figure 8.12 Ductile fracture. Plasticity, shown in brown, concentrates stress on inclusions that fracture or separate from the matrix, nucleating voids that grow and link, ultimately causing fracture.
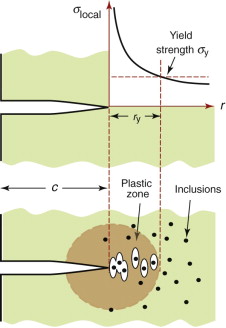
Return now to the cracked sample, shown in Figure 8.13. The stress still rises as ![]() as the crack tip is approached, but at the point that it exceeds the yield strength σy the material yields and a plastic zone develops. Within the plastic zone the same sequence as that of Figure 8.12 takes place: voids nucleate, grow and link to give a ductile fracture. The crack advances and the process repeats itself. The plasticity blunts the crack and the stress-concentrating effect of a blunt crack is less severe than that of a sharp one, so that at the crack tip itself the stress is just sufficient to keep plastically deforming the material there. This plastic deformation absorbs energy, increasing the toughness Gc.
as the crack tip is approached, but at the point that it exceeds the yield strength σy the material yields and a plastic zone develops. Within the plastic zone the same sequence as that of Figure 8.12 takes place: voids nucleate, grow and link to give a ductile fracture. The crack advances and the process repeats itself. The plasticity blunts the crack and the stress-concentrating effect of a blunt crack is less severe than that of a sharp one, so that at the crack tip itself the stress is just sufficient to keep plastically deforming the material there. This plastic deformation absorbs energy, increasing the toughness Gc.
The ductile-to-brittle transition
A cleavage fracture is much more dangerous than one that is ductile: it occurs without warning or any prior plastic deformation. At low temperatures some metals and all polymers become brittle and the fracture mode switches from one that is ductile to one of cleavage—in fact only those metals with an FCC structure (copper, aluminum, nickel and stainless steel, for example) remain ductile to the lowest temperatures. All others have yield strengths that increase as the temperature falls, with the result that the plastic zone at any crack they contain shrinks until it becomes so small that the fracture mode switches, giving a ductile-to-brittle transition. For some steels that transition temperature is as high as 0 °C (though for most it is considerably lower), with the result that steel ships, bridges and oil rigs are more likely to fail in winter than in summer. Polymers, too, have a ductile-to-brittle transition, a consideration in selecting those that are to be used in freezers and fridges.
Embrittlement of other kinds
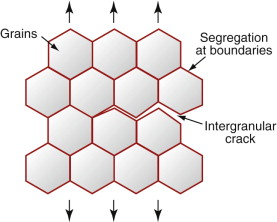
Change of temperature can lead to brittleness; so, too, can chemical segregation. When metals solidify, the grains start as tiny solid crystals suspended in the melt, and grow outward until they impinge to form grain boundaries. The boundaries, being the last bit to solidify, end up as the repository for the impurities in the alloy. This grain boundary segregation can create a network of low-toughness paths through the material so that, although the bulk of the grains is tough, the material as a whole fails by brittle intergranular fracture (Figure 8.14). The locally different chemistry of grain boundaries causes other problems, such as corrosion (Chapter 17)—one way in which cracks can appear in initially defect-free components.
8.6 Manipulating properties: the strength–toughness trade-off
Metals
It is not easy to make materials that are both strong and tough. The energy absorbed by a crack when it advances, giving toughness, derives from the deformation that occurs in the plastic zone at its tip. Equation (8.11) showed that increasing the yield strength causes the zone to shrink and the smaller the zone, the smaller the toughness. Figure 8.15 shows strength and toughness for wrought and cast aluminum alloys, indicating the strengthening mechanisms. All the alloys have a higher strength and lower toughness than pure aluminum. The wrought alloys show a slight drop in toughness with increasing strength; for the cast alloys the drop is much larger because of intergranular fracture.
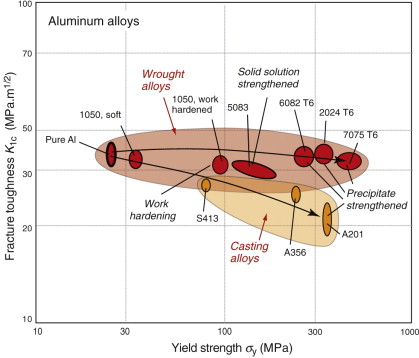
Separation within the plastic zone, allowing crack advance, results from the growth of voids that nucleate at inclusions (Figure 8.13). Toughness is increased with no loss of strength if the inclusions are removed, delaying the nucleation of the voids. ‘Clean’ steels, superalloys and aluminum alloys, made by filtering the molten metal before casting, have significantly higher toughness than those made by conventional casting methods.
Polymers and composites
The microstructures and properties of polymers are manipulated by cross-linking and by adjusting the molecular weight and degree of crystallinity. Figures 8.8 and 8.9 showed that the strengths of polymers span around a factor of 5, whereas fracture toughness spans a factor of 20. More dramatic changes are possible by blending, by adding fillers and by reinforcement with chopped or continuous fibres to form composites. Figure 8.16 shows how these influence the modulus E and fracture toughness K1c of polypropylene (PP). Blending or co-polymerization with elastomers such as EPR or EDPM (‘impact modifiers’) reduces the modulus but increases the fracture toughness K1c and toughness Gc. Filling with cheap powdered glass, talc or calcium carbonate more than doubles the modulus, but at the expense of some loss of toughness.
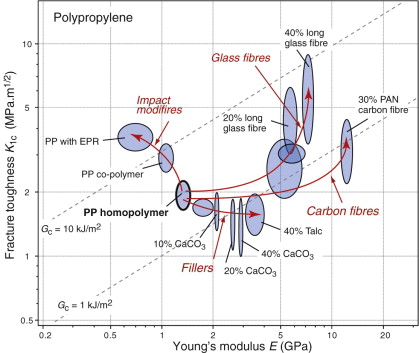
Figure 8.16 The strength and toughness of polypropylene, showing the effect of fillers, impact modifiers and fibres.
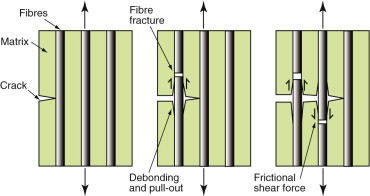
Reinforcement with glass or carbon fibres most effectively increases both modulus and fracture toughness K1c, and in the case of glass, the toughness Gc as well. How is it that a relatively brittle polymer (K1c ≈ 3 MPa.m1/2) mixed with even more brittle fibres (glass K1c ≈ 0.8 MPa.m1/2) can give a composite K1c as high as 10 MPa.m1/2? The answer is illustrated in Figure 8.17. The fine fibres contain only tiny flaws and consequently have high strengths. When a crack grows in the matrix, the fibres remain intact and bridge the crack. This promotes multiple cracking—each contributing its own energy and thereby raising the overall dissipation. When the fibres do break, the breaks are statistically distributed, leaving ligaments of fibre buried in the matrix. Fibre pull-out, as the cracks open up, dissipates more energy by friction. Composites are processed to control adhesion between the fibres and the matrix to maximise the toughening by these mechanisms.
8.7 Summary and conclusions
Toughness is the resistance of a material to the propagation of a crack. Tough materials are forgiving: they tolerate the presence of cracks, they absorb impact without shattering and, if overloaded, they yield rather than fracture. The dominance of steel as a structural material derives from its unbeatable combination of low cost, high stiffness and strength and high toughness.
Toughness is properly measured by loading a precracked sample with one of a number of standard geometries, measuring the load at which the crack first propagates. From this is calculated the fracture toughness, K1c, as the value of the stress intensity, K1, at which the crack advances. Values of K1c above about 15 MPa.m1/2 are desirable for damage-tolerant design—design immune to the presence of small cracks. The charts of Figures 8.8 and 8.9 show that most metals and fibre-reinforced composites meet this criterion, but polymers and ceramics fall below it. We shall see in Chapter 10 that some designs require a high value not of K1c but of the toughness Gc = ![]() , also shown in the chart of Figure 8.8. Polymers do well by this criterion and it is in applications that require it that they become a good choice. Ceramics are poor by this criterion too, making design with them much more difficult.
, also shown in the chart of Figure 8.8. Polymers do well by this criterion and it is in applications that require it that they become a good choice. Ceramics are poor by this criterion too, making design with them much more difficult.
High toughness means that crack advance absorbs energy. It does so in the plastic zone that forms at the crack tip; the larger this becomes, the higher is the fracture toughness. As the material within the plastic zone deforms, voids nucleate at inclusions and link, advancing the crack; the cleaner the material, the fewer are the inclusions, contributing further to high toughness. The higher the yield strength, the smaller is the zone until, in ceramics, which have very high yield strengths, the zone becomes vanishingly small, the stresses approach the ideal strength and the material fails by brittle cleavage fracture.
This is the background we need for design. That comes in Chapter 10, after we have examined fracture under cyclic loads.
Broek D. Elementary Engineering Fracture Mechanics 3rd ed. 1981 Martinus Nijhoff Boston, USA ISBN 90-247-2580-1. (A standard, well-documented introduction to the intricacies of fracture mechanics.)
Ewalds H.L., Wanhill R.J.H. Fracture Mechanics 1984 Edward Arnold London, UK ISBN 0-7131-3515-8. (An introduction to fracture mechanics and testing for both static and cyclic loading.)
Hertzberg R.W. Deformation and Fracture of Engineering Materials 3rd ed. 1989 Wiley New York, USA ISBN 0-471-63589-8. (A readable and detailed coverage of deformation, fracture and fatigue.)
Kinloch A.J., Young R.J. Fracture Behavior of Polymers 1983 Elsevier Applied Science London, UK ISBN 0-85334-186-9. (An introduction both to fracture mechanics as it is applied to polymeric systems and to the fracture behaviour of different classes of polymers and composites.)
Knott J.F. The Mechanics of Fracture 1973 Butterworths London, UK ISBN 0-408-70529-9. (One of the first texts to present a systematic development of the mechanics of fracture; dated, but still a good introduction.)
Tada H., Paris G., Irwin G.R. The Stress Analysis of Cracks Handbook 3rd ed. 2000 ISBN 1-86058-304-0. (Here we have another ‘Yellow Pages’, like Roark for stress analysis of uncracked bodies—this time of stress intensity factors for a great range of geometries and modes of loading.)
8.9 Exercises
- Exercise E8.1 What is meant by toughness? How does it differ from strength?
- Exercise E8.2 Why does a plastic zone form at the tip of a crack when the cracked body is loaded in tension?
- Exercise E8.3 Why is there a transition from ductile to brittle behavior at a transition crack length, ccrit
- Exercise E8.4 A tensile sample of width 10 mm contains an internal crack of length 0.3 mm. When loaded in tension the crack suddenly propagates when the stress reaches 450 MPa. What is the fracture toughness K1c of the material of the sample? If the material has a modulus E of 200 GPa, what is its toughness Gc? (Assume Y = 1.)
- Exercise E8.5 Use the K1c−E chart of Figure 8.8 to establish:
- Exercise E8.6 Find epoxy, soda glass and GFRP (epoxy reinforced with glass fibers) on the chart of Figure 8.8 and read off an approximate mean value for the toughness Gc for each. Explain how it is that the toughness of the GFRP is so much larger than that of either of its components.
- Exercise E8.7 Use the chart of Figure 8.8 to compare the fracture toughness, K1c, of the two composites GFRP and CFRP. Do the same for their toughness, Gc. What do the values suggest about applications they might best fill?
- Exercise E8.8 Use the K1c−σy chart of Figure 8.9 to find:
8.10 Exploring design with CES (use the Level 2 database unless otherwise stated)
- Exercise E8.9 Make a bar chart with
 for an internal crack of length 2c = 1 mm plotted on the y-axis (use the ‘Advanced’ facility to form the function).
Fracture toughness/((3.142 × 0.0005)∧0.5).
Which materials have the highest values? Add an axis of density, ρ. Use the new chart to find the two materials with highest values of σf/ρ.
- Exercise E8.10 Suppose that the resolution limit of the nondestructive testing facility available to you is 1 mm, meaning that it can detect cracks of this length or larger. You are asked to explore which materials will tolerate cracks equal to or smaller than this without brittle fracture. Make a bar chart with
 for an internal crack of length 2c = 1 mm plotted on the y-axis, as in the previous exercise. Add yield strength, σy, on the x-axis. The material will fracture in tension if σf < σy, and it will yield, despite being cracked, if σf > σy. Plot either on a printout of the chart or in CES (using the line selection tool) a line of slope 1 along which σf = σy. All the materials above the line will yield, all those below will fracture. Do age-hardened aluminum alloys lie above the line? Does CFRP?
 - Exercise E8.11 Find data for PVCs in the Level 3 database and make a plot like that of Figure 8.16 showing how fillers, blending and fibres influence modulus and toughness.
8.11 Exploring the science with CES Elements
- Exercise E8.12 Explore the origins of surface energy, γ J/m2. The toughness, Gc, cannot be less than 2γ because two new surfaces are created when a material is fractured. What determines γ and how big is it? The text explained how bonds are broken and atoms separated when a new surface is created. It was shown in Section 8.4 that
where Hc is the cohesive energy in J/m3 and ro is the atomic radius in m. To convert Hc in kJ/mol (as it is in the database) into these units, multiply it by 106/molar volume and to convert ro from nm into m multiply by 10−9. All this can be done using the ‘Advanced’ facility in the axis-choice dialog box.
Make a chart with γ calculated in this way on the x-axis and the measured value, ‘Surface energy, solid’ on the y-axis, and see how good the agreement is.
- Exercise E8.13 If you pull on an atomic bond, it breaks completely at a strain of about 0.1. If the atom spacing is ao, then breaking it requires a displacement δ = 0.1ao and doing so creates two new surfaces, each of area
 . If the bond stiffness is S, then the work done to stretch the bonds to breaking point, and hence to create the new surfaces, per unit area, is
(using equation (4.17) for S), where ro is the atomic radius. Use the CES Elements database to explore whether real surface energies can be explained in this way. (Watch out for the units.)
- Exercise E8.14 Observe the general magnitudes of surface energies γ: they are about 1.5 J/m2. Thus, the minimum value for Gc should be about 2γ or 3 J/m2. Return to the CES Edu Level 3 database and find the material with the lowest value of Gc, which you can calculate as
 . Is it comparable with 2γ? Limit the selection to metals and alloys, polymers, technical ceramics and glasses only, using a ‘Tree’ stage (materials such as foam have artificially low values of Gc because they are mostly air).
1 James Joule (1818–1889), English physicist, did not work on fracture or on surfaces, but his demonstration of the equivalence of heat and mechanical work linked his name to the unit of energy.