
Chapter 7
Ambient RF Electromagnetic Measurements
in a Rural Environment1
7.1. Introduction
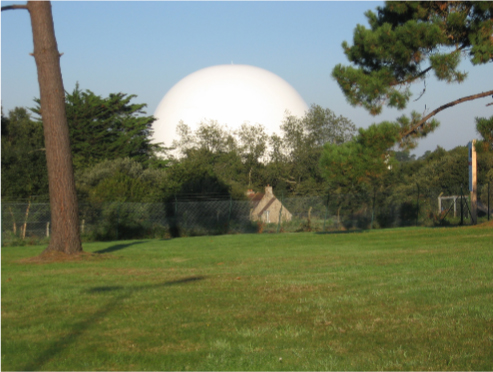
The electromagnetic measurements presented hereafter are typical examples of radioelectrical power observed in a rural environment. Located at 48 ° 47′ 07″ North latitude and 3 ° 31′ 05″ West longitude, the site where the measurements were taken is close to the Radome in Pleumeur Bodou, which shelters the first telecommunication by satellite antenna (Figure 7.1) and about 1 km from the small town of Pleumeur Bodou (3,800 inhabitants) and from the emitter.
Near to where the measurements are taken, there are no trains, motorways, broadcast/television transmitters or airports. We can consider this place, at least in terms of electromagnetic direction as a very ordinary place such as one can find in all the rural sites of the world.
The aim of these measurements was to evaluate the radioelectrical power of the local emitters and to detect the possible non-linearity causes due to powerful local emitters.
Figure 7.1. View of the site of measurements: it is close to the Radome of Pleumeur Bodou which shelters the first antenna of telecommunication by satellite
The frequency bands analysis method is used. It consists of performing a frequency scan through the electromagnetic spectrum using a spectral analyzer. It allows us to examine and to display the signal spectral composition. The frequency band is shared between numerous applications such as land mobile and terrestrial broadcasting; land, air and maritime mobile telecommunications; television; amateur radio; radio astronomy; spatial research; remote sensing; mobile telephony; radar systems; Wi-Fi and Bluetooth links; etc.
7.2. Measurement set-up
A HP 85462A spectrum analyzer is used. The measured band ranges from 20 MHz to 3 GHz covering the high part of the HF, VHF and UHF bands. Three different antennas were used to cover these frequency bands: biconical, conical log spiral and double-ridged waveguide horn antennas. The aim here is to determine the occupied bandwidth in the electromagnetic spectrum on the Pleumeur Bodou site.
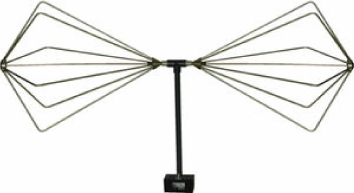
The biconical antenna (Figure 7.2) is a broadband dipole antenna, which consists of an arrangement of two conical conductors. The conductor has a common axis and vertex. It may be used in vertical or horizontal polarization. Its bandwidth ranges from 20 to 220 MHz (Biconical antenna, 2009). In the 100 MHz band, typically used by FM and broadcasting, the antenna factor is equal to 13 dB.
Figure 7.2. Biconical antenna
The conical log-spiral antenna consists of two coaxial feeders, always wrapped around in the same sense (Figure 7.3). On top of the cone, the central core and the wire braiding are reversed. One of the cable ends acts as a connector, while the other stays in the air. So the wire braiding of the coaxial cables acts as an illuminator. Polarization is circular in the same direction that the turns are wound. The “α” angle is weaker and the antenna back lobe is more attenuated. Progress of “e” distance is identical to that of a log periodical antenna: antennas for which impedance and radiation pattern are repetitive and follow a frequency logarithmic law. For α = 30°, the antenna power gain is close to 6 dBi. The bandwidth of the used antenna ranges from 200 MHz to 1 GHz (Conical Log Spiral antenna, 2009). In the 900 MHz band, typically used by the Global System for Mobile communications (GSM), the antenna factor is equal to 28 dB.
Figure 7.3. Conical log-spiral antenna
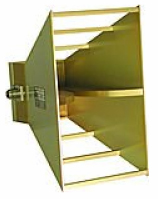
The double-ridged waveguide horn antenna (Figure 7.4) is a linear polarized broadband directional antenna covering the 1–18 GHz frequency band. According to its fixation, it can be used in vertical or horizontal polarization (Double-Ridged Waveguide Horn antenna, 2009). In the 2,200 MHz band, typically used by the Universal Mobile Telecommunications System (UMTS), the antenna factor is equal to 27 dB.
Figure 7.4. Double- ridged waveguide horn antenna
The different antennas are connected to the spectrum analyzer by a 10 m length RG 213 cable. Its attenuation is 1 dB. A printer linked to the spectrum analyzer provides a graphic display of the results.
7.3. Operating mode
The following functionalities of the spectrum analyzer have been selected:
– Bandwidth: the classical bandwidth for field measurements is equal to 120 kHz until 1 GHz and 1 MHz for upper frequency. Nevertheless we have used a 100 kHz bandwidth for frequencies greater than 1 GHz, for signal to noise ratio reasons. using a 1MHz bandwidth the signal to noise ratio would be 10 dB greater than using a 100 kHz bandwidth, and the very weak GPS signal will thus be drowned in the noise.
– Video bandwidth (VBW): the post detection pass band is fixed to 30 kHz. It results from a compromise between a good signal on noise ratio and the filtration of transitional signals.
– Mode: signal analysis.
– Attenuation: 0 dB. The internal preamplifier has been activated (gain: 20 dB) to improve the signal to noise ratio (PA: ON – see Figures 7.5, 7.6 and 7.7) despite harmonic distortion risks with the possible powerful signals, which fortunately were not detected. The noise factor is approximately equal to 16 dB, which is not as good as that of a portable telephone or a TV receiver.
– Noise level: -108 dBm.
– Ordinate scale: signal intensity (10 dBm per division).
– Observation: “max hold” (memorized transitional signal) or “clear write” (instantaneous observation).
Following the antenna type (biconical antenna, double ridge horn antenna), the two polarizations (vertical, horizontal) are taken into account. The conical log spiral antenna being circular polarized.
7.4. Different studies
Tree frequency bands were studied: 20–220 MHz, 220–1,200 MHz and 1–3 GHz band.
7.4.1. Study of the 20–220 MHz band
The spectrum analyzer was connected to the biconical antenna. Three different records were taken:
– The biconical antenna was placed in vertical polarization. It is omnidirectional.
– The biconical antenna was placed in horizontal polarization. It presents a privileged directivity axe. Two measurements were performed, the first pointed the directivity axis of the antenna in a North-South direction, the second pointed it in the East-West direction.
7.4.2. Study of the 200–1,200 MHz band
The spectrum analyzer was connected to the conical log spiral antenna. It is a very high directivity antenna. Four different recordings were taken for the four directions representing the cardinal points, directing the antenna in the East, North, West and South directions respectively.
7.4.3. Study of the 1–3 GHz band
The spectrum analyzer was connected to a double ridge horn antenna. Some measurements were taken in vertical polarization, by orientating the antenna in an easterly direction, in max hold and in clear write mode respectively. They showed that the 3–6.5 GHz band was not occupied, so later we conducted measurements only in the 1–3 GHz frequency band. The max hold (upper curve) and clear write (lower curve) mode were memorized afterwards on the same record. In clear write mode we have a frequency scan which records only permanent emitters, such as GSM (1,800 MHz) and UMTS (2,200 MHz); impulsive signals from radars are not very detectable. In max hold mode, frequency scans are memorized in 5 s; impulsive signals are captured and radars are detected. It is a good means of identify the different emitters. The antenna was successively oriented, for each polarization (vertical and horizontal) towards the four cardinal points. In vertical position, East-West and North-South directions used.
7.5. Measurements results
In each record showing radioelectrical power as a function of the frequency, different measurement characteristics were mentioned: date, hour, bandwidth, etc. We also showed the detected services: broadcasting, television, radioamator communications, aeronautical navigation, radar, etc. The radioelectrical power ranged from −40 to −120 dBm. The noise threshold was equal to −108 dBm. The following figures show examples of the recording and analysis of typical observed services in HF, VHF and UHF frequency bands (Figure 7.5, 7.6 and 7.7).
Figure 7.5. Radioelectrical power measurements in the following conditions: 20–220 MHz frequency band, biconical antenna, horizontal polarization, East-West direction
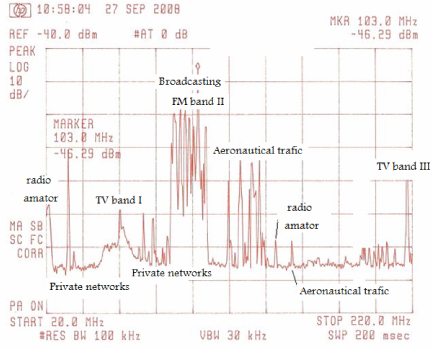
Figure 7.6. Radioelectrical power measurements in the following conditions: 200–1,200 MHz frequency band, conical log spiral antenna, circular polarization, South direction
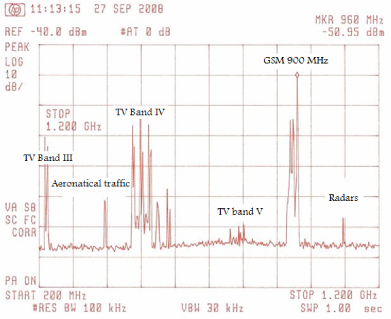
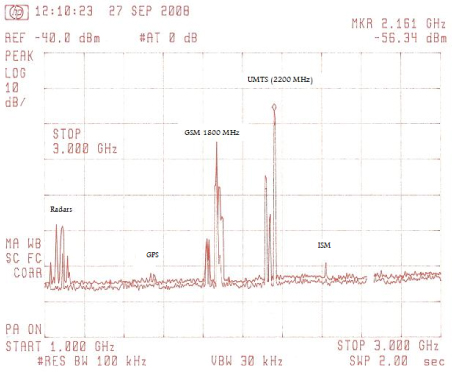
Figure 7.7. Radioelectrical power measurements in the following conditions: 1 – 3 GHz frequency band, double-ridged waveguide horn antenna, horizontal polarization, East direction
7.6. Electrical field strength
To compare the measurement radioelectrical power to electrical field strength limit values, in France and in the European Union, a conversion is made using the following relation:
![]()
where:
– E is the electric field strength (dB μV/m);
– P is the measured radioelectrical power (dBm);
– the conversion factor dBm/dB μV/m is 107, thus 0 dBm = 107 dB μV/m using a 50 Ohm resistance;
– L(dB) is a cable attenuation factor at the frequency of the measurements;
– Af(dB/m) is an antenna calibration factor to convert power (dBm) into radio electric field strength in dB μV/m for a 50 Ω matched antenna.
One example in each of the previously frequency bands is detailed in the following. It corresponds to the maximum power observed in each case: FM and broadcasting (100 MHz), GSM (900 MHz) and UMTS services (2,200 MHz).
a) FM and broadcasting service (100 MHz band)
In the FM and broadcasting frequency band the maximum received power at 100 MHz is equal to −46 dBm. The antenna calibration factor is equal to 13 dB at this frequency. Using the previous relation we have, for the electric field strength:
b) GSM (900 MHz)
In the GSM frequency band the maximum received power at 900 MHz is equal to −51 dBm. The antenna calibration factor is equal to 28 dB at this frequency. Using the previous procedure we have 17.8 mV/m at the receiver.
c) UMTS (2,200 MHz)
In the UMTS frequency band the maximum received power at 2,200 MHz is equal to -56 dBm. The antenna calibration factor is equal to 27 dB at this frequency. Using the previous procedure, we have 8.9 mV/m at the receiver.
Then these electrical field strengths close to the emitter are very weak compared to the legal limits values 41V/m generally accepted for the GSM service (41 V/m), in France and in the European Union.
7.7. Conclusion
Measurements taken in the 20 MHz – 3 GHz frequency band in a rural environment show that the spectrum is very clean outside frequency bands allocated to land, aeronautical and maritime radio communications and more particularly in frequency bands allocated to radio astronomy, spatial research, remote sensing, radio navigation, etc. They show that the site did not suffer from strong electromagnetic fields able to create non-linearity in our relevant frequency band. The electric fields are weak compared to standard limit values (41 V/m) legal in France and in the European Union.
7.8. Acknowledgements
These measurements were carried out by Philippe Maliet, Lucien Macé, Michel Dontenwille, André Gilloire and Hervé Sizun from “Pleumeur Bodou radioelectrical observation” association and were realized on the site belonging to the “Communauté d'Agglomération” from Lannion.
7.9. Bibliography
Biconical antenna, model 3104c, EMCO manufacturers: www.ets-lindgren.com, 2009.
Conical Log Spiral antenna, model 3101, EMCO manufacturers: www.ets-lindgren.com, 2009.
Double-Ridged Waveguide Horn antenna, model 3115, EMCO manufacturers: www.etslindgren.com, 2009.
1 Chapter written by Hervé SIZUN and Philippe MALIET.