Chapter 3
Meteorological Visibility Measurement:
Meteorological Optical Range1
3.1. Introduction
Meteorological visibility, the possibility of seeing at a given distance, is, in origin, a quantity estimated by a human observer using natural or man-built reference markers at a known distance from the observation point (water or church towers, buildings, hill, groups of trees, rocks, lights etc.): if the observer can distinctly distinguish the outlines of one of the landmarks on the sky background, the meteorological visibility is at least equal to the distance which separates it from the point of observation.
However, its estimation is influenced by many subjective (presence of markers, perception and eye discerning capacity, etc.) and physical factors (solid and water vapor concentration in the air, hydrometeors (rain, snow, mist, etc)).
The essential meteorological quantity, namely the transparency of the atmosphere, can be measured objectively and it is called the meteorological optical range (MOR) or runway visual range (RVR).
After some definitions of terms related to the meteorological optical range, the atmosphere composition (gases, aerosols) and its effects on the light propagation (absorption, scattering and extinction) are presented. Then the different measurement methods of the meteorological optic range (visual estimate and instrumental measurements) are described. Instruments to measure the meteorological optical range can be classified into two groups: those which measure the extinction coefficient (transmissometers) and those which measure the scattering coefficient (scatterometers). Location and implementation of those different instruments are then discussed. The different meteorological factors which influence the visibility (fog, mist, hydrometeors (rain, snow, etc), lithometeors (smoke, sand, dust), blizzard, etc.) are described.
Knowledge of visibility finds numerous applications in meteorology, aeronautics, telecommunications and road or maritime traffic security fields.
3.2. Definitions
In the atmosphere, the meteorological optical range or the runway visual range is the distance for which a beam of light, emanating from an incandescent lamp, at a temperature of 2,700 K, must cover so that the luminous flux intensity is reduced to 0.05 of its original value. The luminous flux is evaluated using the photometric luminosity function of the “commission internationale de l'éclairage” (CIE) — International Commission on Illumination. Day-time and night-time runway visual ranges are distinguished (OMM, 1989).
The daytime runway visual range is defined as the longest distance at which an appropriately sized black object, located in the vicinity of the ground, can be seen and identified when it is observed on a sky or on a fog scattering background.
The night time runway visual range is defined as the longest distance at which an appropriately sized black object can be seen and identified if general illumination is increased to normal daylight intensity, that is, the longest distance at which moderated intensity light sources can be seen and identified.
The luminous flux (symbol F (or Ф); unit: lumen, lm) is the perceived power of light. It is derived from radiant energy flux by calculating the radiation according to its action on the CIE standard photometric observer.
Luminous intensity (symbol: I; unit: candela, cd or lm.sr−1) is the luminous flux per unit solid angle.
Brightness (symbol: L; unit: cd.m−2) is the light intensity per unit area.
Luminance (luminosity) (symbol: E; unit: lux or lm.m−2) is the luminous intensity per unit area.
The extinction coefficient (symbol a) is the proportion of luminous flux that a beam of parallel luminous rays, emanating from an incandescent source, at a color temperature of 2,700 K, loses by crossing a length equal to unit distance in the atmosphere. This coefficient measures the attenuation due to both absorption and scattering.
The brightness contrast (symbol C) is the ratio of the difference between the marker brightness and its back-plan to the brightness of this back-plan.
The threshold contrast (ε) is the minimal value of the brightness contrast that the human eye can detect, e.g. the value which allows an object to be distinguished from the background. The threshold contrast varies according to the observer. In practice, the CIE (CIE, 1987) adopted a threshold contrast of 0.05.
The transmission factor (T) is defined, for a beam of light, emanating from an incandescent source, at a temperature of 2,700 K, as the fraction of the luminous flux that remains in the beam at the end of a given distance of optical trajectory in the atmosphere. The transmission factor is also called the transmission coefficient. When the path length is well defined, as for transmissometers, the terms transmittance or transmissive capacity of the atmosphere are used. In this case, T is often multiplied by 100 and is expressed as a percentage.
3.3. Atmospheric composition
In order to characterize the properties of atmospheric transmission affecting optronic systems (absorption, scattering, extinction), it is necessary to know the composition of the atmosphere in which propagate free space optical waves (gases and aerosols).
3.3.1. Gaseous composition
The atmosphere gas components are classified into two categories:
– Components with a fixed density proportion or majority components (their variation is smaller than 1%). They have a quasi-uniform distribution for altitudes ranging between 15 and 20 km. The most important among these constituents are nitrogen (N2), oxygen (O2), argon (Ar) and carbon dioxide (CO2). In the visible and infrared regions, up to a wavelength of 15μm, CO2 gives the only important absorption lines.
– Components with a variable density, are a minority and their concentration depends on geographical location (latitude, altitude), on environment (continental or maritime) and on weather conditions.
Water vapor is the main variable constituent of the atmosphere. Its concentration depends on climatic and meteorological parameters. While water vapor concentration may reach 2% in maritime environments, its presence is negligible at altitudes higher than 20 km.
The water content is determined from the atmospheric humidity and can be defined in three different ways:
– absolute humidity (g/m3) gives the mass of water vapor per unit air volume;
– relative humidity (%) can be defined as the ratio between the absolute humidity and the maximum quantity of vapor that could be contained in the air at the same temperature and at the same pressure;
– number of mm of precipitable water (w0) per unit distance, usually per km.
Another major variable component is ozone (O3) whose concentration also varies with altitude (maximum content at 25 km), latitude and season. It presents an important absorption band in ultraviolet, and in the infrared region around the 0.6 μm wavelength.
3.3.2. Aerosols
Aerosols are extremely fine particles (solid or liquid) suspended in the atmosphere with a very low fall speed caused by gravity. Their size generally lies between 0.01 μm and 100 μm. Due to the action of terrestrial gravity, the biggest particles (r > 0.2 μm) are in the vicinity of the ground. Fog and mist are liquid aerosols, salt crystals and sand grains are solid aerosols.
The presence of aerosols may cause severe disturbance to the propagation of optical and infrared waves, since their dimensions are very close to the wavelength propagation. This is not the case for centimeter and millimeter waves where the wavelength is much longer than the size of the aerosols.
3.4. Atmospheric effects on light propagation
To introduce the effects of the atmosphere on light propagation it is necessary to define some optical phenomena: absorption, scattering and extinction.
3.4.1. Atmospheric absorption
Atmospheric absorption results from interaction between the photons of the radiation and the atoms or molecules of the medium, which leads to:
– incident photon disappearance;
– increased temperature;
– radiative emission proportional to that of the equivalent black body at the achieved temperature.
Let us consider a light beam of wavelength λ which passes through an absorbing medium of thickness dx.
Due to the absorbent properties of the medium, the number of photons in the radiation is reduced throughout the length of its path. The intensity of the radiation, measured at x + dx (Figure 3.1), in relation to the intensity measured at x, is written as:
![]()
Figure 3.1. Absorption of light by an absorbing medium of thickness dx
The quantity dIa (λ, x) corresponds to the intensity of the light absorbed by the absorbing medium. This quantity is proportional to the incident intensity I(λ, x) , to the thickness dx and to the spectral parameter which represents the absorption of the medium α(λ, x) at this wavelength:
![]()
From these two equations and for a thickness path X, we have:
![]()
The spectral transmission of the medium is then defined:
![]()
If the propagation medium is homogenous, the absorption coefficient α(λ, x) will be independent of x and the medium spectral transmission is written in the following form:
![]()
3.4.2. Atmospheric scattering
Atmospheric scattering results from the interaction of a part of the light with the atoms and/or the molecules in the propagation medium, which causes an angular redistribution of this part of the radiation with or without modification of the wavelength. To calculate the transmission of a scattering medium we proceed from the preceding section to write:
![]()
where β(λ, x) is the specific spectral scattering coefficient.
If the medium scatters at the same wavelength as the incident radiation, we have Rayleigh and Mie scattering, otherwise we have Raman scattering.
Figure 3.2. Scattering indicatrix
In the case of scattering, scattered light does not disappear locally as with absorption. A scattering medium is characterized by the scattering indicatrix dL(θ) (Figure 3.2) which describes the spatial distribution of the light scattered per unit of volume. It has symmetry of revolution around the direction of the incident light and it is commonly known as the “phase function”.
3.4.3. Extinction and total spectral transmission
If the propagation medium is both an absorbing and a scattering medium; extinction occurs. The extinction coefficient γ(λ, x) is defined as the following:
![]()
The total spectral transmission relation is then written:
![]()
3.5. Units and scales
The meteorological visibility or meteorological optical range is expressed in meters or kilometers or occasionally from a scale quoted from 0 to 9 according to the visibility limit distance (Table 3.1). Its measurement range varies according to applications.
Table 3.1. Visibility code according to distance
| Scale number | visibility limit distance |
| 0 | 50 m |
| 1 | 200 m |
| 2 | 500 m |
| 3 | 1 km |
| 4 | 2 km |
| 5 | 4 km |
| 6 | 10 km |
| 7 | 20 km |
| 8 | 50 km |
| 9 | > 50 km |
If, as for the synoptic meteorology requirements, the measured scale extends from less than 100 meters to more than 70 km, the measurements range could be more restricted for other applications.
This is the case for civil aviation in particular, as the upper limit can be 10 km. This range can still be reduced further when considering the runway visual range representing the landing and takeoff conditions in reduced visibility. The runway visual range is only requested between 50 m and 1,500 m. For other applications, such as the road or maritime traffic, limits can still differ depending on needs and locations.
3.6. Measurement methods
Meteorological visibility is a complex psychophysical phenomenon, given mainly by the atmospheric extinction coefficient associated with solid and liquid particles in suspension in the atmosphere: this extinction is primarily caused by scattering rather than by the absorption of the light. The estimate of visibility is subject to variations in perception and interpretation in people as well as the characteristics of light sources and the transmission factor. So any visual estimation of meteorological visibility is subjective.
Human observations of visibility depend not only on the photometric and dimensional characteristics of the object which is, or should be, perceived, but also on the contrast threshold specific to the observer. At night, it depends on the intensity of the light source, on the back-plan illumination and, if the estimate is made by an observer, on the ability of the eye of the observer to adapt to the darkness, and on the illumination threshold specific to the observer.
The extinction coefficient can be measured using instrumental methods, and the meteorological optical range can be calculated from this. Meteorological visibility is then calculated from the known values of the thresholds contrast and illumination, or by allocating agreed values to these elements.
3.6.1. Visual estimation of the meteorological optical range
Visual estimates of the meteorological optical range can be carried out by a meteorological observer using natural or man-built reference markers (a group of trees, rocks, towers, bell-towers, churches, lights, etc). In each station, it is advisable to draw up a plan of the reference markers used for the observations by indicating the distance and orientation of each reference marker compared to the observer. This plan must include reference markers appropriate for diurnal and night observations. The observer will also have to give detailed attention to the significant variations of the meteorological optical range with direction.
The observers must have normal vision and be suitably involved. The observations are made without the assistance of optical apparatus (binoculars, telescopes, theodolites, etc.) and not through a window. The observer's eye must be at normal height above ground-level (approximately 1.5 m). Measurements of visibility should thus not be taken from the higher levels of control towers or from any other high building. This is the more important when the visibility is bad.
When the visibility varies according to the direction of observation, the recorded value can depend on the use for which it is intended. In synoptic messages, the value to be indicated is the lowest value but for reports intended for aviation, it is advisable to follow directives given in publication OMM-no.731 (OMM, 1990).
For diurnal observations, visual estimates of visibility give a good approximation to the true value of the meteorological optical range. For these diurnal observations, one must choose, as reference markers, objects located at as great a number of different distances as possible, provided that they are black or almost black and that they are detached on the sky above the horizon. We will thus eliminate, as far as possible, the objects of clear color or close to a terrestrial backplan. This is particularly important when the sun illuminates the object. A white house is consequently a bad reference marker and a clump of trees a good reference marker, except when it is brilliantly illuminated by the sun.
For night time observations, well defined and known light sources must be used (distance, intensity, mechanical stability). It is advisable to distinguish the isolated sources from the grouped sources, even when they are distinct from each other.
Observation of luminous reference markers at night can be appreciably affected by the luminous environment, the physiological effects of dazzling and parasitic lights, even those located out of the field of vision, especially when the observation is made through a window. Thus, a true and accurate observation can be carried out only from a dark place, suitably chosen and located outside any room.
In certain places (airplanes, ships, etc.) or because of a restricted horizon (valley or cirque) or in the absence of adapted landmarks, it is impossible to make observations, except for low values of visibility. For such cases, unless it is not possible to carry out instrumental measurements, it is necessary to estimate the values of the meteorological optical range higher than those for which we have markers from the general transparency of the atmosphere. This can be done by noting the clearness with which the most distant landmarks are detached. Clear contours in the relief, with little or no fuzziness in the colors, indicate that the meteorological optical range is higher than the distance between the landmark and the observer. On the other hand, vague or indistinct landmarks indicate the presence of fog or other phenomena which reduce the meteorological optical range.
3.6.2. Meteorological optical range measurement instruments
Instruments to measure the meteorological optical range can be classified into two groups:
– those which measure the extinction coefficient or the transmission factor in a horizontal cylindrical tube of air, the attenuation of light is then due to scattering and absorption by the air particles along the light beam path (transmissometers);
– those which measure the scattering coefficient of the light in a small volume of air (scatterometers).
These instruments use a light source and an electronic device including a photoelectrical cell or a photodiode to detect the emitted light beam.
Differences between transmissometers and scatterometers have been reported in the literature (van der Meulen, 1992). Based on intercomparison results between a transmissometer and a scatterometer, the performance of both systems is very similar for MOR les than 5 km. In most cases with MOR greater than 3 km, the transmissometer displays a MOR which is about 20% lower than what is displayed by a scaterrometer and reported by a human observer.
Innovative technical approaches to measure visibility similar to that of a human observer for terrestrial applications uses digital camera visibility sensor. Such systems are able to produce consistent and accurate visibility estimates over a wide field and long distances by mimicking the photonic and scotopic vision of a human observer (Caimi, 2004). Quantitative measures of visibility from digital images in an automated fashion are derived from image processing techniques, such as image contrast in the spatial domain or spectral energy in the frequency domain (Xie, 2008). After we have presented a review of different optical sensors likely to measure the visibility distance, Hautière et al. (2006a, b, c) present a stereovisionbased technique to measure the visibility distance. The method combines the computation of both a depth map of the vehicle environment and the computation of local contrast above 5%.
3.6.2.1. Transmissometers
The transmissometric method is usually used to measure the average extinction coefficient in a horizontal air cylinder placed between a transmitter consisting of a constant and modulated flux light source and a receiver equipped with a photo detector (generally a photodiode located at a parabolic mirror or the focal point of a lens). The most frequently used light source is a halogen-type lamp or a tube with luminous discharge in xenon. The modulation of these light sources avoids the influence of parasitic solar light. The current from the photo detector determines the transmission factor that allows calculation of the extinction coefficient and the meteorological optical range.
There are two types of transmissometers:
– those where the transmitter and receiver are placed in different cases and placed at a known distance from each other (Figure 3.3);
– those where the transmitter and receiver are placed in the same case, the emitted light is reflected by a remotely placed mirror or back reflector (Figure 3.4).
Figure 3.3. Direct beam transmissometers
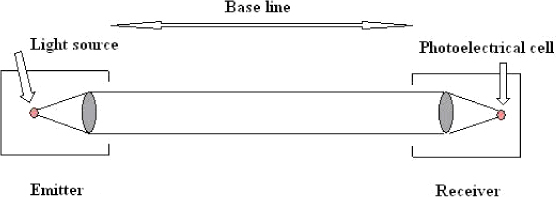
Figure 3.4. Reflected beam transmissometer
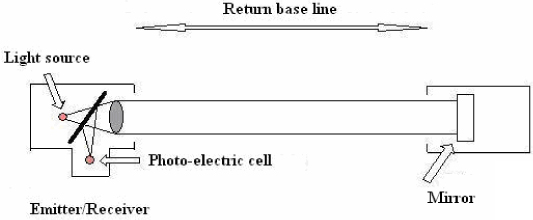
The distance (L) covered by the light between the transmitter and the receiver is commonly called the “transmissometer base” and can vary from a few meters up to 300 m.
These systems, based on Koschmieder's law (see section 3.9. Appendix), provide generally the following data:
– The transmissive capacity of the atmosphere (TCA) in percentage (%), is the capacity of the atmosphere to transmit the light on the transmitter-receiver distance.
– The meteorological optical range (MOR) in meters is the distance that a parallel luminous ray beam, emanating from an incandescent lamp, at a color temperature of 2,700 K, must cover so that the luminous flux intensity is reduced to 0.05 of its original value. It is deduced from the transmissive capacity of the atmosphere from the following relation:
![]()
– The outside temperature (°c).
– The salient percentage on emitter and receiver lens affecting the evaluation of the transmissive capacity of the atmosphere.
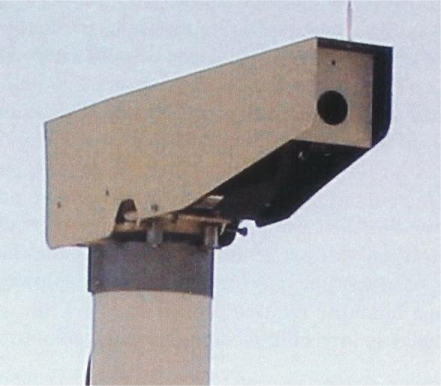
Figure 3.5 shows the emission part of a transmissometer, installed on the La Turbie site during the following experimentation: fog effects on optical, visible and infrared waves propagation in the atmosphere.
Figure 3.5. Emission part of a transmissometer installed on the La Turbie site, France
In order to ensure measurements remain valid over a long period, it is necessary for the luminous flux to remain constant during this time. In the case of a halogen light, flux remains constant much longer because halogen lamps only deteriorate slowly and maintain a constant flux for long periods. Nevertheless, some transmissometers use feedback devices (collecting and measuring a small part of emitted flux) which ensure a greater homogenity of luminous flux in the time or compensate for any modification.
An alternative way of taking measurements with a transmissometer consists of using two receivers or back-reflectors placed at different distances in order to widen the measured range of the meteorological optical range, both towards the bottom of the range (short base) and towards the top of the range (long base). These instruments are therefore called two-base transmissometers.
For very short base cases (a few meters), we can use a near infrared monochromatic light (electroluminescent diodes). However, it is preferable to use a polychromatic light in the visible range, in order to obtain a representative coefficient of extinction.
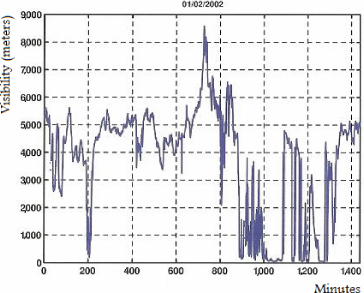
Figures 3.6 and 3.7 give examples of meteorological optical range variations observed at La Turbie during, respectively, a high visibility day (up to 50 km) and during a very weak visibility day (up to 10 m) due to fog.
Figure 3.6. Meteorological optical range variation observed on 25 March 2002 at La Turbie (France) during a high visibility day (clear air)
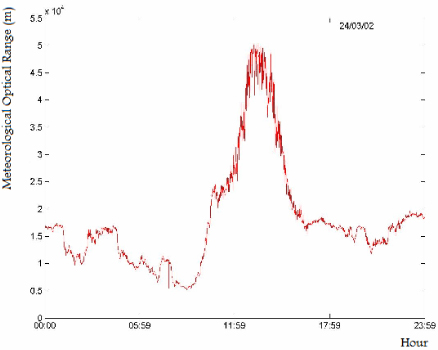
Figure 3.7. Meteorological optical range variation observed on 1 February 2002 at La Turbie (France) during a low visibility day (fog)
3.6.2.2. Scatterometers
Atmospheric light attenuation is due both to scattering and absorption. The absorption factor is important in the presence of pollution in the vicinity of industrial parks, crystals of ice (freezing fog) or dust. However, the absorption factor is usually negligible, and scattering, due to reflection, refraction and diffraction on the water droplets, constitutes the principal factor of visibility reduction. The extinction coefficient can therefore be regarded as equal to the scattering coefficient, and an instrument to measure this scattering coefficient can thus be used to estimate the meteorological optical range.
The most practical methods for making this measurement consist of concentrating a light beam on a small volume of air and determining, by photometric means, the proportion of light scattered in a sufficiently large solid angle and not in specific directions. Provided that it is completely protected from other sources of light, such an instrument can be used during both day and night. It is necessary to measure and to integrate the light scattered by the beam for all angles to precisely determine the scattering coefficient. The instruments used in practice measure the light scattered in a limited angle and a high correlation between the limited integral and the complete integral is assumed.
Three types of measurement are used in these instruments: backscatter, forward scatter and scattering integrated on an important angle.
Backscatter (Figure 3.8): the beam of light is concentrated on a small volume of air; it is backscattered and collected by the photoelectric cell.
Forward scatter: the instruments consist of a transmitter and a receiver whose emission and reception beams form between them an angle between 20° and 50° (Figure 3.9). Other devices place a diaphragm halfway between the transmitter and the receiver, or two diaphragms placed close to the transmitter and the receiver.
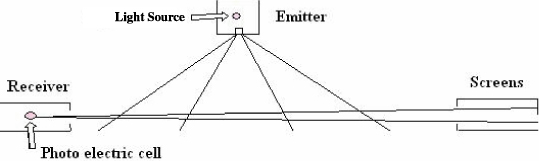
Scattering under a large angle: the instruments, called integrating nephelometers, use the principle of measuring scattering for as large an angle as possible, ideally from 0° to 180°, but in practice from 0° to 120°. The receiver is placed perpendicular to the light source axis emitting a light over a large angle. In fact, these integrating nephelometers are not used very often to measure the meteorological optical range but they are frequently used for air pollution measurements (Figure 3.10).
Figure 3.8. Schematic representation of the measurement of backscatter visibility
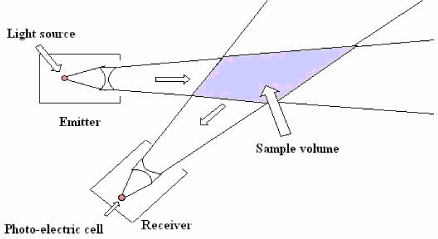
Figure 3.9. Schematic representation of the measurement of forward scatter visibility
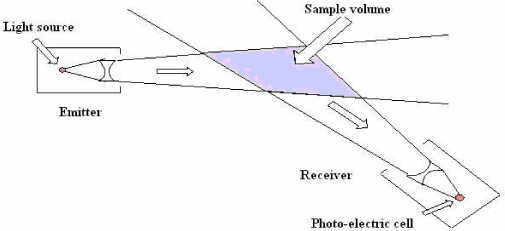
Figure 3.10. Schematic representation of an integrating nephelometer
These instruments require only a limited space (generally one to two meters). They are thus very useful when there is no source of light or marker points (ships, roadsides, etc.). For measurements relating to only a very low volume of air, the representativeness compared to the general state of the atmosphere on the site is questionable. However, an average over a number of samples or measurements can improve this representativeness.
The use of this type of instrument is often limited to particular applications such as the measurement of visibility on motorways or the detection of the presence of fog. The current tendency is to use them increasingly in automatic meteorological observation systems because they allow the measurement of the meteorological optical range over a wide range, and are much less affected by pollution than transmissometers.
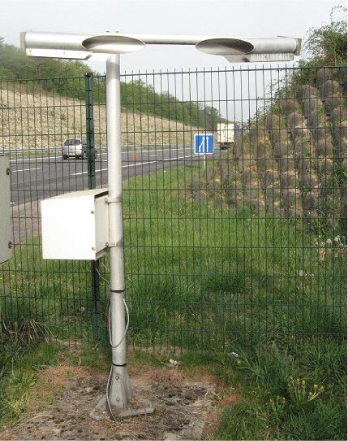
Figure 3.11 shows a photo of a scatterometer implemented on a motorway area to measure the fog density and to announce to motorists the atmospheric visibility.
Figure 3.11. Example of a scatterometer implemented on the edge of a freeway
3.6.3. Exposure and implantation of instruments
The sites of the measuring instruments must be suitably selected. For general synoptic needs, the apparatus should be installed on sites sheltered from local air pollution (smoke, industrial pollution, dusty roads, etc). The sampled volume of air must be at the observer's eye level i.e. approximately 1.5 m above ground level.
Transmissometers and materials used to measure the scattering coefficient must be installed in such a way that the sun is not, at any time of the day, in the field of view. Normally, the optical axis is directed horizontally in the north-south direction (+/− 45°) or a system of screens or baffles is used for latitudes lower than 50°.
The supports on which transmitters and receivers are used must have good mechanical rigidity in order to avoid any misalignment due to the movement of the ground due to freezing and thawing. The supports should not become deformed due to the thermal stresses to which they are subjected.
3.7. Visibility perturbation factors
The visibility relevant to the air transparency is independent of the presence of light. In very clear air (in arctic or mountainous regions more particularly), visibility can attain 70 km, or even 100 km. Due to atmospheric pollution and strong humidity, it is often reduced. The main elements which reduce visibility are principally mist, fog, smokes more particularly during forest fires, deserts sand or dusts tempests, dusts, blizzard, snow, etc.
Fog and mist are due to the presence of fine water droplets (with diameters lower than 100 μm) in the atmospheric layer in contact with the ground. These droplets form when the moist air is cooled below its dew point: the air becomes saturated and the water vapor contained in the air condenses in the form of fine water droplets.
According to the international definition, fog occurs when the horizontal visibility is reduced below one kilometer and when humidity is close or equal to 100%. Visibility is determined by the maximum distance beyond which a prominent object can no longer be seen and identified by unaided, normal eyes, and is measured using either a transmissometer or a scatterometer. The visibility reduction depends on the nature of the fog, on the volume concentration and on the size distribution of the droplets. Fog appears in the form of a white uniform film. It can move in the form of benches with variable sizes, more or less spaced and more or less mobile. While its formation may be very fast, its dissipation is sometimes slow.
Fogs are classified according to the physical process whereby water vapor is condensed (radiation, advection, upslope, evaporation and mixing fog):
– Radiation fog is generated by the radiative cooling of an air mass during the night. It forms when the surface releases the heat that it has accumulated during the day and becomes colder: the air in contact with this surface is cooled below the dew point, causing the condensation of water vapor, which results in the formation of a ground level cloud. This type of fog occurs in valleys particularly.
– Advection fog is generated when the warm, moist air flows over a colder surface. The air in contact with the surface is cooled below its dew point, causing the condensation of water vapor. Sea fog in coastal areas is a form of advection fog, formed when warmer sea air flows over colder land. This type of fog appears more particularly in spring when southern displacements of warm, moist air masses move over snow covered regions.
– Upslope fog is formed when moist air is lifted by the westward side of hills, mountain slopes or elevated plains: as it ascends up the slope, the air expands and is cooled below its dew points.
– Evaporation fog is due to an increase of the water vapor contained in a cold air mass. It forms more frequently in autumn and in winter, when the cold air flows over a relatively warmer surface, for instance a lake or a pond, this causes an evaporation of water, resulting in an increase of the dew point value. This type of fog generally appears in the form of smoking columns.
– Mixing fog results from the cooling of a warmer air mass by mixing with a colder air mass. Different conditions must, however, be fulfilled in order for such a fog to be generated, including an important difference in temperature and a high degree of mixing of the two air masses and a high humidity. This type of fog is generally not very dense and appears mostly in the form of mist.
Humid fog is a light mist, the visibility ranges from 1,000 to 5,000 m and humidity exceeds 90%. It occurs in very hot and moist days. Air seems less transparent.
Dry fog is a type of light which instead of being composed of water droplets is formed by dust particles.
Smoke is a cloud of solid particles issued from a fire. These particles are in most cases some soot (particles of carbon in suspension in air) as well as cinders. These particles are mixed with gases of combustion and hot vapors.
Wind-blown sand storm is a current meteorological phenomenon in large plains or in deserts. Violent winds cause deflation and transport of sand particles by suspension of fine sands or by “saltation” (displacements by successive bounds of more important size particles flown by air) in the atmosphere, reducing visibility.
Dust storms occur essentially above large zones when turbulent and violent winds forcefully raise particles of dust. This phenomenon occurs in dryness period in a zone where the arable earth provides very fine particles of dust.
Blizzard indicates conditions of weak visibility (less than 1,500 m) during extended and powerful snowstorm combining low temperatures and very strong winds loaded with snowflakes. It occurs more particularly in North America (Northern of the United States, Canada)
Precipitations are hydrometeors consisting of liquid or solid water particles. They can take several forms: drizzle, rain, snow, ice pellet, hail, etc.
Drizzle is a uniform precipitation made of small water droplets, with diameters between 0.2 and 0.5 mm.
Rain is a liquid water precipitation; the droplets diameter lie between 0.5 and 6 mm. It can be uninterrupted or occur in the form of showers.
Snow falls in the form of light white flakes or ice crystal aggregates. Although the diameter of these flakes generally lies between 2 and 5 mm, it may in some cases reach 15 mm. Snow can be uninterrupted or occur in form of showers.
Snow-grain is a precipitation of small white and opaque grains of ice which are relatively flat or lengthened and that does not rebound or almost does not burst when they attain a hard soil. Their diameter is generally less than 1 mm.
Ice pellets are a form of precipitation consisting of small transparent or translucent ice particles of small dimension (less than 5 mm).
Hail is a precipitation of globules or pieces of hard and partly transparent ice (hailstones); their diameter lies in general between 5 and 50 mm.
The international code of visibility (Kim, 1998), giving visibility distance and visible optical wave attenuation (in dB/km) for different meteorological conditions (from very clear air to dense fog through the different hydrometeors (drizzle, rain, snow, etc.) is displayed in Table 3.2.
Table 3.2. International code of visibility
3.8. Applications
The knowledge of visibility finds numerous applications in meteorology (identification of a mass of air for synoptic meteorology and climatology aims): in aeronautics, runway visual range determination; in telecommunications, evaluation of atmospheric particles effects (fog, aerosols) on optical, visible and near infrared transmission until 2.5 μm (Cojan, 1995), free space optic ranges determination in presence of fog more particularly; and in terrestrial or maritime traffic security, measurement of visibility in fog.
3.8.1. Meteorology applications
Meteorological optical range was officially adopted by OMM as the measure of visibility for general and aeronautic usage (OMM, 1990). MOR is linked to the intuitive concept of visibility through the contrast threshold. It is generally admitted that, when an observer can just see and acknowledge a black object on the skyline, the visible contrast of the object is then 0.05. A transmission factor (transmissive capacity of the atmosphere) equal to 0.05 is then adopted in the MOR definition.
The concept of visibility is used in meteorology under two main aspects:
– It allows identification of the characteristics of a mass of air for synoptic meteorology and climatology aims. It must be then representative of the atmosphere optic state.
– It expresses the distance at which it is possible to see landmarks or given lights. It finds a more specific application in aeronautics (see section 3.8.2).
3.8.2. Aeronautic applications
The measurement systems used are principally transmissometers and scatterometers, indicated sometimes under the generic term of visibilimeter. They are used to determine the runway visual range (RVR) which is defined as the distance over which an airplane pilot on the centerline of the runway can see the runway surface markings delineating the runway or identifying its centre line (OACI, 2005). RVR is normally expressed in feet or meters. The 0.05 value is generally taken for the contrast threshold. For a pilot, the contrast of an object (runway surface markings) in comparison with the neighboring ground is much less than that of an object against the skyline (contrast threshold equal to 0.02).
They are established either before the start, at the middle or after the end of the runway according to precision requirements in RVR terms for takeoff or landing operations (ITAC, 2001):
– At the start of runways a visibilimeter is recommended for precision approaches in regular commercial traffic cases. Sensors are generally laterally installed at a distance between 120 and 170 m from the runway axe to respect aicraft and radioelectrical servitudes.
– The halfway visibilimeter is in general installed between 1,000 and 1,800 m of the start of the runway at a distance between 120 and 170 m from the runway axe. For runways used in both directions, only one visibilimeter can be installed towards the middle of the runway.
– At the end of runways, the visibilimeter is used for weak visibility takeoff.
Sensors must be put at a height of 2.5 m above the runway level. They must be established in such a way as to reduce the risks of incompatibility of VHF omnidirectional range (VOR) and instrument landing systems (ILS).
3.8.3. Free space optic telecommunications applications
The notion of visibility finds new applications in free space optic telecommunications (Bouchet, 2006). Free space optic links (FSO) are point-to-point links able to offer high bit rates (until several Gbits/s) at a short distance (up to 4 km in clear air). They request a direct visibility between the transmitter and the receiver; then transceiver systems are installed on the roofs of buildings. This technology uses optic beams in the range of the visible and infrared waves. Inexpensive, very flexible and easy to deploy, it suffers nevertheless in the presence of the fog which produces high attenuation on the signal intensity. They are particularly adapted to local wireless networks linking different close buildings.
An experimental comparison of three atmospheric transparency windows (800 nm, 1,600 nm and 10 μm) upon scattering attenuation from haze and fog is also reported in the literature (Colvero, 2005). Their results show that a 10 μm window is considerably better than the 1,600 and 800 nm windows in dense and thick upslope fog conditions.
Designing and using a free space optic link in free atmosphere requires knowledge of the optic propriety of the atmosphere. The stability and quality of the link is highly dependent on atmospheric factors such as rain, fog, dust and heat. The knowledge of the visibility characterized by the meteorological optical range allows quantifying the atmospheric particle effects (fog, aerosols) on optical, visible and near infrared transmission links until 2.5 μm (Cojan, 1995) and determining ranges and availabilities of free space optical (FSO) links in the presence of fog (Alnaboulsi, 2004; 2005).
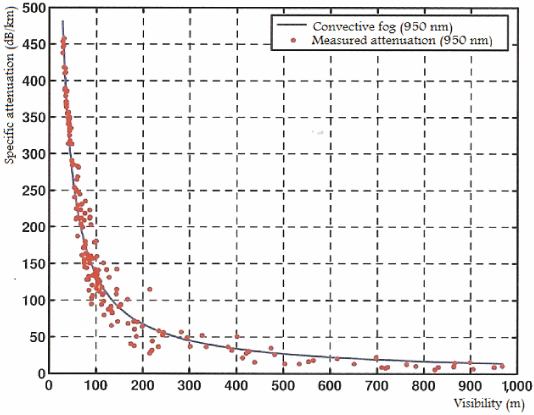
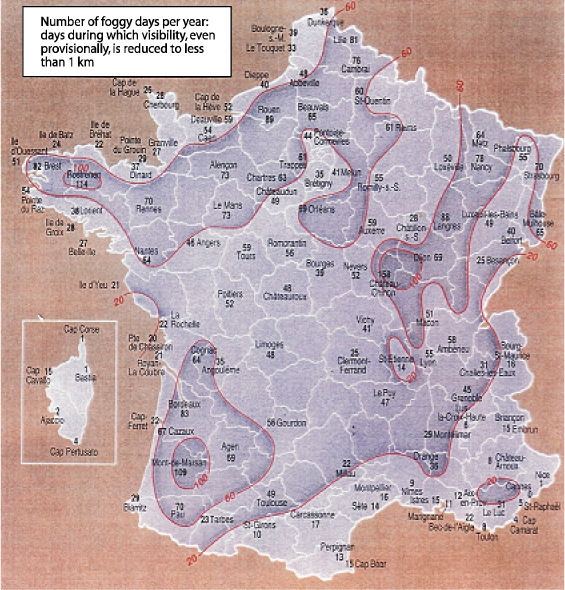
Figure 3.12 shows the attenuation variation measured on a 950 nm link as a function of the visibility (Alnaboulsi, 2005). The influence of fog on free space optic links and channel modeling for terrestrial free space optical links have recently intensively been studied. Many references are found in the literature: (Coldero, 2005), (Leitgeb, 2006), (Muhammad, 2007), (Alnaboulsi, 2008), etc. Figure 3.13 shows France's repartition of the number of days with fog, days during which the visibility, even provisionally, is reduced to less than 1 km.
Figure 3.12. Attenuation variation measured on a 950 nm link in function of the visibility
3.8.4. Automative safety applications
Numerous systems (scatterometers more particularly) measure the fog intensity and announce the distance of visibility to motorists through signaling panels. Shaded meteorological conditions (rain, fog) reduce the distance of visibility of drivers. This reduction of visibility is the source of accidents. To improve the road safety, numerous researches move toward the detection of the visibility conditions and the visibility distance estimation using an onboard camera. This consists of searching the most distant object that has a contrast of at least 5% using the picture segmentation technology of Köhler (Hautière, 2006d). Two applications resulting in driving aids are envisaged (Hautière, 2005, 2006e, 2007):
– The first consists of determining the speed adapted to meteorological conditions in order to indicate to the driver, if necessary, that its speed is too high, or even to limit it automatically.
– The second consists of dynamically quantifying the onboard exteroceptive sensors and telling the driver that his assistance system is momentarily inoperative during poor meteorological conditions.
Number of foggy days per year: days during which visibility, even provisionally. Is reduced to less than 1 km
Figure 3.13. Repartition of the number of days with fog in France, days during which the visibility, even provisionally, is reduced to less than 1 kilometer
3.9. Appendix — optical contrast and Koschmieder's law
Let us consider a black and white target (see Figure 3.14).
Figure 3.14. Example of black and white target used to measure the optic contrast

At a distance z from the target, the visible contrast is defined from the visible intensity of both parts (Ib (z) for the black part and Iw (z) for the white part) by the following relation:
![]()
Iw (z) is very distinctly greater than Ib (z), the contrast has a value greater than 1. At z=0 the contrast equation is
![]()
where C(0) is the intrinsic contrast of the object on its background.
Thus:
![]()
The intensity of the black part being negligible comparatively to the intensity of the white party, resulting in the following relation:
![]()
where k is the atmospheric extinction coefficient.
From the definition of visibility (V), if the ratio C (z) / C (0) is equal to 0.05 (value of the contrast threshold), then the distance z is equal to V.
It results that the visibility distance V is the given by the following relation:
![]()
This visibility distance or meteorological optical range is the translation of a physical parameter of the atmosphere in term of distance: its transparency characterized by it extinction coefficient.
3.10. Glossary
AV: Aeronautical Visibility
CIE: Commission Internationale de l'Eclairage
FSO Free Space Optic
ILS Instrument Landing Systems
ITA Instruction technique sur les Aérodromes Civils
MOR Meteorological Optical Range
OACI Organisation de l'Aviation Civile Internationale
OMM Organisation Météorologique Mondiale
PTA Pouvoir Transmissif Atmosphérique
RVR Runway Visual Range
TAA Transmission Ability of the Atmosphere
VOR VHF Omnidirectional Range
3.11. Bibliography
Alnaboulsi M., Sizun H., de Fornel F., “Fog attenuation prediction for optical and infrared waves”, Opt. Eng., vol. 43, no. 2, pp. 319–329, 2004.
Alnaboulsi M., Contribution à l'étude des liaisons optiques atmosphériques: propagation, disponibilité et fiabilité, PhD thesis, Bourgogne University, 2005.
Alnaboulsi M., de Fornel F., Sizun H., Gebbart M., Leitgeb E., Muhammad S.S., Flecker B., Chlestil C., “Measured and predicted light attenaution in dense coastal upslope fog at 650, 850 and 950 nm for free-space optics applications”, Opt. Eng., vol 47, 036001, 2008.
Bouchet O., Sizun H., Boisrobert C., de Fornel F., Favennec P.N., Free Space Optics: Propagation and Communication, ISTE, 2006
Caimi F.M., Kocak D.M., Justak J., “Remote visibility measurement technique using objet plane data from digital image sensors”, Proceedings of the 2004 IEEE International Geoscience and Remote Sensing Symposium, IGARSS, vol. 5, nos. 20–24 pp.3288–3291, September 2004.
CIE — Commission internationale de l'éclairage, Vocabulaire électrotechnique international, chapitre 845: Eclairage CIE50, 1987.
Cojan Y., Fontanella J.C., Propagation du rayonnement dans l'atmosphère, Technique de l'Ingénieur, traité électronique, 1995.
Coldero C.P., Cordeiro M.C.R., de Faria G.V., Von der Weid J.P., “Experimental comparison between far and near infrared wavelengths in free space optical systems”, Microwave and optical technology letters, vol. 46, no.4, 2005.
Kim I.I., Woodbridge E., Chan V., Strickland B.R., “Scintillation measurements performed during the limited-visibility lasercom experiment”, SPIE, vol. 3232, 1998.
Hautière N., Aubert D., Jourlin M., Détection des conditions de visibilité et estimation de la distance de visibilité par vision embarquée, MajecSTIC, Rennes, France, 2005.
Hautière N., Labayrade R., Aubert D., “Estimation of the visibility distance by stereovision : a generic approach”, IEICE Transactions on Information and Systems, vol. E89-D, no. 7, pp. 2084–2091, 2006a.
Hautière N., Tarel J.P., Lavenat J., Aubert D., “Automatic fog detection and estimation of visibility distance through use of an onboard camera”, Machine Vision and Applications, vol. 17, no. 1, pp. 8–20, 2006b.
Hautière N., Labayrade R., Aubert D., “Real-time disparity contrast combination for onboard estimation of the visibility distance”, IEEE Transactions on Intelligent Transportation Systems, vol. 7, no. 2, pp. 201–212, 2006c.
Hautière N., Aubert D., Jourlin M., “Mesure du contraste local dans les images. Application à la mesure de la distance de visibilité par caméra embarquée”, Traitement du signal, vol. 23, no. 2, pp 145–158, 2006d.
Hautière N., Labayrade R., Perrolaz M., Aubert D., “Road scene analysis by stereovision: a robust and qasi-dense approach”, 9th International Conference on Control, Automation, Robotics and Vision, pp. 1–6, 2006e.
Hautière N., Tarel J.P., Aubert D., “Towards fog-free in-vehicle vision systems through contrast restoration”, IEEE Conference on Computer Vision and Pattern Recognition, pp. 1–8, 17–22 June 2007.
ITAC, Les équipements météorologiques, chapitre 3, pp. 3–121, www.stac.aviationcivile. gouv.fr/publications/documents/itacpdf/itac3/itac324/324.pdf, 2001.
Leitgeg E., Muhammad S.S., Flecker B., Chlestil C. Gebbart M., Javornik T., “The influence of dense fog on wireless systems, analysed by measurements in Graz for improving the link reliability”, International Conference on Transparent Optical Networks, vol. 3, pp. 154–159, June 2006.
Muhammad S.S, Kohldorfer P., Leitgeb E., “Channel modeling for terrestrial free space optical links”, 7th International Conference on Transparent Optical Networks, vol. 1, pp. 407–410, July 2005.
Muhammad S.S, Flecker B., Leitgeb E, Gebbart M., “Characterization of fog attenuation in terrestrial free space optical links”, Opt. Eng., vol. 46, 066001, 2007.
OACI, Manuel des méthodes d'observation et de compte rendu de la portée visuelle de piste, Doc, 9328 AN/908, Organisation de l'Aviation Civile Internationale, 2005
OMM, Guide des instruments et des méthodes d'observation météorologiques, OMM 8, Geneva, 1983.
OMM, Organisation Météorologique Mondiale: Guide du système mondial d'observation, OMM 448, Geneva, 1989.
OMM, Organisation Météorologique Mondiale: Guide des systèmes d'observation et de diffusion de l'information météorologique aux aérodromes, OMM 731, Geneva, 1990.
Van der Meulen J.P., “Visibility measuring instruments: differences between scatterometers and transmissometers”, WMO in Instruments and Observing Methods, report no. 49, WMO/TD no. 462, pp. 331, 1992.
1 Chapter written by Hervé SIZUN and Maher AL NABOULSI.