
Chapter 9
Dosimetry of Interactions Between the
Radioelectric Waves and Human Tissues –
Hybrid Approach of the Metrology1
9.1. Introduction
Wireless technologies, and in particular those using electromagnetic fields (emf), are used with increasing frequency in communication systems. In spite of this there is a public concern about EMF. The tremendous use of mobiles during the 1990s, and the proximity of RF emitters to tissues, such as the brain, have induced a public debate.
Protecting people from non-ionizing emission is not a new topic and did not appear with the mobile telephony. The World Health Organization (WHO, www.who.int) and the International Commission on Non Ionising Radio Protection (ICNIRP, www.icnirp.org) have defined limits to protect humans from exposure to EMF (ICNRP 98, 1998).
Dealing with general public and radio frequencies, the ICNIRPs fundamental limits are the basic recommendations that define the maximum acceptable human specific absorption rate (SAR). This must be below 0.08 W/kg whole body averaged and 2 Watts per kilogram locally (ie averaged over 10 grams of tissues). For the workers these limits are 5 times higher.
DAS quantifies the power absorbed by biological tissues. In 1999, ICNIRP limits have been endorsed by the European Commission in its recommendation (100/519/CE). French legislation incorporated these recommendations in 2002 via a decree (no 2002–775 signed 3rd of May 2002).
In spite of these protection limits, questions about health still exist because of the tremendous use of mobile phones and the proximity of emitters. In 1996 the WHO set up the EMF project to analyse the risk and validity of existing limits. The researches carried out in this domain were recorded in a database (www.who.int/pehemf/research/database/emfstudies/). The EMF project recommends studies via a research agenda. In the RF domain and according to WHO and research in its database, no health effect has been proven below the ICNIRP limits. Nevertheless, it was pointed out by experts groups (Zmirou, 2001), that scientific questions still exist and further research is required.
Exposure analysis, the objective of the dosimetry, is requested by biological researched or compliance analysis. Dosimetry is fundamental because the electromagnetic field strength and SAR estimation are the bottle neck of studies dealing with the possible sanitary effect of EMF. Dosimetry is also fundamental to check the compliance with standards and international recommendations of systems put on the market.
Experimental estimation of EMF fields in living tissues is facing several problems. Present methods are based in in situ probes and are therefore invasives and impossible in some human living tissues, such as the brain, if there is no therapeutic need. Another constraint is linked to the severe heterogenity of biological tissues. The SAR assessment in some tissues requires submillimetric probes that are facing sensibility and isotropy problems, as well as calibration. Miniaturization of measurement tools is an axis stidy but most of the research is dedicated to the complementarity of simulations and measurements.
9.2. Evaluation of the power absorber for the tissues
The electromagnetic field interacting with biological tissues is composed of electric field E, and magnetic field H. when the electromagnetic field is propagating in tissues that are lossy, a part of the energy carried by the field is absorbed by tissues. This absorbed power characterizes the level of exposure quantified using the specific absorption rate (SAR). The SAR unit is watt per kilogram. From the mathematical point of view the SAR is linked to the time derivative of the energy W divided by unit of mass m:
[9.1] 
SAR estimation can be achieved using two approaches. The first links the power absorbed to the electric field; the second links the power absorber to the derivative of the rise of temperature. In a small volume dv surrounding a lossy dielectric (conductivity σ) the absorbed power is equal to σE2dv. The SAR is therefore linked to the electric field strength, the conductivity σ and the tissues volumic mass ρ.
[9.2] ![]()
In the ICNIRP recommendation, the maximum local SAR is obtained through a process looking for the maximum of the averaged SAR over 10 g of tissues.
[9.3] 
The relationships between the temperature, the energy and the thermal exchanges given by the Pennes bio-heat equation (Pennes, 1948) allows us to also have the SAR as a function of the temperature. Just after steady state equilibrium, combination of the rise of temperature ΔT and the power inducing a SAR gives:
[9.4] ![]()
In this equation ρ, C and k are the volumic mass, the calorific capacity and the thermal conductivity respectively. At t = 0, diffusion (associated with ∇(k.∇∆T) in the bio heat equation) is negligible. So equation [9.4] can be simplified and gives:
[9.5] ![]()
In case of SAR estimation using the temperature the time derivative of the temperature T must be estimated at t = 0 since the proportionality between the SAR and the time derivative of the temperature is valid only if the diffusion phenomenon are negligible.
9.3. Experimental evaluation of the specific absorption rate (SAR)
SAR measurement taken using the temperature measurement that is carried out via different methods, such as thermal coupling, thermal resistances, thermal diodes as well as liquid crystal. Thermal meters based on fiber optics are often used as they do not disturb the electromagnetic field. The SAR estimation is given by the estimation of the slope of the temperature rise (Figure 9.1). One of the limits of this approach, in particular in the certification domain, is linked, as shown in the previous section, to the state of equilibrium requested prior to any SAR measurement. This constraint has led the SAR measurement to be carried out through the electric field.
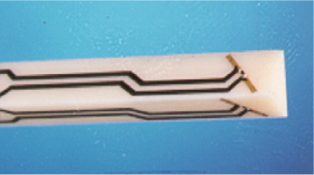
In the case of SAR measurement via the electric field, the three electric field components must be measured in order to allow an estimation of the field strength and therefore of the SAR [9.2]. Currently, the SAR measurement probes are based on Schottky diodes in the gap of three dipoles located on a ceramic prism (Grangeat et al., 2003). These dipoles are oriented in a such way that they allow the estimation with an acceptable isotropy of the field strength (Figure 9.2)
Figure 9.2. Arrangement of the dipoles on the prism
Current probes enable an “RMS” electric field measurement based on a non-frequency selective approach detection of the envelope (Bassen, 1983) having a typical upper band up to 6 GHz. The measurement (electric field strength) is converted in a continuous signal (Figure 9.3). Filtering is often used to remove harmonic components, this filtering also allows a better isolation between the active zone of detection and the access area
Figure 9.3. Equivalent circuit
This filter induces a lower limit in terms of the time response of the probe that does not allow activation of the probe simultaneously to the emission of a burst. Measurement and calibration have to be performed with signal having the same envelope. Taking account of these constraints the probe calibration allows for a given media and signal shape a relationship between measurement and the electric field strength. As a consequence, this approach is limited to homogenous media and is not applicable to severe heterogenous tissues. In spite of these limits this approach is used to check the compliance of mobile phones and validate numerical models.
The SAR measurement for compliance testing is intensively used for telecom systems. A robot measures the SAR in a normalized phantom (Figure 9.4), the measurements are interpolated, extrapolated. The maximum SAR averaged over a mass of 10 grams must be below the limit recommended by the ICNIRP.
Figure 9.4. Test bench (left), test positions (middle) and results (right)
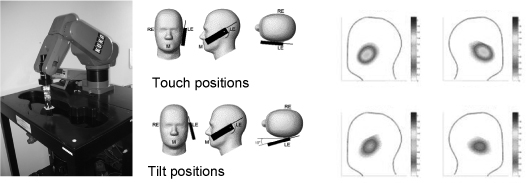
The shape of the phantom used for compliance testing and the composition of the equivalent liquid have been studied experimentally and through simulation in several research programs: such as the RNRT COMOBIO (Monebhurrun et al., 2002) French project. These studies, where experimental and numerical approaches are complementary, allowed us to define the shape and liquid that induce a maximum SAR over 10 grams – always overestimating the SAR in real human heterogenous head.
The test positions, the shape and the liquid have been normalized by international bodies, such as the European Committee for Electrotechnical Standardization (comité européen de normalisation électronique et électrotechnique) (CENELEC, 2001).
The probe's size in the area of dipoles is a critical parameter for measuring the SAR close to the air-liquid interface, since the measurement performed using the dipole is associated with an electric field strength by the calibration factor. The calibration factor depends on the shape of the probe and on the liquid surrounding the probe.
Calibration is performed in homogenous liquid, so the validity of the calibration factor requires a minimum of homogenous liquid surrounding the probe. The first probes that were built had a tip size of 5 mm. Today wireless telecommunication systems are using higher frequencies, because of this higher SAR are located at the periphery of the head, since the “skin depth” decreases with frequency. Probe size must thus be reduced; the ANR project ADONIS (Person et al., 2008) has studied this question.
9.4. SAR evaluation in biological tissues
9.4.1. DAS evaluation by numerical methods
As described in the previous section, electric field measurement in biological tissues requests knowledge of tissues surrounding the probe. Even if the calibration factor is known for all the configurations, accuracy is linked to knowledge of the exact position of the probe within the heterogenous tissues, as well as the tissues distribution in this area. Such constraints limit the in situ measurement. Moreover, the in situ measurement in human living tissue does not only have an ethical limit as the presence of the probe can disturb the tissues distribution. The present size of the probe is not compatible with an in-organ measurement, such as celebro-spinal fluid which has a thickness of same order.
If simulations also request a good knowledge of tissues, they allow an estimation of the EMF inside, without any constraints linked to physical insertion. A numerical approach, based on a volumic discretization, allows an assessment of electric and magnetic fields inside tissues of interest.
Today the commonly used volumic methods are the finite element method (FEM) and the finite difference in time domain (FDTD) method. The FEM has been used for a long time in mechanics. The main advantage of this approach is linked to the non-structured grid that can be used. This approach allows us to accurately model any object with an optimum number of unknowns and without any stair-cases that are induced by methods requesting orthogonal meshing. In spite of this advantage the FEM is not often used since the method requests a matrix inversion that is quite impossible with large matrix (e.g. a heterogenous head with a millimeter resolution).
The FDTD (Finite Difference in Time Domain) has no such constraint. This method is based on a time domain discretization of the Maxwell equation, and on an explicit conditionally stable scheme. All the schemes are not stable, the most commonly used, the “leap frog”, has been introduced by Yee (1966). In this case, the component of the E and H fields are not co-located (Figure 9.5) and their centered positions allow a second order accuracy.
Figure 9.5. Elementary cell and space-time interleaving
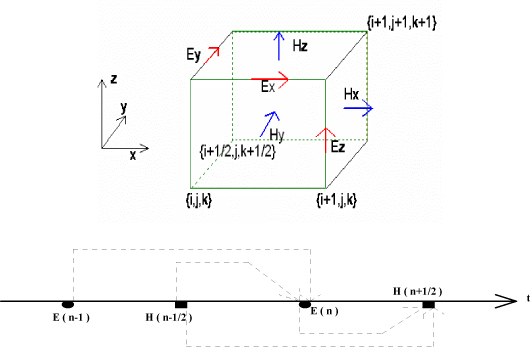
Figure 9.6. Numerical dispersion with respect to the incidence angle for different mesh sizes in terms of wavelength
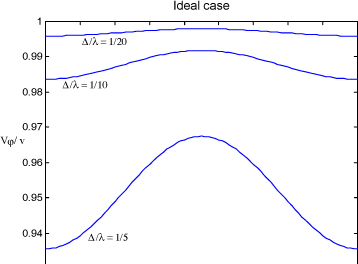
The accuracy of the method is linked to the limitation of the dispersion induced by the numerical speed variation that depends on the angle of the propagation in the grid (moreover the numerical speed is not equal to the light speed in the media) as shown in Figure 9.6.
As explained previously, the FDTD is not unconditionally stable in its explicit form. Studies have been done on this subject, the main contributions are those of Courant et al., (1928), of O'Brien (1951) and of Gustafsson et al., (1972). The synthesis of these studies is performed in several text book (Taflove, 2000).
For a long time, the use of the FDTD has been limited by the memory requirement. Now these limits are less important and the FDTD, that is easy to implement, is used with increasing frequency in electromagnetism and, in particular, in bio electromagnetism where it is one of the most commonly used volumetric methods. The acceleration techniques of FDTD, with the use of dedicated graphics cards, are reinforcing this trend further (Schneider, 2006).
In the case of biological media, tissues heterogenity is such that the velocities vary largely from one medium to another. For instance, at the frequency of 900 MHz, the velocity of white matter, whose relative permittivity is equal to 39 and velocity in the muscle, whose relative permittivity is equal to 55, varies by a factor of 1.18. The stability has to take into account these variations and the time step ∆t, which has to be used in FDTD, should be the minimum of the values obtained for the different media.
9.4.2. Biological tissues modeling
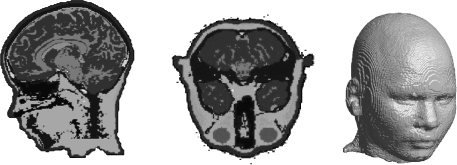
Research on brain modeling, on the cerebral cortex for instance, is the topic of many papers (Colliot, 2006). The models are constructed from direct slices, like those obtained in the frame of the “Visible Human” project from the NLM (National library of Medicine) (http://www.nlm.nih.gov/research/visible/). They can also be constructed from magnetic resonance imaging (MRI) (Figure 9.8). These images associated to tissue reconstruction tools (Rifai, 2000) allow us to make a tissues segmentation and to build accurate models, for which the components include skin, bone, celebro spinal fluid, muscle, brain grey and white matter.
The biological tissues are characterized, from an electromagnetic point of view, by several main properties: the heterogenity and the dependence in frequency of the dielectric values and the large variability between individuals. Figure 9.8 shows the result of an MRI image segmentation from a child head, and allows us to evaluate the complexity of the biological structure.
Figure 9.7. Anatomical cross-section and MRI cross-section
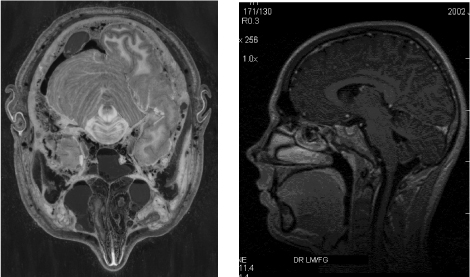
Figure 9.8. Human head sections and example of a segmented image from a 12 year old child
If the magnetic permeability of biological tissues is the same as that of the vacuum, the relative permittivity εr and the conductivity σ depend on the tissues and the frequency. Many studies were carried out to model and measure these values (Gabriel, 1996). The first model is from Debye (1929). For more complex materials the permittivity can be expressed as the sum of Debye models of the main components, but this approach does not allow us to sufficiently describe the dielectric properties of biological tissues. The dispersion of biological tissues is linked to three big phenomena. The first phenomenon appears in the low frequency range and induces a decrease in the permittivity, which is linked to the creation under the effect of an electrical field of a phenomenon of ionic diffusion – which takes place at the surface of the cell membrane and creates a dipole at the scale of the cell.
The second phenomenon is linked to the capacitive effect of the cell membranes. The reactance of the membrane decreases with the frequency; allowing the circulation of the current in the inter-cell medium, and has as a consequence an increase in the effective conductivity. The third dispersion phenomenon, which takes place only at very high frequencies, is linked to the dipolar orientation of the free water molecules. In order to take into account the complexity of phenomena, more complex models (for example, Cole and Cole, 1941) have been developed. To document these models, permittivity measurements have been taken (Gabriel, 1996) for biological samples. The dielectric values of many tissues, such as those given in Table 9.1, are available on the Internet (http://www.fcc.gov/fcc-bin/dielec.sh).
Table 9.1. Examples of dielectric values of tissues as a function of the frequency
9.4.3. Source modeling
The quality of source modeling and the experimental validation of the model are essential as the SAR distribution in the tissues depend strongly on the source. Cell phones are composed of several subparts: antenna, speaker, microphone, screen, keyboards, battery and of course the printed circuit board (PCB) and its components. The source models can be more or less complex.
Studies have been carried out to analyze the influence a radiofrequency source model on the induced SAR (Monebhurrun et al., 2007). These studies showed that the subparts, such as the screen of a cell phone, play a big role. Thus, it is fundamental to experimentally validate the accuracy of these models (see Figure 9.10).
In the case of utilization in the near-field region, this verification has to be carried out in the near-field via the SAR measurement in a homogenous liquid as defined by the standards. If the anatomical model and the relative position of the source are controlled, the validity of these calculations is related to the experimental validation of the radiating source, which could be a cell phone or an exposure set-up (L éveque, 2004).
Figure 9.9. Example of exposure source models (cell phone and loop)
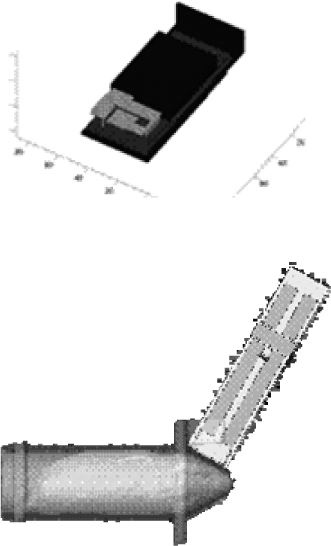
Figure 9.10. Head model (a); electric field strength (b) and SAR (c) induced by a mobile
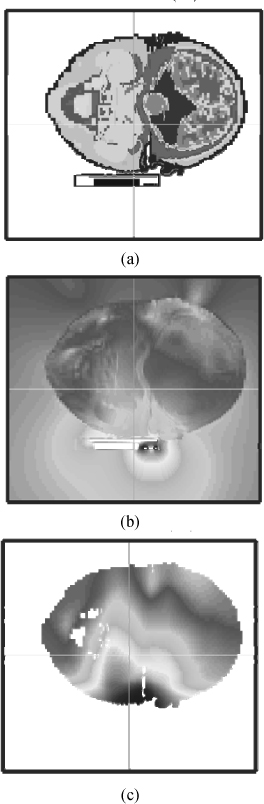
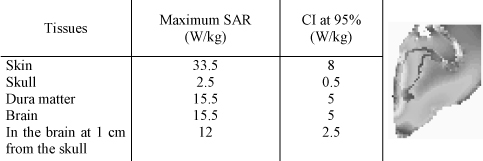
Figure 9.11. SAR levels and SAR distribution in a rat head
9.4.4. Absorbed power in the tissue distribution
The use of anatomical models associated with a numerical technique like FDTD allows an evaluation of the specific absorption rate in the tissues. The existing techniques in numerical simulation are very accurate; from this perspective, the validity of such calculations depends essentially on the anatomical model (its quality and its representativeness) and the precision of the radiating source model.
The simulations allow for a source model to obtain the cartography of the exposure levels as well as the absolute levels (Figures 9.10 and 9.11).
9.5. Variability, representativeness and uncertainty
A measurement and more largely an estimation is useful only if it is provided with its uncertainty or its confidence level. In the case of dosimetry, as explained in the previous sections, the measurement and the simulations are combined to evaluate the SAR in the tissues. The variability and the representativeness of the models are essential for evaluating the associated uncertainty of this evaluation.
In the experimental domain, controlling the measurement chain allows a global uncertainty below 30% (CENELEC, 2001), but this approach is only valid in the homogenous liquids and for a perfectly known phantom (SAM). The accuracy of numerical methods, such as FDTD, is very important but the uncertainty associated to a simulation cannot be reduced to the accuracy of the method used because the uncertainty associated to a simulation is strongly linked to the accuracy or the representativeness of the inputs.
In the dosimetry domain, the precision of the source model, of its positioning, the discretization (size of the voxels) and the representativeness of the anatomical models are the factors inducing an uncertainty on the simulation results. At the international level, 14 laboratories have numerically evaluated the SAR in conditions where the head models and mobile terminals are fixed and where the “free” parameter is the method to position the phone in such a way that it is positioned according to international standards. The results (Beard, 2006) are noticeably different between the laboratories. These can be related to the fact that weak variations in the positioning (of the order of 1 millimeter) can induce noticeable differences on the absorbed power level. The quantification and the control of this uncertainty related to the positioning and the associated human factor is the subject of inter-comparison studies carried out within the IEEE (IEEE scc34 P1528). Another uncertainty source is related to the representativeness of anatomical models. As shown in Figure 9.12, morphology is variable between individuals.
In the case of an animal experiment, it is conceivable to have the numerical model of the animal under test. In the case of the utilization of a wireless system by a human being, it is impossible to evaluate the exposure levels individually because it assumes an MRI acquisition. Furthermore, even though this acquisition can be envisaged, its validity would be reduced for morphology changes with age, but also with position. Numerical models (Figure 9.13) have been created to evaluate the SAR (localized and whole body), but the representativeness of such numerical models is still unresolved.
Figure 9.12. Numerical child models of heads at different ages
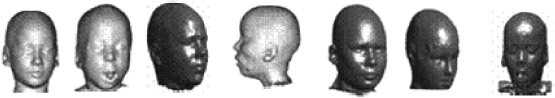
Figure 9.13. Numerical adult models in different positions
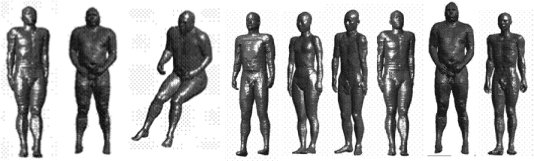
Figure 9.14. Skull depth (mean and plus and minus 2 standard deviations) in millimeters as a function of age in months (left); and brain weight in grams as a function of age in years (right)
Growth is an important source of variability. As shown in Figure 9.14, the growth curves (Farkas, 1994; Koenig, 1995) of the head and those of tissues like the brain or the skull are specific to these organs. Studies have been carried out in order to generate child head models from adult models by deforming them unevenly in order to respect the proportions (Wang, 2003; Hadjem 2005a, 2005b). This approach is better than the one using a homogenous scaling, nevertheless, its validity is strongly reduced if the difference in age is too important: for instance from 5 to 20 years, the brain volume increases only by 10%, while at the same time the skull depth increases by 70%.
Within the ANR TLCOM project ADONIS (www.tsi.enst.fr/adonis/), studies have been carried out to evaluate the SAR in different child head models (Wiart, 2005). Figure 9.15 shows, at 1,800 MHz, the simulation result obtained with a model of a commercial phone with a patch antenna and several child head models.
Figure 9.15. SAR induced in different head models by a phone with a patch antenna operating at 1,800 MHz
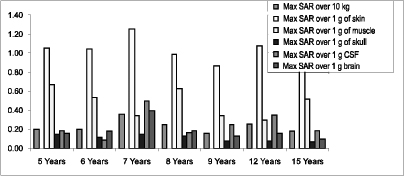
Figure 9.16. Max SAR averaged over 10 g induced in 12 child head models in the same age class (12 years old) by a phone with a patch antenna operating to 1,800 MHz
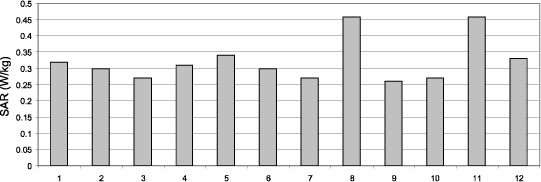
Facing this variability, a strategy could be to search a representative individual of the population, however such an evaluation undertaken with such a model would not be universally applicable. Even within a same age class, variability is important. By using morphing techniques (deformation in parts by respecting the proportions and the growth curves), child head models of 12 years old have been generated from adult and child head models (Hadjem, 2005b; Wiart, 2005). Using these models, the SAR averaged over 10 g has been evaluated in 12 head models of 12 year old children. As shown in Figure 9.16, variations within as same age class are important.
Today, advances in measurement technology, simulation methods and calculation capacities allow us to accurately evaluate the SAR in a biological structure whose characteristics and structure, as well as the emission source and its positioning, are perfectly known and controlled. These conditions are never met, and the challenge today is to evaluate the uncertainty related to the variability of the models.
9.6. Conclusions
The dosimetry of the interactions of high frequency radiowaves is a relatively new domain but has made huge progress these last years. Many studies have been carried out in the field of experimental and numerical dosimetry. The SAR measurement has mainly been studied in homogenous liquids, with as a main application the certification of telecom systems. The in vivo measurement has to deal with the tissues heterogenity, which requires a precise knowledge of the tissues distribution to link the measurement of the electric field strength to the SAR.
The combination of numerical and experimental approaches has allowed us to go beyond their respective limits. This hybrid approach, who has benefited from the progress of computers, has enabled great advances in the field of bio-electromagnetism by allowing an non-invasive evaluation of the SAR in highly heterogenous tissues. The on-going studies should further improve the quality of the estimations and fully validate this metrology approach, in particular by evaluating the associated uncertainty of the approach.
The uncertainty of the hybrid approach is one of the main research directions for the future. Indeed, accuracy of the numerical method should not be confused with accuracy of a simulation, which often depends on the quality of the input data. The limited number of available anatomical models, the great variability of the human morphology and all the possible positions set the representativeness of the anatomical models used. Present studies that are starting at an international level (EMF NET, 2007) will allow an evaluation of the validity of the produced calculations and lay the foundations of the evaluation of the statistical distribution of the SAR as a function of the morphology of the sources and of the frequencies.
9.7. Bibliography
Bassen H., Smith S., “Electric field probes–A review,” IEEE Transactions on Antennas and Propagation, vol. AP-31, no. 5, p. 710–718, September 1983.
Beard B., Kainz W., Onishi T., Iyama T., Watanabe S., Fujiwara O., Wang J, Bit-Babik G., Faraone A., Wiart J., Christ A., Kuster N., Lee A.K., Kroeze H., Siegbahn M., Keshvari J., Abrishamkar H., Simon, Manteuffel D., and Nikoloski D., “Comparisons of computed mobile phone induced SAR in the SAM phantom to that in anatomically correct models of the human head”, IEEE Trans. Electromagn. Compat., vol. 48, no. 2, p. 397–407, 2006.
CENELEC EN50361, norme europ éenne, Basic standard for the measurement of Specific Absorption Rate related to human exposure to electromagnetic fields from mobile phones (300 MHz - 3 GHz), EN50361, comit é europ éen de normalisation électronique et électrotechnique, 2001.
Cole K.S., Cole R.H., “Dispersion and absorption in dielectrics, I. Alternating current characteristics”, Journal of Chemical Physics, vol. 9, p. 341–351, 1941.
Colliot O., Camara O., Bloch I., “Integration of fuzzy spatial relations in deformable models -application to brain {MRI} segmentation”, Pattern Recognition, vol. 39, p. 1401–1414, 2006.
Courant R., Freidrichs K., Lewy H., “Uberdie partillenen differenzengleichungen der mathematischen physik”, Mathematische Annalen, vol. 100, 1928.
Debye P., Polar Molecules, The Chemical Catalog Company, New York, 1929.
EMF NET 2007, “Uncertainty managment in dosimetry”, Workshop, Paris, April 2007.
Farkas L.G., Anthropometry of the head and face, Raven press New York, 1994.
Gabriel C., “Compilation of the dielectric properties of body tissues at RF and microwave frequencies”, Brooks Air Force Technical Report, AL/OE-TR-1996-0037, 1996.
Grangeat Ch., Person Ch., Picard D., Wiart J., “Mesure du d ébit d'absorption sp écifique des t él éphones mobiles”, Annales des t él écommunications, vol. 58, no. 5–6, 2003.
Gustafsson. B, Kreiss H. O., Sundstrom A., “Stability theory of difference approximation for mixed initial boundary value problem”, Mathematics of Computation, vol. 26, 1972.
Hadjem A., Lautru D., Dale C., Wong M.F., Hanna V.F., Wiart J., “Study of specific absorption rate (SAR) induced in the two child head models and adult heads using a mobile phone”, IEEE Trans. MTT/Microwave Theory and Techniques, vol. 53, no. 1 p. 4–11, January 2005a.
Hadjem A., Analyse de l'influence de la morphologie sur le SAR induit dans les tissus de têtes d'enfants, PhD thesis, University Paris 6, November 2005b.
[ICN 98] ICNIRP 98, “Recommandation de l'ICNIRP”, Health Physics, vol. 74, no. 4, p. 494–522, April 1998.
Koenig WJ, Donovan JM, Pensler JM, “Cranial bone grafting in children”, Plast Reconstr Surg., vol. 1, p. 1–4, January 1995.
L éveque P, Dale C, Veyret B., Wiart J., “Dosimetric Analysis of a 900 MHz rat head exposure system”, IEEE Trans on MTT, vol. 52, no. 8, p. 2076–2083, August 2004.
Monebhurrun V., Dale C., Bolomey J-Ch., Wiart J., “A numerical approach for the determination of the tissue equivalent liquid used during SAR assessments”, IEEE Trans. on Magn., vol. 38, no. 2, p. 745–748, 2002.
Monebhurrun V., Lacroux F., Wong M. F, Wiart J., Optimized Numerical Modeling of Commercial Mobile Phones for Efficient SAR Calculations Compumag 2007, Aachen, Germany, 24–28 June, 2007.
O'Brien G.G., Hyman M.A., Kaplan S., “A study of the numerical solution of partial differential equations”, Journal of Mathematics and Physics, vol. 29, 1951.
Pennes H. H., “Analysis of tissue and arterial blood temperature in the resting human forearm”, J. Appl. Physiol., vol. 1, p. 93–122, 1948.
Person Ch., Le Pennec F., Luc J., “Design, modelisation and optimisation of high efficiency miniature E-field probes performed on 3D ceramic prisms for SAR evaluation”, Annals of Telecommunications, vol. 63, p. 43–54, 2008
Rifai H., Bloch I., Hutchinson S., Wiart J., Garnero L., “Segmentation of the skull in MRI volumes using deformable model and taking the partial volume effect into account”, Journal of Medical Image Analysis, vol. 4, no. 3, p. 219–233, 2000.
Schneider R., “Video games people play at work”, Supercomputing ‘06 Workshop Tampa, Florida, 2006, (http://www.gpgpu.org/sc2006/workshop/).
Taflove A., Hagness S., Computational Electrodynamics, Artech House, 2000,
Visible Human Project, National Library of Medicine 8,600 Rockville Pike www.nlm.nih.gov/research/visible/visible_human.html.
Wang J., Fujiwara O., “Comparison and evaluation of electromagnetic absorption characteristics in realistic human head models of adult and children for 900-MHz mobile telephones”, IEEE Trans on MTT, vol. 51, no. 3, March 2003.
Wiart J, Hadjem A., Gadi N., Bloch I., Wong M. F., Pradier A., Lautru D., Hanna V.F.and Dale C., “Modeling of RF exposure in children”, Bioelectromagnetics, vol. 26, no. S7, p. 45–50, 2005.
Yee K., “Numerical solution of initial boundary value problems involving Maxwell's equations in isotropic media”, IEEE Transactions on Antennas and Propagation, vol. AP-16, p. 302–307, 1966.
Zmirou D., Les t él éphones mobiles, leurs stations de base et la sant é, Rapport au Directeur G én éral de la Sant é, La Documentation Française, January 2001.
1 Chapter written by Joe WIART and Man FAÏ WONG.