
Specify the Aggregation Function for a Measure
As you move up a hierarchy, a cube browser displays aggregated values. The default aggregation function is Sum, which adds lower level values to get higher level values. With some derived measure expressions, however, you get incorrect values if you use the Sum function to aggregate the values. See what happens when you attempt to calculate and aggregate an average price measure.

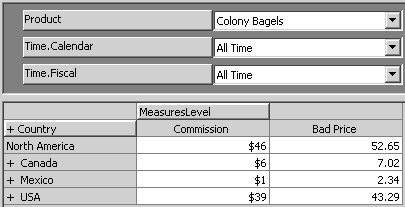


Derived measures calculate as part of the SQL statement that retrieves values from the fact table. The expression always calculates before any aggregations are performed. If you want to calculate a true average price, you must calculate after the units and dollars are summed. To do that, you must create a calculated measure.
Create a Calculated Measure
Creating a derived measure is one of two methods you can use to create measures that don’t exist as columns in the fact table. The other method is to create a calculated measure. (You can actually create a calculated member for any dimension. A calculated member that’s in the Measures dimension is a calculated measure.) The difference between a derived measure and a calculated measure is when the calculation is performed. A derived measure is calculated before aggregations are created, and the values of the derived measure are stored in the cube. A calculated measure is calculated after aggregations are created, and the values of a calculated measure aren’t stored in the cube.
|
You’ll learn how to create advanced calculated members in Part 2. |
The primary criterion for choosing between a derived measure and a calculated measure is not efficiency, but accuracy. For example, in calculating a Price measure, it makes all the difference in the world whether you calculate the Price before aggregating the Dollars and Units (a derived measure) or whether you do it afterward (a calculated measure).
1. | In the cube tree, right-click the Calculated Members folder, and click New Calculated Member. In the Calculated Member Builder dialog box, type Net Price as the new member name. |
2. | In the Data tree, fully expand the Measures dimension and double-click the Sales Dollars measure to make the member name appear in the Value Expression box. Click the slash ( / ) on the right side of the dialog box, and then double-click Sales Units in the Data tree. 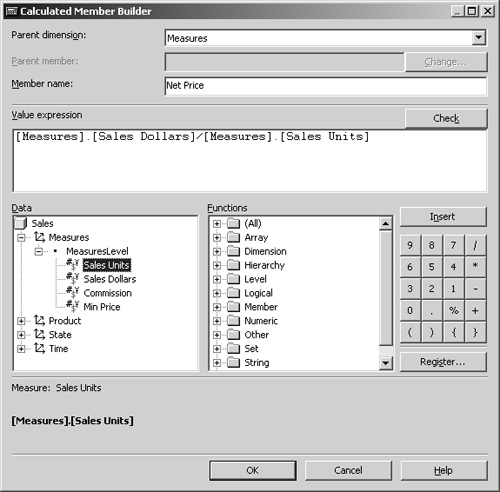
|
3. | Click OK. The Net Price measure appears in the Calculated Members folder. This is a calculated measure. |
4. | |
5. | Select the Net Price measure, and look at the Properties pane. In addition to the Name property, it has a Parent Dimension property with the value of Measures and a Parent Member property that’s empty. A calculated measure (that is, a calculated member that’s in the Measures dimension) never has a parent member. Finally, you see a Value property. The Value property corresponds to the Source Column property for a derived measure, but this is an MDX expression based on members in the cube.
|
6. | Select the Advanced tab, and for the Format String property, choose Currency from the drop-down list. |


Note
For a regular measure, the name of the formatting property is Display Format. For a calculated measure, the name of the formatting property is Format String. Other than the name, the two properties are equivalent. Also, some browsers—such as the PivotTable list control you’ll learn about in Chapter 5—allow you to format the value within the browser and consequently ignore the Format String and Display Format properties.
Most measures aggregate by using a Sum function—adding detail values to get the aggregation. If a calculation contains only addition or subtraction, you can chose whether to create a derived measure or a calculated measure based purely upon convenience or efficiency, since addition and subtraction can be done in any order. For example, you could create a Gross Profit measure by subtracting a Cost Of Goods Sold measure from a Net Sales Dollars measure. Since this calculation involves only subtraction, the values will be the same whether you choose to make it a derived measure—using columns from the fact table—or a calculated measure—using measures in a cube. If the measure will be used frequently, make it a derived measure; if infrequently, make it a calculated measure.
If a calculation involves multiplication by a constant, as in the Commission example given earlier, you’ll get the same value regardless of whether you use a calculated or a derived measure. Again, base the decision on how frequently the measure will be accessed.
If a calculation involves multiplying or dividing one column by another—as in calculating a price or a ratio—the choice between a calculated measure and a derived measure is important. If you want to aggregate by summing and the expression for the measure involves multiplication or division, you’ll almost always want to create a calculated measure. If, however, you use a Min or Max aggregation function, you might want to create a derived measure that calculates before the aggregation takes place.
Create a Measure that Calculates an Average
The Aggregate Function property of a measure determines how the measure will be aggregated. The Aggregate Function property allows five possible aggregation types: Sum, Min, Max, Count, and Distinct Count. You can create any other aggregated value you might want—for example, an average or a ratio—by using a calculated measure. Calculating an average is a particularly interesting option, and it requires a measure that uses the Count function. First consider how the Count function operates. You can use the Sum, Min, and Max functions to create a measure from a numeric column in a fact table. You can use the Count function to create a measure from any column in the fact table. The Count function counts each row in the fact table. It doesn’t count unique occurrences of a key. To count unique occurrences, you use the Distinct Count function, which is covered in the section “Calculate distinct counts for a dimension” in Chapter 4.
|
When you create a measure using the Count function, you can use any column from the fact table. |
One of the most important uses of the Count function is to allow you to create a calculated measure that properly calculates an average. Use a measure with the Count function as the basis for a calculated measure that creates an average.
1. | Click the Insert Measure toolbar button, and double-click the Employee_ID column. Type Count for the Name property of the new measure, and change the value of the Aggregate Function property to Count. |
2. | Click the Process Cube button. Save the cube, don’t design aggregations, and accept the proposed Processing Method. Close the Process log window, and scroll the Data pane to see the values in the cube. Because Count is a regular measure, not a calculated measure, the cube must be processed after adding it.
|
3. | Click the Insert Calculated Member toolbar button. In the Calculated Member Builder dialog box, type Average Units in the Member Name box. |
4. | Fully expand the Measures dimension. Double-click the Sales Units measure, click the slash button ( / ), and double-click the Count measure. Then click OK. 
|
5. | Select the Average Units measure in the Calculated Members folder, and for its Format String property, select #,# from the list. Press Enter, and scroll to see the values in the Data pane. 
|

When calculating an average, you almost always want a true, weighted average. The Count aggregation function allows you to aggregate the row count from the fact table in parallel with the value you want to average. You can then create a calculated member to create the proper weighted average at each level of the hierarchy.
Hide an Internal Measure
In some cubes, you might want to use a measure such as Count as an intermediate value for creating a calculated measure such as Average Units, but you might not want it to appear in the list of available measures in client applications. A measure has a property that allows it to be hidden.
1. | Select the Count measure in the cube tree, and click the Advanced tab of the Properties pane. |
2. | Change the value of the Visible property to False, and press Enter. (You won’t see the change in the browser until you process the cube.) A measure might not behave exactly the way you expect after you change the Visible property to False. Client applications that explicitly specify the internal measure can still access it; the measure simply doesn’t appear in lists of measures. Surprisingly, the measure even disappears from the list of measures in the Calculated Member Builder dialog box, even though you can manually type it into the expression for a calculated member. |
3. | Right-click the Average Units measure, and click Edit to open the Calculated Member Builder. Fully expand the Measures dimension in the Data tree. The Sales Units and Sales Dollars measures are still visible, but the Count measure is not. You can still use the Count measure in an expression—look at the Value Expression box—but you would have to type it yourself. You might want to wait to set the Visible property for measures until after you have created calculated measures. 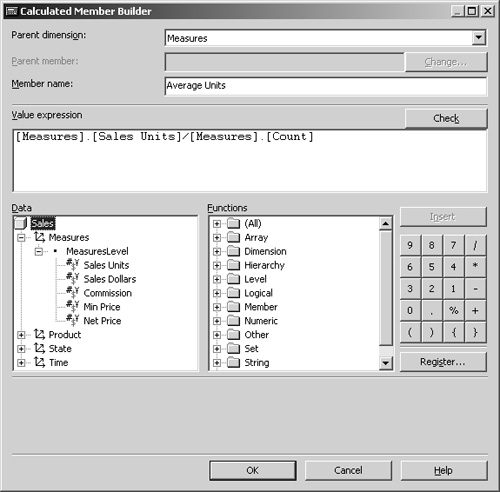
|
4. | Click Cancel to close the Calculated Member Builder. |
In addition to measures, most OLAP objects—dimensions, levels, calculated members—have a Visible property. Setting the Visible property of an object to False does not keep the object from being used in expressions or queries; it just keeps the object from appearing in client applications.