Working with Measures in a Cube
A cube must contain at least one dimension and at least one measure. The simplest measures are columns straight from the fact table, but it’s possible to use expressions to add additional measures to a cube. In many ways, measures in a cube behave like a dimension with a single level. Because of this, in some contexts you might see Measures presented as if it were simply one of the dimensions of a cube.
Create a Derived Measure
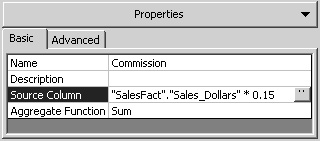
When you select a measure, a Source Column property appears on the Basic tab of the Properties pane. The Source Column property is similar to the Member Key Column and Member Name Column properties of a dimension level. As with those properties, it contains the name of a table and column from the relational data source. And as with those properties, you can enter a SQL expression acceptable to your data source.
Suppose, for example, that you pay a standard commission rate of 15 percent on total dollar sales. You could create what can be called a derived measure that calculates the commission at the lowest level.
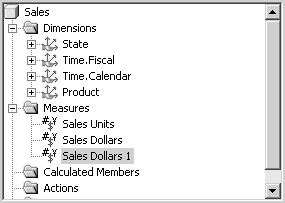
1. | In the Sales cube, right-click the Measures folder and click New Measure. Select the Sales_Dollars column, and click OK. The measure is added with the name Sales Dollars 1.
|
2. | |
3. | On the Tools menu, click Process Cube, agree to save the cube, decline to design aggregates, and click OK when asked to specify the processing method. Close the Process log window, and browse the data. |
4. | Scroll the grid as needed to see the new Commission measure.
|
5. | Click the Advanced tab of the Properties pane, type $#,# as the Display Format, and press Enter. (You need to type the format string; it does not appear in the drop-down list.) The Preview pane generates sample values, but you can see that the numbers are rounded.
|
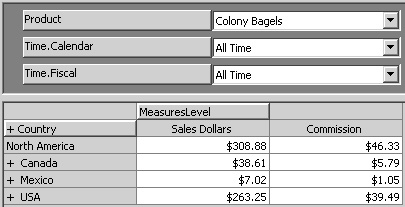
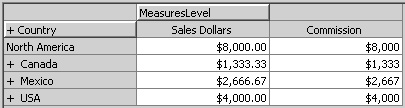
The Commission measure is stored in the cube file, the same as if it were a numeric column that came directly from the fact table. In effect, if you have control over the relational data warehouse, you can create a view that adds the Commission column to the other columns of the fact table and, in Analysis Services, use the view as the fact table. You can always think of a derived measure as a column that might have been in the fact table itself.
Including Multiple Tables in a Derived MeasureA derived measure can include only columns from the fact table. This can cause complications in certain situations. For example, the Market sample warehouse includes Sales_Dollars and Sales_Units in the fact table. The Sales_Dollars in the fact table are net dollars—that is, dollars after discounts. The Price column in the Product table contains the list price for each product. Multiplying the Sales_Units column in the fact table by the Price column from the Product table gives you the Gross Dollars for each record. The Gross Dollars measure would be an excellent candidate for a derived measure because it should be calculated before aggregating the dollar values. Unfortunately, even if both the fact table and the Product table are included in the cube definition, Analysis Services requires that all columns in a derived measure come from the fact table. The only way to create a derived measure that includes columns from multiple tables is to create a view in the relational data source and use that view as the fact table. |