
CHAPTER TEN
Applications of Microwave Imaging
10.1 CIVIL AND INDUSTRIAL APPLICATIONS
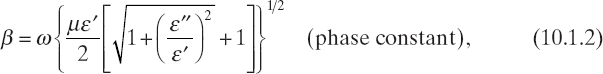
Microwave diagnostic techniques are widely used in civil and industrial applications, especially because of their ability of penetrate inside dielectric materials. The simplest way to understand this phenomenon is to consider the propagation of a plane wave through a homogeneous medium. To this end, let us assume that a plane wave [equation (2.4.24)] is propagating along the z axis inside a material characterized by ε = ε′ − jε″ [equation (2.3.14)], and μ (real-valued). Thus
![]()
where
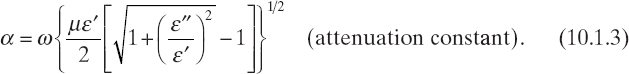
Accordingly, equation (2.4.24) can be rewritten as
![]()
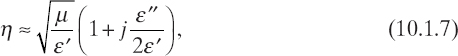
For ideal dielectrics, α = 0; consequently, from equation (10.1.4) it results that |Ep(z)| = |E0| for any z; that is, the electromagnetic field is not attenuated. For low-loss scatterers (ε″ « ε′), we have
![]()

whereas for good conducting materials, for which the conduction effect is dominant and ε″ ≈ σ/ω » ε [see again equation (2.3.14)], we obtain
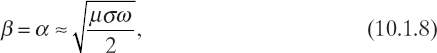
![]()
In both cases, since α > 0, it follows from equation (10.1.4) that |Ep (z)| = |E0|e−αz. Then the field attenuates as it propagates through the material. Since the material is homogeneous, after any length Δz, the attenuation is such that
If we choose Δz = δ such that the ratio shown above is equal to 1/e, it follows immediately that
![]()
which is the penetration depth (m) and is used to quantify the degree to which an electromagnetic wave can propagate inside a material, although in real cases the targets are not homogeneous, and the incident wave cannot always be approximated by a plane wave. It should be noted that for PEC objects, we have σ → ∞, and, from (10.1.8) and (10.1.11), δ → 0, with the well-known result that a time-varying field is unable to penetrate inside a PEC object. For an idea about the penetration depth, it should be noted that, due to the exponential decay of the field (except for ideal dielectrics and PEC objects), after a length equal to the penetration depth Δz = δ, the field amplitude is reduced to about 37% of its initial value; after a length Δz = 2δ, we have a reduction to about 13.5%, whereas after Δz = 3δ, the field is only about 5% of the initial value. For the sake of illustration, some results concerning materials that can be inspected by microwave techniques will be provided below.
As mentioned earlier, microwave techniques are widely used in civil and industrial engineering, such as for material characterization and crack detection. However, these techniques usually are based on transmission and reflection concepts. There is usually one transmitting antenna (e.g., an open waveguide or a small horn) which may or may not be in contact with the bodies to be inspected and that generates the incident wave. The scattered wave is then collected by the same antenna (reflection mode) or by another antenna (the receiving antenna) located on the other side of the object (transmission mode). Care must be exercised in determining the dielectric properties of the bodies by measuring the reflection or transmission coefficients (e.g., the [S] parameters of the system), and the effects of the antenna elements have to be taken into account. Despite these additional difficulties, the approach is essentially one-dimensional. Procedures for solving the one-dimensional inverse problem have been reported (e.g., Mittra 1973, Bolomey et al. 1981), and reviewed (Chew, 1990). Moreover, several applications of microwave techniques in nondestructive testing and evaluation (NDT&E), based mainly on reflection/transmission concepts, have been reviewed in detail (Kharkovsky and Zoughi 2007). It is quite straightforward that many of the applications for which these techniques are effective can probably also benefit from image-based inspection methods, such as those described in the previous chapters.
The first area of interest for microwave techniques is that of material characterization, in which microwaves are used to draw information about the main properties of the inspected materials, such as the determination of constituents, evaluation of porosity, and assessment of the curing state. It is evident that this goal can be achieved by microwave techniques if there is a precise correlation between the properties of the materials under test and the values of the macroscopic dielectric parameters that can be detected by microwave inspection techniques, working under both classical transmission/reflection conditions and by possibly using imaging techniques in order to derive maps of the inspected objects.
A large number of studies correlate physical and chemical properties of materials to their dielectric parameters [see, e.g., the text by Zoughi (2000) and references cited therein]. Measurement of the dielectric parameters at microwave frequencies is a classical topic in applied electromagnetics, and the scientific literature on the subject is wide. The reader can refer to the book by Chang (2005) and other specialized publications. In most cases the dielectric parameters are calculated by inserting samples of the material to be characterized inside a waveguide often closed on a short circuit. Incident progressive waves impinging on the samples create reflected waves that can be measured by means of a vector network analyzer. The values of the reflection coefficients can be related to the dielectric properties of the samples constituting the load of the waveguide. Cavity-based measurement systems are also used, as well as free-space measurement approaches.
However, retrieving the values of the dielectric parameters from measured values of the reflection/transmission coefficients is essentially another inverse problem. Several techniques can be adopted to invert this relation, and often various samples of the same material with different thicknesses are used. Such experiments and the related inversions allow one to deduce the relation among the values of the dielectric parameters and the specific properties of the material, for a characterization of the material that can be used to extrapolate the specific properties of interest when an unknown material is inspected by microwave techniques able to retrieve the distributions of the dielectric parameters.
For illustration purposes, we consider here an example of the extensive measurements of dielectric properties of rubber that has been performed by Zoughi (2000) using a waveguide measurement system (working as outlined previously) with an accuracy of less than 1% on the measurements of the real part of the dielectric permittivity and less than 3.5% for the imaginary part (lossy factor). It was observed that rubber dielectric properties significantly depend on the compound constituents, the volume fraction of these constituents, and chemical reactions among them.
For example, it has been found that the real part of the dielectric permittivity changes almost monotonically from ε′r ≈ 5 to ε′r ≈ 27 for a percentage of carbon block volume ranging from about 8% to about 32% at 5 GHz. It is quite evident that these ranges of permittivity and conductivity values are compatible with the resolution expected from the microwave imaging techniques discussed in the previous chapters. For an idea of the capability of penetration of microwaves inside this material, we can evaluate, using equation (10.1.11), the penetration depths of microwave signals at the operating frequency and for the extremes of the specified range of variation for the percentage of the carbon block volume. The results are δ ≈ 3 cm for 8% and δ ≈ 0.35 cm for 32%.
Another key aspect is represented by the capabilities of microwave techniques in detecting cracks and defects inside dielectric structures (Pastorino et al. 2002). One of the most interesting applications is in the civil engineering field, in particular the evaluation of concrete structures and other materials (Park and Nguyen 2005; Xu et al. 2006). For example, the linear sampling method–Green's function approach (Sections 5.8 and 4.10) can be applied for the nondestructive assessment of a concrete structure. To this end, let us consider the numerical simulation reported in Figures 10.1 and 10.2, which refer to the detection of a void crack inside a cement pillar, modeled with dielectric parameters similar to those encountered in the area of civil engineering. The investigation domain is illuminated by M = 36 line-current sources uniformly distributed on a circumference of radius a, and the scattered electric field is collected at M = 36 measurement points uniformly distributed on a circumference of radius b. The values of a and b are chosen such that the antennas are in the far-field region of the investigation domain. The measured data to be inverted have been simulated by using a direct solver based on the method of moments. A Gaussian noise with zero mean value and variance corresponding to a signal-to-noise ratio of 25 dB has been added to the simulated data. In the inversion stage, the far-field matrix has been discretized by using N = 3969 pulse basis functions and M = 36 testing points, corresponding to the M measurement locations.
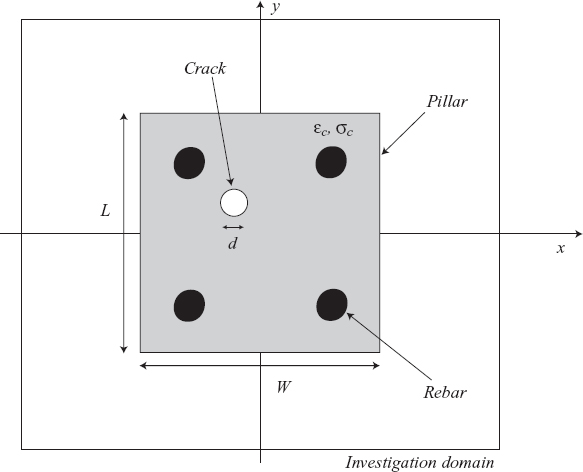
FIGURE 10.1 Model of a concrete pillar with four rebars (cross section).
The concrete pillar, whose cross section is shown in Figure 10.1, is modeled as a cylinder with square cross section made from homogeneous cement paste with dielectric permittivity εc = 2.37ε0 and electric conductivity σc = 5.7 × 10⁴ (Hayt and Buck 2001). The pillar is located in the center of the investigation domain and has sides W = 3λ0 and L = 3λ0, respectively. Inside the pillar, four rebars, centered at points (λ0, λ0), (λ0, –λ0), (–λ0, λ0), and (–λ0, –λ0), are present. This configuration represents the unperturbed structure used to compute the inhomogeneous Green function, according to the formulation described in Section 4.10. The crack is modeled as a circular void cylinder with diameter d = 0.6λ0 and centered at point rd = (–0.6λ0, 0.6λ0). The reconstruction results are reported in Figure 10.2. In particular, Figure 10.2a shows the normalized indicator function Ψ, introduced in Section 5.8. As can be seen, a peak is present exactly where the crack is located. The binary map obtained by thresholding the normalized indicator function at Ψth = 0.4 is provided in Figure 10.2b, allowing for a correct identification of the support of the defect.
It is quite evident that microwave techniques are able to detect concealed metallic object, too. See for example the result in Figure 10.3, which has been obtained by the microwave holography system in Figure 9.4. Other accurate images of defects and voids in concrete structures based on experimental data have been obtained by using the planar microstrip slot array shown in Figure 9.8 and are shown in Figure 10.4 (Kim et al. 2003).
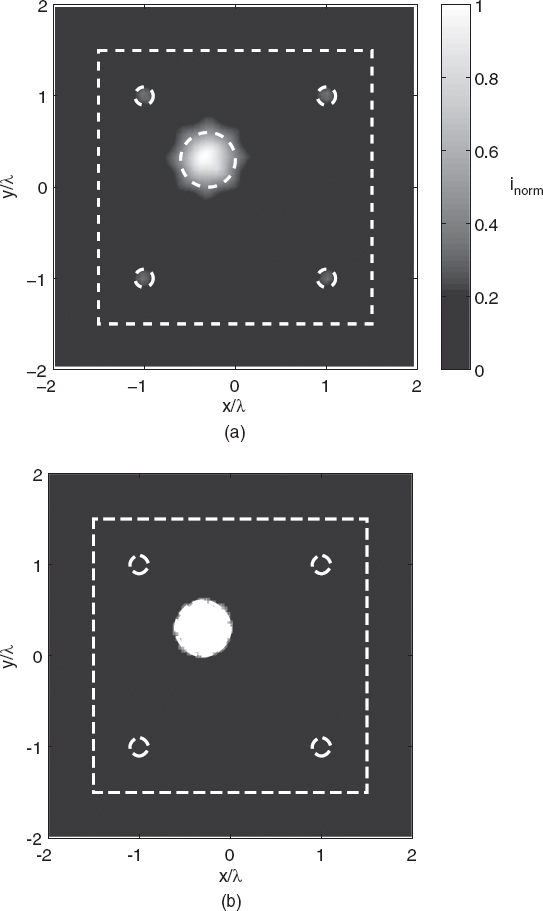
FIGURE 10.2(a) Normalized indicator function obtained by applying the linear sampling method, with detection of a crack inside the concrete pillar of Figure 10.1; (b) reconstructed support of a crack inside the concrete pillar with four rebars of Figure 10.1. (Simulations performed by A. Randazzo, University of Genoa, Italy.)
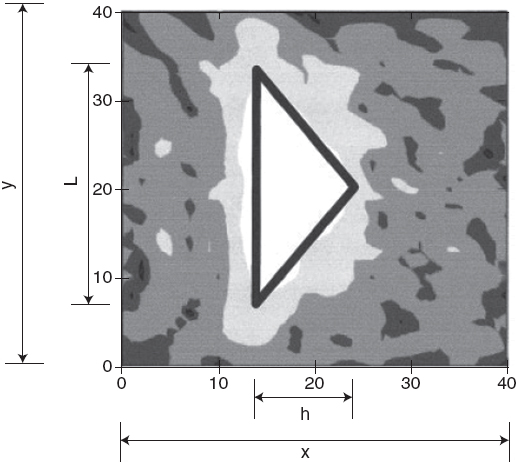
FIGURE 10.3 Reconstructed image of a concealed metal object (10 dB/contour) with x = y = 40cm, L = 36cm, and h = 10cm. [reproduced from M. Elsdon, D. Smith, M. Leach, and S. Foti, “Microwave imaging of concealed metal objects using a novel indirect holographic method,” Microwave Opt. Technol. Lett. 47(6), pp. 536–537 (Dec. 20, 2005), © 2005 Wiley.]
It must be noted that civil structures have been addressed by using inverse scattering techniques in other studies, including that by Catapano et al. (2006), who used a tomographic technique to invert experimental laboratory-controlled data on a multilayer configuration, consisting of air, bricks, and concrete. Further discussion of civil applications can be found elsewhere in the literature (e.g., Mikhnev and Vainikainen 2002, Chang 2005, Zeng et al. 2006).
In the industrial field, another interesting application is related to the inspection of new materials such as ceramics (Bahr, 1978), plastics, and other composites, which can be suitably evaluated at microwave frequencies. In particular, it has been recognized that “the ever expanding materials technology by which lighter, stiffer, stronger and more durable electrically insulating composites are replacing metals in many applications demands alternative inspection techniques to existing NDT approaches. This is due to the fact that the existing standard and well established NDT techniques (developed primarily for inspecting metallic structures) may not always be capable of inspecting these composites” (Zoughi 2000, p. 2). Moreover, the inspection of low-density fiberglass composites, which are widely used as insulating and coating materials, can be very efficiently performed by microwave imaging methods, which can also indirectly monitoring the curing process. To this end, let us consider just one of the results reported (Zoughi 2000), in which the dielectric properties of a fresh liquid resin binder and the same material after 12 days (at ambient temperature) have been studied. It has been found that, at a frequency of 5.5 GHz, ε′r varies from 16.0 to 18.7. This change in the real part of the dielectric permittivity, even for a limited curing at room temperature, is significant and fully compatible with the inspection capabilities of the approaches considered throughout this book.
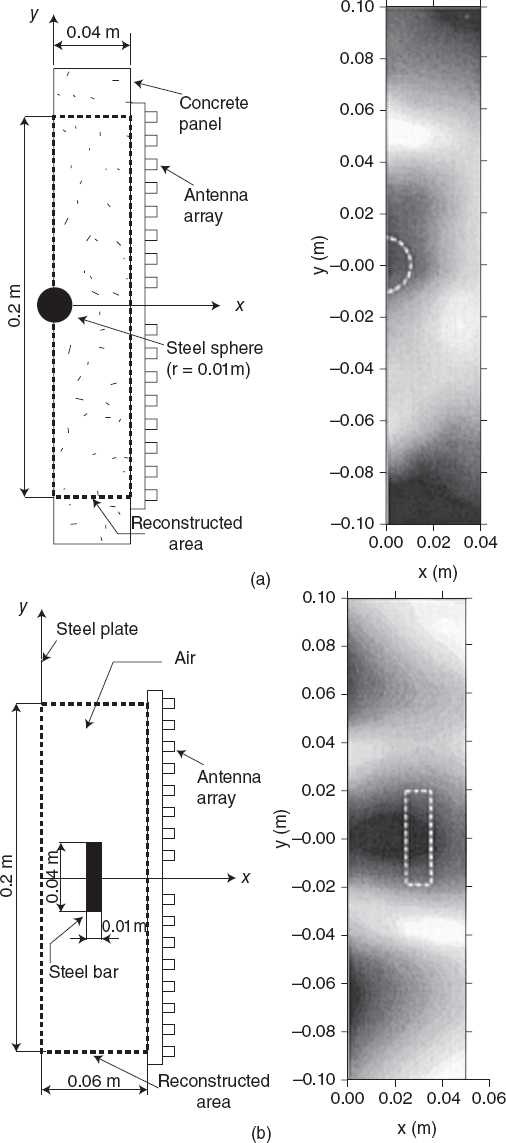
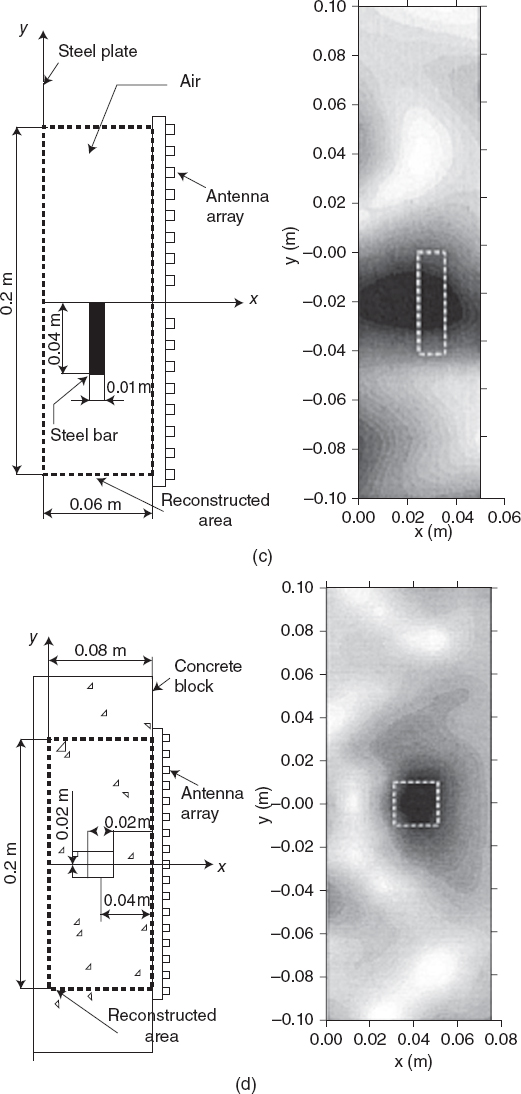
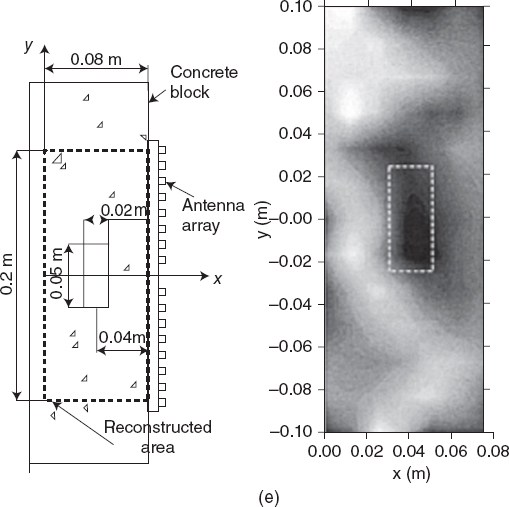
FIGURE 10.4 Reconstructions obtained using the planar array shown in Figure 9.8 in different cases. [Reproduced from Y. J. Kim, L. Jofre, F. De Flaviis, and M. Q. Feng, “Microwave reflection tomographic array for damage detection of civil structures,” IEEE Trans. Anten. Propag. 51(11), 3022–3032 (Nov. 2003), © 2003 IEEE].
Another interesting field for microwave imaging techniques is represented by the wood-processing industry (Bacur 2003), where inverse-scattering-based diagnostic techniques can be used together with microwave inspection methods based on reflection or transmission in order to characterize wood materials and find defects and knots inside slabs and trunks (Lhiaubet et al. 1992, Shen et al. 1994, Eskelinen and Harju 1998, Kaestner and Baath 2005, Salvadé et al. 2007; Pastorino et al. 2007). An example of the dielectric reconstructions obtained by using the tomograph prototype shown in Figure 9.2 is given in Figure 10.5. It involves the nondestructive evaluation of a hole in a wood slab. The slab has a rectangular cross section (dimensions 11.7 × 7.7 cm), and a rectangular hole (dimensions 6 × 3 cm) has been drilled in the sample. The measured scattered data are collected in the L band, and the actual values of the dielectric parameters are εw ≈ 2.2ε0 and electric conductivity σw ≈ 0.04 S/m, which correspond to a penetration depth of δ ≈ 6.5 cm at f = 1.5 GHz and δ ≈ 4.2 cm at f = 3.5 GHz. In order to invert the experimental data, a truncated singular value decomposition has been used. The slab cross section is embedded in a square investigation domain of side 0.16 m and discretized into N = 1600 subdomains.
FIGURE 10.5 Distributions of (a) the reconstructed relative dielectric permittivity and (b) electric conductivity. [Reproduced from A. Salvadé, M. Pastorino, R. Monleone, T. Bartesaghi, G. Bozza, and A. Randazzo, “Microwave detection of dielectric structures by using a tomographic approach,” Proc. IEEE Int. Instrumentation and Measurement Technology Conf. (I2MTC 2008), Victoria, Vancouver Island, Canada, May 12–15, 2008, pp. 1300–1305, © 2008 IEEE.]
In the wood-processing field, microwave imaging techniques can also be of interest for the detection of foreign bodies inside wood trunks, such as bullets, screws, or other debris, which can severely damage carpentry machinery if they are not detected and removed prior to processing (Salvadé et al. 2008).
Detection of inclusions inside plastic materials has also been performed by using a waveguide apparatus (Brovko et al. 2008). In particular, the position and the size of a spherical inclusion in a dielectric sample have been deduced by using an inverse problem by means of an artificial neural network (ANN). The network has been trained by using measured complex reflection and transmission coefficients (which are related to the scattered data) obtained by solving the direct scattering problem by means of a full-wave three-dimensional finite-difference time-domain (FDTD) code. The operating frequency was 915 MHz and allowed the sizes and positions of glass and air spheres of more than 15 mm diameter to be accurately detected in a Teflon block (with relative errors in the coordinates and radius of the center of the inclusion of the order of 0.9–2.2%).
Further applications in the field of material characterization may involve evaluation of the porosity in polymers, ceramics, and other materials, which can become very weak if the porosity level is too high. It has been observed that “porosity often concentrates at specific locations in composite materials (either between plies or at the fiber/matrix interface) and can dramatically lower flexural and shear performance” (Zoughi 2000). Consequently, porosity can render inhomogeneous a given structure, and imaging techniques able to inspect inhomogeneous scatterers can be applied. Since porosity means the presence of air inside the material, the dielectric permittivity and, mainly, the electric conductivity significantly decrease if the porosity level increases. For example, at 10 GHz, a 36% reduction of ε′r has been measured for a specific polymer when the air content was about 49%.
According to Zoughi (2000), microwave techniques can be good candidate techniques for inspection of composites, in particular for the accurate thickness measurement of dielectric layers, such as coatings or layered composites (Mudanyal et al. 2008); for evaluation of disbond and delamination in half-space and stratified materials (Zoughi and Bakhtiari 1990); for the detection of voids, rust, and corrosion (Qaddoumi et al. 2007) under paint and stratified coatings, for the inspection of thick plastics and glass-reinforced composites; and for several other diagnostic objectives (Bozza et al. 2007a,b) that can be performed both during the material production and during the service or use. In the former case, the inspection is strictly related to the procedures for process control (Zoughi, 2000).
Finally, an additional proposed application is in the food industry, such as detection of the sugar content in fruits. In particular, the use of the chirp radar technique (briefly mentioned in Section 5.9) has been exploited. Watanabe et al. (2006) considered some fruits (e.g., pears and apples), whose sugar content varies between 8% and 22%. As a result, the sugar content directly affects the value of the complex dielectric permittivity, and, consequently, can be detected by using microwaves. The final image is a gray-level image [the correlation coefficients between the sugar content and the corresponding gray level of the final images result in the range 0.36–0.73 for Japanese pears and less than 0.7 for other pears (Watanabe et al. 2006)]. In the authors' opinion (Watanabe et al. 2006) “It seems to be difficult to visualize the sugar content distribution with its absolute value. Generally speaking, a fruit contains sugar as various chemical substances and those substances change their structure according to the growth. However, it will not be difficult to designate the sugar content of the same kind of fruits by comparing the gray levels.”
10.2 MEDICAL APPLICATIONS OF MICROWAVE IMAGING
The preliminary ideas concerning the application of microwave techniques to medical imaging have been summarized in a book by Larsen and Jacobi (1986). When that pioneering work appeared, it seemed that techniques based on interrogating microwaves would have provided in a short time new and powerful tools for medical diagnostics. However, more than 20 years later, microwave medical imaging is often still considered an emerging technique, since accurate and effective dielectric reconstructions are still very difficult to obtain. One should consider, for comparison, the developments in the area of X-ray computerized tomography. Essentially, the basic formulation of computerized tomography, specifically Radon transform, considered to be useless for some decades, was rediscovered in the 1970s and, a few years later, tomographs were available in several advanced diagnostic units of major hospitals; now, computerized tomography has become a routine diagnostic methodology. The history of medical microwave imaging is clearly far different. Nevertheless, some quite interesting results using microwaves have been obtained, particularly in the field of breast cancer detection. The important fact is that some of the factors that have so far limited the real applicability of microwave medical imaging tend to further reduce their impact on the development of imaging systems. This delineates an optimistic perspective, which is supported by the significant achievements in both the design and realization of efficient illumination/measurement systems and the development of fast, effective, and reliable reconstruction procedures, some of them covered by this monograph. At the same time, the medical community is presently looking for new diagnostic tools with high sensitivity and specificity. It is a well-known fact that the early-stage detection of cancer is the fundamental issue not only for long-term survival of patients but also for their life quality. This is particularly true for breast cancers, as this disease is one of the main causes of death among women. Unfortunately, mammography, which is the main actual diagnostic modality, still exhibits a relatively high false-negative rate, resulting in a large number of unnecessary biopsies (Huynh et al. 1998; Li et al. 2005). Incidentally, it should be added that mammography is usually rather uncomfortable for patients, due to breast compression.
In this scenario, the potentialities of microwave imaging for medical diagnosis are widely recognized, since this technique exhibits some unique features from which medical diagnostic units should realize special benefits.
First, microwaves can directly provide the distributions of the dielectric parameters (dielectric permittivity and electric conductivity). This information cannot be obtained using any other different technique. In addition, the retrieved values of the dielectric parameters can be directly related not only to the various biological tissues but also to specific pathologies (Lazebnik et al. 2007). For example, some studies indicate that the contrast in dielectric properties of malignant and normal breast tissues is greater than 2:1 in the radiofrequency–microwave frequency range, due to the increased water content in neoplastic tissues resulting from the protein hydration and vascularization of the cancerous tissues. On the contrary, mammography, as well as magnetic resonance imaging (MRI), are judged not sensitive or specific enough and too operator-dependent (Foster and Schwan 1989; Li et al. 2005).
Moreover, it has been argued that microwaves “can exploit strong indicators of malignancy associated with physical or physiological factors of clinical interest, such as water content, vascularization/angiogenesis, blood-flow rate, and temperature” (Li et al. 2005, p. 20).
Significant changes in dielectric properties have been noted in other cases, for example, for normal bones versus leukemic marrow (Colton and Monk 1995). In addition, considering again the contrast in biological tissues (in terms of the values of the dielectric permittivity and the electric conductivity), the use of gas-filled microbubbles, metallic nanoparticles, and single-walled carbon nanotubes as contrast agents has recently been proposed for microwave imaging, since it seems possible that their accumulation in a tumor enhances the contrast between normal and malignant tissues (Mashal et al. 2009, Shea et al. 2009).
Another fundamental aspect is that microwaves are nonionizing radiations and interrogating signals with very low levels of power can safely be applied for diagnostic purposes. This is safe for both patients and operators and could also allow for quasi-continuous monitoring. In addition, the costs of the apparatuses can be very limited as compared with those needed for the most consolidated actual imaging systems.
Furthermore, although microwave imaging exhibits a limited spatial resolution when compared with X-ray-based diagnostic techniques or other advanced imaging techniques currently adopted, the modern development of focusing procedures, as well as of tomographic approaches based on nonlinear formulations, has definitely proved the capabilities of subwavelength resolution of microwave imaging techniques. Incidentally, microwaves can in principle be applied in conjunction with other techniques, combining good resolution with high specificity.
It has also been observed that contrast between normal and malignant dielectric parameters is higher at frequencies different from those of microwaves (Lazebnik et al. 2008) and that other electromagnetic techniques can be applied in the medical field (e.g. electrical impedance tomography operating at lower frequency or near-infrared tomography, which can exploit the higher contrast due to higher absorption in DNA, protein, and hemoglobin of malignant tissues). Nevertheless, the microwave range represents a good compromise between resolution and penetration depth (Li et al. 2005, Lin, 1985).
Among the various diagnostic applications, microwave imaging has been proposed, for example, for the detection of myocardial ischemia and infarction (Semenov et al. 2000). It has been shown that changes in myocardial dielectric properties of ~10% arise in cases of ischemia as well as in chronic infarction. These results are mainly related to canine and pig studies at frequencies in the 0.9–2.36 GHz band, irradiated by waves corresponding to 1W of transmitted power. A circular configuration has been used to image a phantom of the heart (εr = 70 − j9 at 2.36 GHz), in which some inhomogeneities have been inserted in order to simulate specific pathological situations (in particular, an acute ischemic zone and a chronic infarcted zone). Moreover, a situation in which infarcted and ischemic tissues are present has also been considered, since a chronic infarcted zone surrounded by an ischemic area may cause arrhythmic problems (Semenov et al. 2000). Consequently, the phantom structure under test and related studies are important in the light of potential arrhythmia detection as well.
Let us now provide some examples of the assumptions made in evaluating the various proposed methodologies. These examples are provided only for illustration purposes, and the reader can refer to the cited literature for details. In applying the confocal method to breast cancer detection, the patient can be in a supine position in order to better detect tumors near the chest wall or in a prone position (Xie et al. 2006). In the latter case, holes are present in the treatment table in order to access to the full breast volume. Various models of the breast, both two-dimensional and three-dimensional ones, have been considered in the literature for simulation and testing purposes. In the case in which the patient is lying in a supine position, a commonly considered two-dimensional model assumes the breast profile to be approximated by a semicircle, whereas the corresponding three-dimensional model considers a hemispherical breast. Concerning the imaging approach, some improved procedures have been proposed with respect to the basic formulation. In particular, the use of a matched filter for estimation of propagation times from the elements of the array and the skin–breast interface has been proposed, which is used to shape the interface and compensate for the response of this interface “which is at least one order of magnitude larger that any tumor response” (Li et al. 2005, p. 20).
In the study by Xie et al. (2006), for example, the hemispherical model has a radius of 10 cm and includes randomly distributed glandular and fatty breast tissues. In addition, 2-mm-thick skin and 4- and 6-mm spherical models of the tumors to be detected are assumed.
It should be mentioned that more realistic models of the human body have also been developed, not only for imaging purposes but also for other applications, such as numerical computation of the specific absorption rate (SAR) due to the exposure to electromagnetic field (this computations requires the solution of a direct scattering problem). Zastrow et al. (2008) anatomically constructed realistic breast phantoms of different shape and sizes, starting with MRI images of prone patients and taking into account the dispersivity of the biological tissues.
Concerning the dielectric properties of the biological tissues, the models are based on extensive studies based on dielectric measurements (Gabriel 1996, Lazebnik et al. 2007). For example, Xie et al. (2006) chose the following values for various biological tissues: external medium (εr = 9, σ = 0S/m), chest wall (εr = 50, σ = 7S/m), skin (εr = 36, σ = 4S/m), fatty breast tissue (εr = 9, σ = 0.4S/m), nipple (εr = 45, σ = 5S/m), glandular tissue (εr = 11–15, σ = 0.4–0.5S/m), and tumor (εr = 50. σ = 4S/m). As mentioned, working in a wide band of frequencies, dispersion of the biological tissues must be taken into account. Usually, a first-order Debye-type dispersion model is assumed (see Chapter 2), but higher-order models can also be considered.
In most cases the transmitting and receiving antennas are simulated by line-current sources (two-dimensional problems) or point sources (three-dimensional problems), although more accurate numerical descriptions are possible. For example, the imaging configuration adopted by Xie et al. (2006) consists of 72 elements (point sources), located on six circles with different radii, such that the distance from the skin is always 1 cm. The centers of the circles are on a line (the symmetry axis of the hemispherical breast model), and 12 antennas are located on each circle. Along the symmetry axis, the circles are spaced at 0.5 cm. The 72 elements emit sequentially and, for each emission, the scattered field is collected by all the 72 elements. A Gaussian pulse of about 120 ps is used, with a maximum signal at 5 GHz. At this frequency, the penetration depth [equation (10.1.11)] in the breast tissue is δ ≈ 1.1 cm.
Preliminary experiments concerning the confocal method described in Section 5.9 have also been performed by using a multilayer phantom made of materials with dielectric properties similar to those of the normal breast (soybean oil, with dielectric properties similar to those of fat with very low water content, εr = 2.6. σ = 0.05 S/m at 6 GHz) and skin tissues (1.5-mm-thick FR4 glass epoxy), with a small synthetic tumor (diecetin–water solution), suspended in liquid (Li et al. 2004). The antenna used for the ultrawideband data acquisition was a miniaturized pyramidal horn with a single ridge and curved launching plane terminated with Chip resistors (Li et al. 2003). A square planar 6 × 6 cm array was synthesized by moving the horn antenna. The measurements were performed by using a network analyzed with a frequency sweep in the range 1–11 GHz (201 samples). The “signal to clutter ratio” (the ratio of the maximum received energy to the energy received in the tumor-free case) was 8.4 dB, sufficient for allowing tumor localization.
In order to reduce the coupling loss due to dielectric discontinuity represented by the biological body, the antennas and the target to be inspected are usually assumed to be immersed in a medium with a dielectric permittivity similar to that of the breast (Xie et al. 2006, Chen et al. 2008). Li et al. (2004), for example, used the same liquid for modeling the breast tissue.
Moreover, in experimental reconstructions, the biological body is often immersed in water. In this case, it must be understood that the dielectric parameters of the water depends not only on the frequency of the incident field but also on the temperature. In the experiments performed using the circular array described in Section 9.2, the temperature uniformity is maintained within ±1 °C (Joachimowicz et al. 1998). The sensitivity of the dielectric permittivity versus the temperature have been assumed (Joachimowicz et al. 1998) to be governed by temperature coefficients such as around the ambient temperature the real and imaginary parts of the relative dielectric permittivity changes of about −0.5% and +2% for any degree of temperature increment.
An example of a reconstruction obtained by using the bowtie-type antenna array discussed in Chapter 9 (Fig. 9.7) is shown in Figure 10.6 (Hernandez-Lopez et al. 2003). The images have been constructed using a beamforming approach and starting with a numerical model of the breast similar to the one just discussed. It consists of a 4-cm-radius half-sphere attached to an infinite half-space characterized by the same dielectric parameters of the healthy tissue. Moreover, a layer of skin tissue is added. The tumor is modeled by a sphere located at an arbitrary position inside the breast. Both healthy and cancerous breast tissues are characterized by dispersive Debye models. In the simulation shown in Figure 10.6, the distance between the center of the breast and the center of the tumor is about 2.1 cm. The transmitting/receiving array is placed 1 mm above the skin. The system rotates around the breast (see Fig. 9.7), and four perpendicular measurement positions are considered, which correspond to 64 measured signals.
Figure 10.6 provides a three-dimensional distribution of the (normalized) reconstructed intensities. In particular, three sections are shown, in which the light patches indicates the tumor regions, which are located quite accurately. In particular, the distance between the original and reconstructed centers of the tumor is 2.25 mm, which must be compared with the maximum error due to the discretized mesh. In this case, the numerical forward simulations have been performed by means of a FDTD code with a mesh consisting of 96 × 96 × 58 (cubic) Yee cells of side Δ = 1 mm, and a temporal step assumed equal to 1.83 ps. Accordingly, the maximum discretization error is equal to 2![]() Δ ≈ 3.5 mm.
Δ ≈ 3.5 mm.
Sensitivity issues of microwave imaging systems are also very important. Essentially, the question is as follow: Considering the current generation of illumination/measurement systems, how small can a discontinuity be inside a biological body while still allowing the detection of the field that it scatters? This topic, which deserves further investigation, has been addressed, for example, by Zhang et al. (2003) by means of numerical simulations of the forward scattering problem and considering a three-dimensional model of the breast. The direct scattering problem has been solved by using the method of moments with a solver based on a biconjugate-gradient procedure. In their opinion, considering the changes in the scattered field outside the biological body and assuming a dynamic range of a network analyzer of about −100 dB or better, tumors with a diameter ≥6 mm at 800 MHz and ≥2 mm at 6 GHz are detectable in ideal situation, although Zhang et al. (2003) state that “in reality, it may be too optimistic [...] due to the spurious scattering in the environment.” Finally, it should be noted that if the contrast between malignant and normal tissues decreases, the minimum detectable volume increases, since the scattered signal, according to equation (2.7.2), for a small scattering target of volume ΔV is essentially proportional to τΔV, where τ is proportional to the contrast value (Zhang et al. 2003).
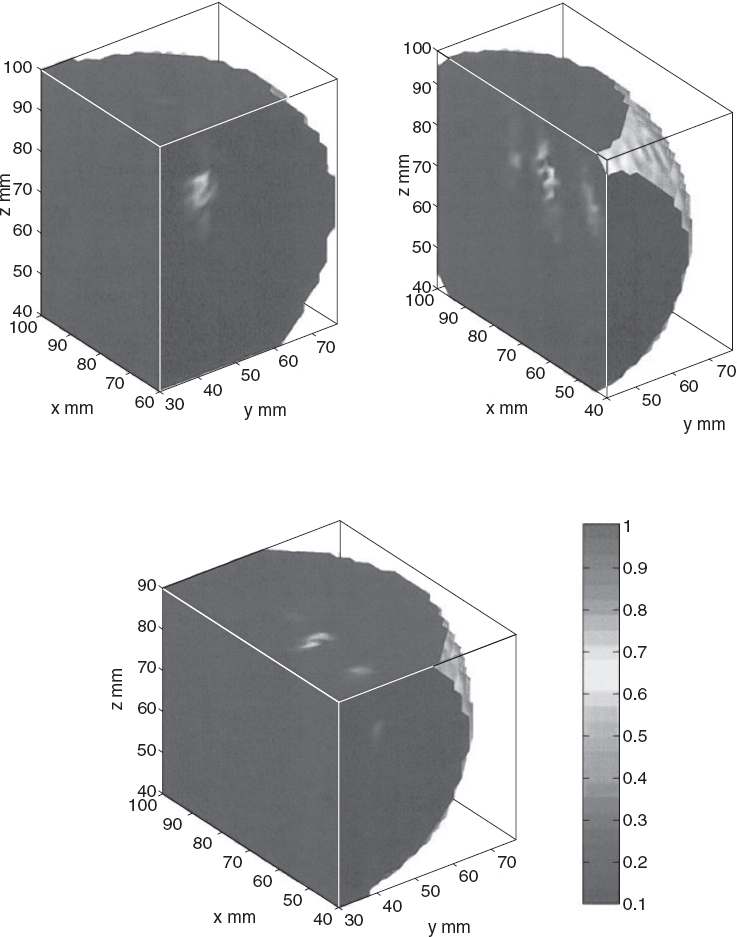
FIGURE 10.6 An example of a reconstructed model of a spherical tumor, obtained by considering the array of bowtie antennas shown in Figure 9.7 [reproduced from M. A. Hernández-López, M. Quintillán-González, S. González García, A. Rubio Bretones, and R. Gómez Martín, “A rotating array of antennas for confocal microwave breast imaging,” Microwave Opt. Technol. Lett. 39, 307–311 (Nov. 20, 2003), © 2003 Wiley.]
The idea of combining different imaging modalities (discussed in Chapter 8) can also be a good solution in the medical field. For example, the beam-forming technique briefly described in Chapter 5, which does not provide the distribution of the dielectric parameters of the biological tissues, can be used to detect the positions of the most relevant scatterers inside a biological body and provide an estimation of their spatial dimensions. Successively, a quantitative imaging technique (Chapter 6 and 7) can be applied. In the study by Sabouni et al. (2006), after the scatterers (e.g., tumors) were located, the detected areas were inspected by using an iterative procedure based on a genetic algorithm (see Section 7.3), whereas the forward scattering problem was solved at each iteration by using a FDTD code (including a first-order dispersion relation of Debye type). By using this method, a 0.9-cm circular tumor (εr = 54, σ = 0.7S/m) was satisfactory reconstructed in a quantitative way in a two-dimensional model (Sabouni et al. 2006).
The detection of tumors has been also experimentally pursued using the prototype shown in Figure 9.3. Excised specimens of biological tissues are reconstructed starting with the inversion of measured data. The distorted Born iterative method (Section 6.6) has been used for this task. Figures 10.7 and 10.8 provide two examples of the reconstructions obtained (Bindu and Mathew 2007). An experimental model, consisting of a bath of vegetable oil (εr ≈ 54), has been used to represent both the immersion liquid and the healthy tissue in the simplified breast phantom developed by (Elsdon et al. 2006) and inspected by using the indirect holography schematized in Figure 9.4 (frequency: f = 8.59 GHz, scanning aperture: 40 × 40 cm. The recorded data and the reconstructed image of the dielectric discontinuity are presented in Figure 10.9.
Other methods have been applied to detect scatterers representing tumor models. One of them is the previously mentioned level-set method (references for this method are cited at the end of Section 5.8), which has been combined with the MUSIC algorithm (Irishina et al. 2006). An image of the retrieved dielectric permittivity distribution is shown in Figure 10.10. The linear sampling method (Section 5.8) has also been applied. Figure 10.11 gives an example of the results obtained by using this qualitative technique in conjunction with the inhomogeous Green function approach described in Section 4.10, and considering the detailed three-dimensional breast model developed by Zastrow et al. (2008). In particular, Figures 10.11a,b provide the distributions of the relative dielectric permittivity and of the electric conductivity in a two-dimensional section of the model (used for the computation of Green's function at a frequency f = 3 GHz). Figure 10.11c gives the amplitude distribution of the indicator function Ψ (see Section 5.8), which has been obtained after severely perturbing the input data (the computed values of the scattered electric field in the observation domain) by an additive random noise of 5%. The indication function clearly allows for the localization of a discontinuity (a circular model of a tumor with a radius equal to 0.2 cm). In particular, the error in the estimation of the tumor center is about 0.1 cm.
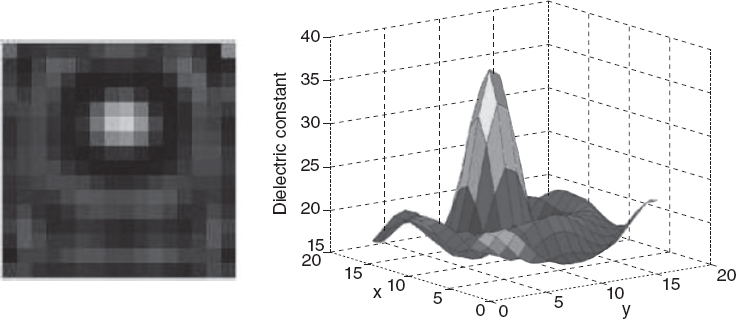
FIGURE 10.7 2D tomographic image and permittivity profile of benign breast tissue of radius ≈0.5 cm inserted in normal breast tissue sample of radius ≈1 cm, of patient 2. [Reproduced from G. Bindu and K. T. Mathew, “Characterization of benign and malignant breast tissues using 2-D microwave tomographic imaging,” Microwave Opt. Technol. Lett. 49, 2341–2345 (2007), © 2007 Wiley.]
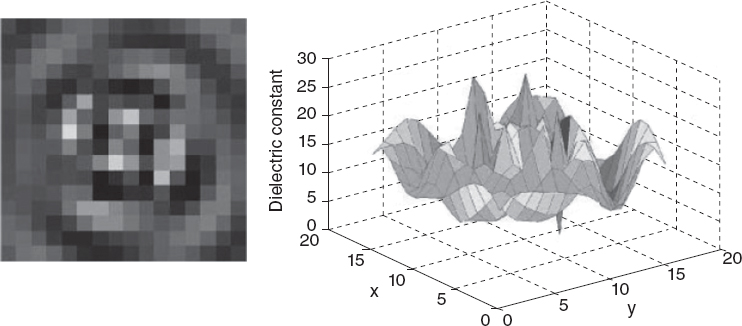
FIGURE 10.8 2D tomographic image and permittivity profile of malignant breast tissue of radius ≈0.5 cm inserted in normal breast tissue sample of radius ≈1 cm, of patient 3. [Reproduced from G. Bindu and K. T. Mathew, “Characterization of benign and malignant breast tissues using 2-D microwave tomographic imaging,” Microwave Opt. Technol. Lett. 49, 2341–2345 (2007), © 2007 Wiley].
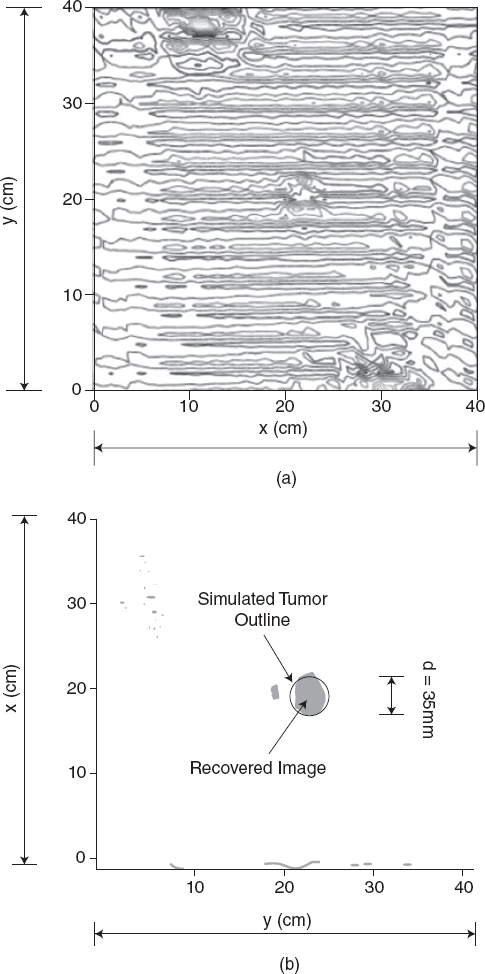
FIGURE 10.9 (a) Recorded intensity pattern and (b) reconstructed image of a simulated breast tumor (x = y = 40cm, d = 35 mm). [Reproduced from M. Elsdon, D. Smith, M. Leach, and S. J. Foti, “Experimental investigation of breast tumor imaging using indirect microwave holography,” Microwave Opt. Technol. Lett. 48, 480–482 (2006) © 2006 Wiley.]
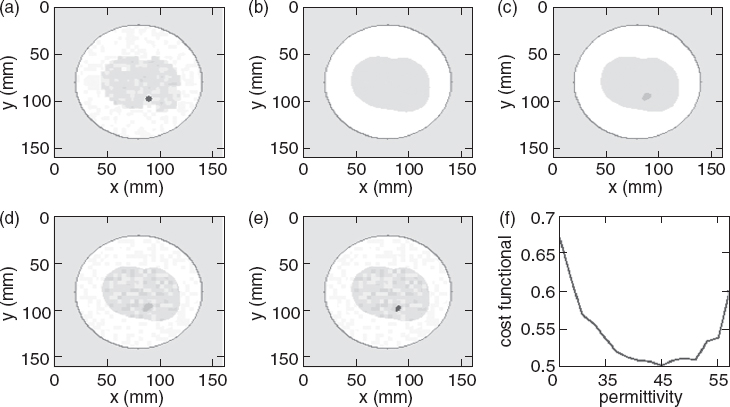
FIGURE 10.10 Final permittivity profiles at the end of each of the four stages of the algorithm (level-set method). (a) true permittivity profile of the breast model with tumor of εs = 50; (b) final profile of stage 1; (c) final profile of stage 2; (d) final profile of stage 3; (e) final profile of our reconstruction algorithm, which is the profile corresponding to the minimum of the curve shown in image (f) (here at permittivity value equal to 45); (f) final cost versus tumor permittivity (stage 4 result). [Reproduced from N. Irishina, O. Dorn, and M. Moscoso, “Level-set techniques for microwave medical imaging,” Proc. Appl. Math. Mech. 7 (1), 1151601–1151602 (Dec. 2007).]
Finally, it should be noted that other excellent reconstruction results have been obtained by using beamforming and confocal imaging techniques. As mentioned at the end of Section 5.9, the scientific literature devoted to these approaches is now really wide. Consequently, the reader can refer to the numerous papers cited throughout this section and in Section 5.9, whereas other important considerations concerning medical applications of microwave imaging can be found elsewhere in the literature (Semenov et al. 2002, Fear et al. 2003, Paulsen et al. 2005, Bertero and M. Piana 2006, Williams et al. 2006, Arunachalam et al. 2008, Lim et al. 2008, Meaney et al. 2007, Irishina et al. 2009, Salvador and Vecchi 2009).
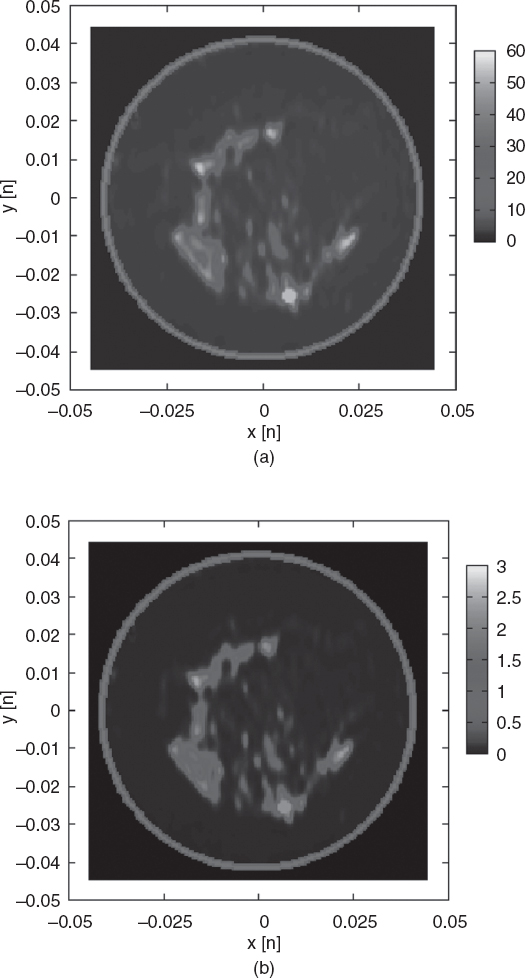
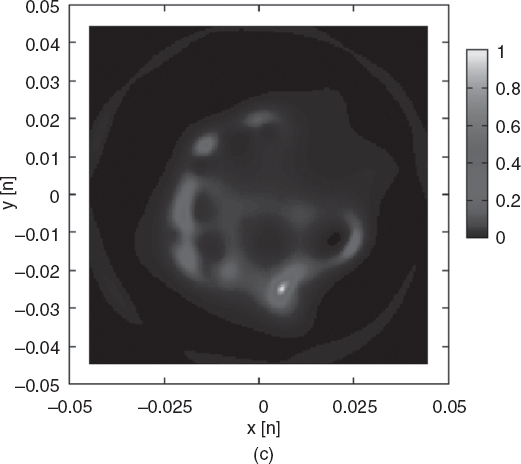
FIGURES 10.11 Two-dimensional reconstruction of a circular model of a tumor (radius 0.2 cm) inside a slide of an accurate numerical breast phantom (Zastrow et al. 2008); linear sampling method/inhomogeneous Green's function. (a), (b) original distributions of the relative dielectric permittivity and of the electric conductivity (S/m); (c) indicator function. Additive random noise (5%). (Simulation performed by G. Bozza, University of Genoa, Italy.)
10.3 SHALLOW SUBSURFACE IMAGING
The detection and identification of buried objects is very important in geophysical prospections, as well as in humanitarian applications and in the inspection of archeological sites. In particular, electromagnetic techniques are able to detect, for example, voids, tunnels, pipes, cables, and other civil or military structures. The demining activity is also another very important application. It is well known that ground-penetrating radar (GPR) represents a very efficient tool for this kind of applications. More recently, however, in order to improve the detection capabilities of the original GPR approach based on a direct evaluation of the so-called radiograms, which requires specific experience in the interpretation of final images, several inversion procedures have been proposed. In implementing these procedures, the localization and identification processes are treated as inverse scattering problems, essentially as described in the previous sections (D'Errico et al. 1993, Cassidy 2007, Bozza et al. 2007c). In particular, at higher frequencies, the imaging is limited to shallow subsurface detection, which is of paramount importance in several cases (e.g., demining or pollution evaluations).
Concerning the adopted antennas, in order to radiate and receive wideband signals, according to the discussion in Section 9.3, they are essentially the same as those used in radar applications. In particular, for subsurface detection purposes, the most frequently used are resistively loaded dipoles, biconical, Vivaldi, and bowtie antennas. Bowtie antennas have been used, for example, in a prototype of an imaging system for buried-object detection, which has been developed by Pichot et al. (2004). In that apparatus, coaxial fed bow-tie microstrip antennas are used as transmitting antennas in the frequency band 0.3–1.3 GHz, with a linear polarization and a low reflection coefficient with a standing-wave ratio (SWR) < 2.
At lower frequencies (which actually should be outside the frequency range considered in the present monograph), similar approaches can be considered. One of them is the very-early-time electromagnetic (VETEM) system (Cui et al. 2000, 2001), which operates from several tens of kilohertz to several tens of megahertz and has potential environmental applications that include “delineation of the boundaries of waste-burial pits and trenches, characterization of the contents of those pits and trenches, measurement of the thickness and assessment of the integrity of clay caps, mapping liquid-spill plumes, ground-injection monitoring, and so on” (Cui et al. 2000, p. 17).
Two examples of buried-object reconstruction are now provided. They concern far different techniques. The first example is related to the inversion of real data collected in a cross-borehole configuration (see Section 4.5 and Fig. 4.9). The reconstruction results are presented in Figures 10.12 and 10.13 (Tarnus et al. 2004).
The second example involves the monitoring of fluid movements in a reservoir. The configuration is still of borehole type, but both single-hole and cross-borehole imaging modalities are considered. The results provided refer to numerical simulations in which a 2.5-dimensional problem is assumed (Abubakar et al. 2006). In the cross-well inversion experiment, there are 29 sources uniformly spaced inside the left well bore (x = −25 m), from y = −70 m up to y = 70 m. For each source, 30 receivers are used to measure the scattered field. The receivers are located inside the right well bore (x = 25 m), from y = −72.5 m up to y = 72.5 m. The source and receiver wells are denoted by dashed lines in Figure 10.14. The operating frequency is 500 Hz, and the rectangular investigation domain (subdivided into 32 × 48 square pixels) has dimensions of 80m in the x direction and 120 m in the y direction. It should be noted that the discretization step considered (2.5 m) represents about 5% of the well spacing. For this configuration, the final reconstructed images are reported in Figures 10.14–10.16.
Another important application is represented by estimation of the water lost by pipes of aqueducts, which has a strong social impact in regions where the availability of water is limited (Catapano et al. 2006). In this case, since the water is usually leaking under the pipe, it is quite difficult to detect it from common radiograms. Tomographic imaging techniques can represent a good solution. Moreover, since the position and dimensions of the pipe can be known to some extent, it can be fruitful to consider an approach like the one described in Section 4.10. In particular, the Green function for the unperturbed structure (i.e., soil and pipe) can be computed. Consequently, the medium “soil and pipe” is now the propagation medium for electromagnetic waves. This approach has been followed in the study by Catapano et al. (2006), where, after neglecting the effects of the air–soil interface and assuming the pipe to be approximated by an ideal circular cylinder, Green's function has been analytically computed.
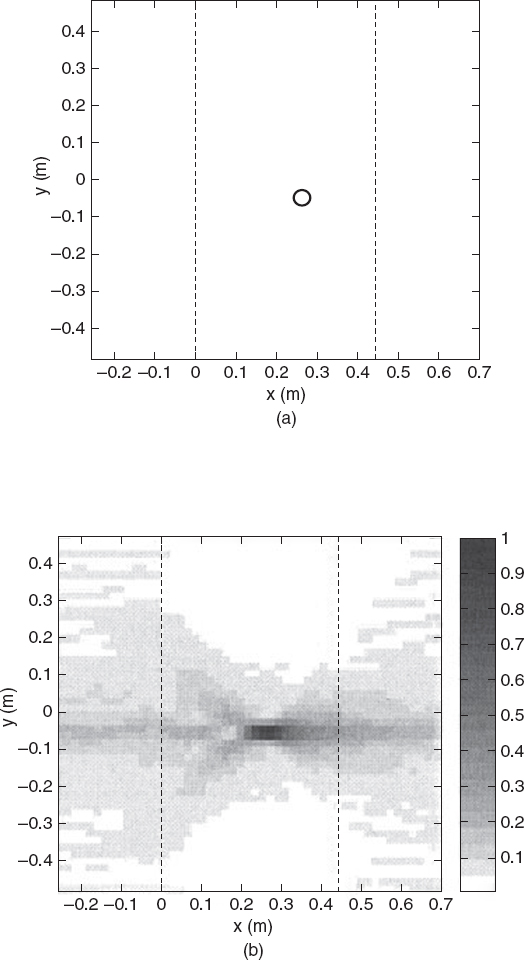
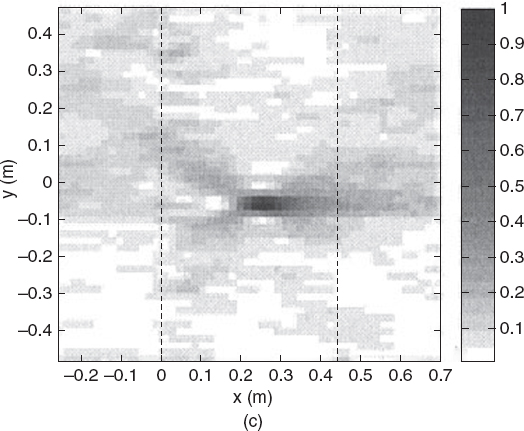
FIGURE 10.12 (a) Geometry of a transverse magnetic tomography with a 4-cm cylinder; (b) numerical and (c) experimental results for nine frequencies (400–480 MHz). [Reproduced from R. Tarnus, X. Dérobert, and Ch. Pichot,” Multifrequency microwave tomography between boreholes,” Microwave Opt. Technol. Lette. 42(1), 4–8 (July 2004), © 2004 Wiley.]
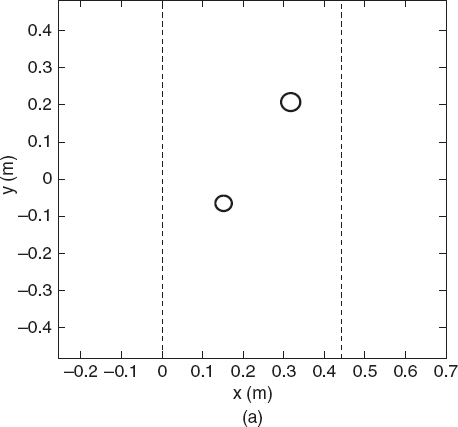
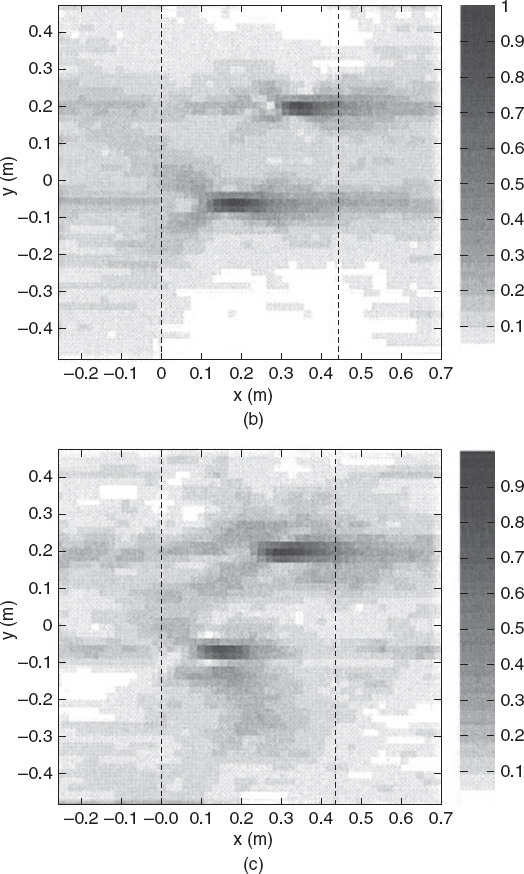
FIGURE 10.13 (a) Geometry of a transverse magnetic tomography with two 4-cm cylinders; (b) numerical and (c) experimental results for nine frequencies (400–480MHz). [Reproduced from R. Tarnus, X. Dérobert, and Ch. Pichot,” Multifrequency microwave tomography between boreholes,” Microwave Opt. Technol. Lette. 42(1), 4–8 (July 2004), © 2004 Wiley.]
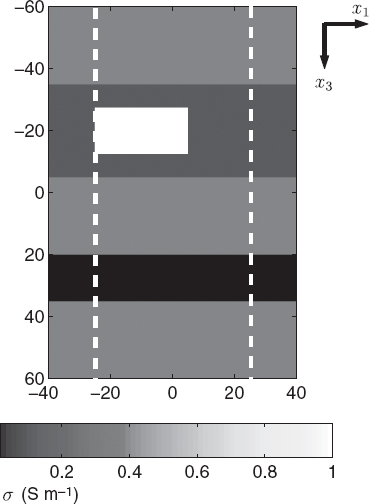
FIGURE 10.14 The conductivity distribution of the test configuration. The well bores are denoted by the dashed lines and are located at x = –25 m and x = 25 m. [Reproduced from A. Abubakar, P. M. van den Berg, and T. M. Habashy, “An integral equation approach for 2.5-dimensional forward and inverse electromagnetic scattering,” Geophys. J. Int. 165(3), 744–762 (2006), © 2006 Wiley.]
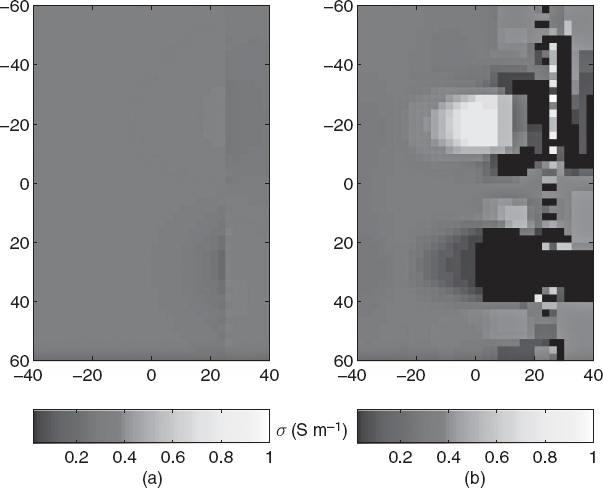
FIGURE 10.15 The conductivity σ (S/m) distribution of the backpropagation (a) and the full inversion (b) from cross-well data without invoking reciprocity. [Reproduced from A. Abubakar, P. M. van den Berg, and T. M. Habashy, “An integral equation approach for 2.5-dimensional forward and inverse electromagnetic scattering,” Geophys. J. Int., 165(3), 744–762 (2006), © 2006 Wiley.]
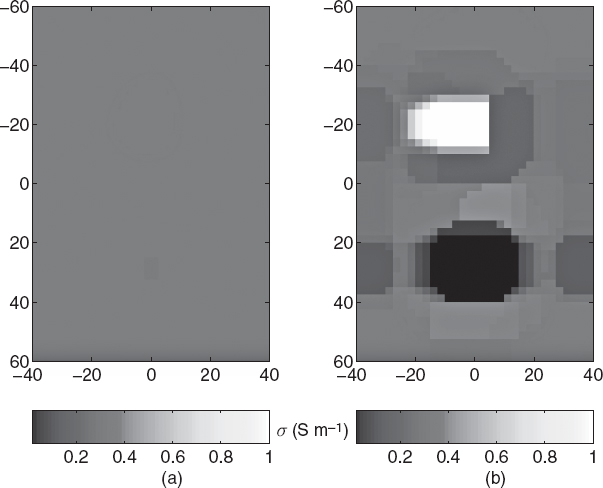
FIGURE 10.16 The conductivity σ (S/m) distribution of the backpropagation (a) and the full inversion (b) from cross-well data invoking reciprocity. [Reproduced from A. Abubakar, P. M. van den Berg, and T. M. Habashy, “An integral equation approach for 2.5-dimensional forward and inverse electromagnetic scattering,” Geophys. J. Int. 165(3), 744–762 (2006), © 2006 Wiley.]
REFERENCES
Abubakar, A., P. M. van den Berg, and T. M. Habashy, “An integral equation approach for 2.5-dimensional forward and inverse electromagnetic scattering.” Geophys. J. Int. 165, 744–762 (2006).
Arunachalam, K., L. Udpa, and S. S. Udpa, “A computational investigation of microwave breast imaging using deformable reflector,” IEEE Trans. Biomed. Eng. 55, 554–562 (2008).
Bacur, V., Nondestructive Characterization and Imaging of Wood, Springer, Berlin, 2003.
Bahr, A. J., “Nondestructive microwave evaluation of ceramics,” IEEE Trans. Microwave Theory Tech. 26, 676–683 (1978).
Bertero, M. and M. Piana, “Inverse problems in biomedical imaging: Modeling and methods of solution,” in Complex Systems in Biomedicine, A. Quarteroni, L. Formaggia, and A. Veneziani, eds., Springer, Milan, 2006.
Bindu, G. and K. T. Mathew, “Characterization of benign and malignant breast tissues using 2-D microwave tomographic imaging,” Microwave Opt. Technol. Lett. 49, 2341–2345 (2007).
Bolomey, J.-C., D. Lesselier, C. Pichot, and W. Tabbara, “Spectral and time domain approaches to some inverse scattering problems,” IEEE Trans. Anten. Propag. 29, 206–212 (1981).
Bozza, G., C. Estatico, M. Pastorino, and A. Randazzo, “Electromagnetic imaging for non-intrusive evaluation in civil engineering,” Proc. 2007 IEEE Int. Workshop on Imaging Systems and Techniques, Krakow, Poland, 2007 (2007a).
Bozza, G., C. Estatico, M. Pastorino, and A. Randazzo, “Microwave imaging for non–destructive testing of dielectric structures: Numerical simulations by using an Inexact-Newton method,” Mater. Eval. 65, 917–922 (2007) (2007b).
Bozza, G., C. Estatico, M. Pastorino, and A. Randazzo, “Application of an inexact-Newton method within the second-order Born approximation to buried objects,” IEEE Geosci. Remote Sens. Lett. 4, 51–55, (2007) (2007c).
Brovko, A. V., E. K. Murphy, M. Rother, H. P. Schuchmann, and V. V. Yakovlev, “Waveguide microwave imaging: Spherical inclusion in a dielectric sample,” IEEE Microwave Wireless Compon. Lett. 18, 647–649 (2008).
Cassidy, N. J., “A review of practical numerical modeling methods for the advanced interpretation of ground-penetrating radar in near-surface environments,” Near-Surface Geophys. 5, 5–22 (2007).
Catapano, I., L. Crocco, R. Persico, M. Pieraccini, and F. Soldovieri, “Linear and nonlinear microwave tomography approaches for subsurface prospecting: Validation on real data,” IEEE Anten. Wireless Propag. Lett. 5, 49–53 (2006).
Chang, K., ed., Encyclopedia of RF and Microwave Engineering, Wiley, New York, 2005.
Chen, Y., E. Gunawan, K. S. Low, S.-C. Wang, C. B. Soh, and T. C. Putti, “Effect of lesion morphology on microwave signature in 2-D ultra-wideband breast imaging,” IEEE Trans. Biomed. Eng. 55, 2011–2021 (2008).
Chew, W. C., Waves and Fields in Inhomogeneous Media, Van Nostrand Reinhold, New York, 1990.
Colton, D. and P. Monk, “The detection and monitoring of leukemia using electromagnetic waves: Numerical analysis,” Inverse Problems 11, 329–342 (1995).
Cui, T. J. et al., “Numerical modeling of an enhanced very early time electromagnetic (VETEM) prototype system,” IEEE Anten. Propag. Mag. 42, 17–27 (2000).
Cui, T. J., W. C. Chew, A. A. Aydiner, D. L. Wright, and D. V. Smith, “Detection of buried targets using a new enhanced very early time electromagnetic (VETEM) prototype system,” IEEE Trans. Geosci. Remote Sens. 39, 2702–2712 (2001).
D'Errico, M. S., B. L. Douglas, and H. Lee, “Subsurface microwave imaging for nondestructive evaluation of civil structures.” Proc. IEEE Int. Conf. Acoustics, Speech, and Signal Processing, Minneapolis, MN, USA, 1993, vol. 5, pp. 453–456.
Elsdon, M., D. Smith, M. Leach, and S. Foti, “Microwave imaging of concealed metal objects using a novel indirect holographic method.” Microwave Opt. Technol. Lett. 47, 536–537 (2005).
Elsdon, M., D. Smith, M. Leach, and S. J. Foti, “Experimental investigation of breast tumor imaging using indirect microwave holography,” Microwave Opt. Technol. Lett. 48, 480–482 (2006).
Eskelinen, P. and P. Harju, “Characterizing wood by microwaves,” IEEE Aerospace Electron. Syst. Mag. 13, 34–35 (1998).
Fear, E. C., J. Sill, and M. A. Stuchly, “Experimental feasibility study of confocal microwave imaging for breast tumor detection.” IEEE Trans. Microwave Theory Tech. 51, 887–892 (2003).
Foster, K. R. and H. P. Schwan, “Dielectric properties of tissues and biological materials: A critical review,” Crit. Rev. Biomed. Eng. 17, 25–104 (1989).
Gabriel, C., Compilation of the Dielectric Properties of Body Tissues at RF and Microwave Frequencies, Report AL/0E-TR-1996–0037, Radiofrequency Radiation Division, Brooks Air Force Base, Texas, 1996.
Hayt, W. H. and J. A. Buck, Engineering Electromagnetics, McGraw-Hill, New York, 2001.
Hernández López, M. A., M. Quintillán González, S. González García, A. Rubio Bretones, and R. Gómez Martín, “A rotating array of antennas for confocal microwave breast imaging,” Microwave Opt. Technol. Lett. 39, 307–311 (2003).
Huynh, P. T., A. M. Jarolimek, and S. Daye, “The false-negative mammogram,” Radio Graphics 18, 1137–1154 (1998).
Irishina, N., O. Dorn, and M. Moscoso, “Level-set techniques for microwave medical imaging,” Proc. Appl. Math. Mech. 7, 1151601–1151602 (2007).
Irishina, N., M. Moscoso, and O. Dorn, “Detection of small tumors in microwave medical imaging using level sets and MUSIC,” Proc. 2006 Progress in Electromagnetics Research Symp. Cambridge, MA, USA, 2006, pp. 43–47.
Irishina, N., M. Moscoso, and O. Dorn, “Microwave imaging for early breast cancer detection using a shape-based strategy,” IEEE Trans. Biomed. Eng. 56, 1143–1153 (2009).
Joachimowicz, N., J. J. Mallorqui, J. C. Bolomey, and A. Broquetas, “Convergence and stability assessment of Newton-Kantorovich reconstruction algorithms for microwave tomography,” IEEE Trans. Med. Imag. 17, 562–570 (1998).
Kaestner, A. P. and L. B. Baath, “Microwave polarimetry tomography of wood,” IEEE Sensors J. 5, 209–215 (2005).
Kharkovsky, S. and R. Zoughi, “Microwave and millimeter wave nondestructive testing and evaluation—overview and recent advances,” IEEE Instrum. Meas. Mag. 10, 26–38 (2007).
Kim, Y. J., L. Jocre, F. De Flaviis, and M. Q. Feng, “Microwave reflection tomographic array damage detection of civil structures,” IEEE Trans. Anten. Propag. 51(11), 3022–3032 (2003).
Larsen, L. E. and J. H. Jacobi, Medical Applications of Microwave Imaging, IEEE Press, Piscataway, NJ, 1986.
Lazebnik, M. et al., “A large-scale study of the ultrawideband microwave dielectric properties of normal, benign, and malignant breast tissues obtained from cancer surgeries,” Phys. Med. Biol. 52, 6093–6115 (2007).
Lazebnik, M. et al., “Electromagnetic spectroscopy of normal breast tissue specimens obtained from reduction surgeries: Comparison of optical and microwave properties,” IEEE Trans. Biomed. Eng. 55, 2444–2451 (2008).
Lhiaubet, C., G. Cottard, J. Ciccotelli, J. F. Portala, and J. C. Bolomey, “On-line control in wood and paper industries by means of rapid microwave linear sensors,” Proc. 1992 Eur. Microwave Conf., 1992, vol. 2, pp. 1037–1040.
Li, X., E. J. Bond, B. D. Van Veen, and S. C. Hagness, “An overview of ultra-wideband microwave imaging via space-time beamforming for early-stage breast-cancer detection,” IEEE Anten. Propag. Mag. 47, 19–34 (2005).
Li, X., S. K. Davis, S. C. Hagness, D. W. van der Weide, and B. D. Van Veen, “Microwave imaging via space-time beamforming: experimental investigation of tumor detection in multilayer breast phantoms,” IEEE Trans. Microwave Theory Tech. 52, 1856–1865 (2004).
Li, X., S. C. Hagness, M. K. Choi, and D. W. van der Weide, “Numerical and experimental investigation of an ultrawideband ridged pyramidal horn antenna with curved launching plane for pulse radiation,” Antennas Wireless Propagat. Lett. 2, 259–262 (2003).
Lim, H. B., N. T. Nhung, E. Li, and N. D. Thang, “Confocal microwave imaging for breast cancer detection: Delay-multiply-and-sum image reconstruction algorithm,” IEEE Trans. Biomed. Eng. 55, 1697–1704 (2008).
Lin, J. C., “Frequency optimization for microwave imaging of biological tissues,” IEEE Proc. 73, 374–375 (1985).
Mashal, A., J. H. Booske, and S. C. Hagness, “Towards contrast-enhanced microwave induced thermoacoustic imaging of breast cancer: An experimental study of the effects of microbubbles on simple thermoacoustic targets,” Phys. Med. Biol. 54, 641–650 (2009).
Meaney, P. M. et al., “Initial clinical experience with microwave breast imaging in women with normal mammography,” Acad. Radiol. 14, 207–218 (2007).
Mikhnev, V. and P. Vainikainen, “Microwave imaging of layered structures in civil engineering,” Proc. 2002 Eur. Microwave Conf., Milan, Italy, 2002, pp. 717–720.
Mittra, R. “Inverse scattering and remote probing” in Computer Techniques for Electromagnetics, R. Mittra, ed., Pergamon, New York, 1973, pp. 372–392.
Mudanyal, O., S. Yldz, O. Semerci, A. Yapar, and I. Akduman, “A microwave tomographic approach for nondestructive testing of dielectric coated metallic surfaces,” IEEE Geosci Remote Sens. Lett. 5, 180–184 (2008).
Park, J. and C. Nguyen, “An ultrawide-band microwave radar sensor for nondestructive evaluation of pavement subsurface,” IEEE Sensor J. 5, 942–949 (2005).
Pastorino, M., A. Massa, and S. Caorsi, “A global optimization technique for microwave nondestructive evaluation,” IEEE Trans. Instrum. Meas. 51, 666–673 (2002).
Pastorino, M., A. Salvadé, R. Monleone, T. Bartesaghi, G. Bozza, and A. Randazzo, “Detection of defects in wood slabs by using a microwave imaging technique,” Proc. 2007 IEEE Instrum entation and Measurement Technology Conf., Warsaw, Poland, 2007.
Paulsen, K. D., P. M. Meaney, and L. Gilman, eds., Alternative Breast Imaging. Four Model-Based Approaches, Springer, Berlin, 2005.
Pichot, C., J. Y. Dauvignac, I. Aliferis, E. Le Brusq, R. Ferrayé, and V. Chatelée, “Recent nonlinear inversion methods and measurement system for microwave imaging,” Proc. 2004 IEEE Int. Workshop on Imaging Systems and Techniques, Stresa, Italy, 2004, pp. 95–99.
Qaddoumi, N. N., W. M Saleh, and M. Abou-Khousa, “Innovative near-field microwave nondestructive testing of corroded metallic structures utilizing open-ended rectangular waveguide probes,” IEEE Trans. Instrum. Meas. 56, 1961–1966 (2007).
Sabouni, A., D. Flores-Tapia, S. Noghanian, G. Thomas, and S. Pistorius, “Hybrid microwave tomography technique for breast cancer imaging,” Proc. 28th IEEE EMBS Annual Int. Conf., New York, 2006, pp. 4273–4276.
Salvadè, A. et al., “Microwave imaging of foreign bodies inside wood trunks,” Proc. 2008 IEEE Int. Workshop on Imaging Systems and Techniques, Chania, Greece, 2008, pp. 88–93.
Salvadè, A., M. Pastorino, R. Monleone, G. Bozza, A. Randazzo, and T. Bartesaghi, “A noninvasive microwave method for the inspection of wood beams,” Proc. 3rd Int. Conf. Electromagnetic Near-Field Characterization & Imaging, St. Louis, MO, 2007, pp. 395–400.
Salvador, S. M. and G. Vecchi, “Experimental tests of microwave breast cancer detection on phantoms,” IEEE Trans. Anten. Propagat. 57, 1705–1712 (2009).
Semenov, S. Y. et al., “Spatial resolution of microwave tomography for detection of the myocardial ischemia and infarction. Experimental study on two-dimensional models,” IEEE Trans. Microwave Theory Tech, 48, 538–544 (2000).
Semenov, S. Y. et al., “Three-dimensional microwave tomography: Initial experimental imaging of animals,” IEEE Trans. Biomed. Eng. 49, 55–63 (2002).
Shea, J. D., P. Kosmas, S. C. Hagness, and B. D. Van Veen, “Contrast-enhanced microwave breast imaging,” Proc. 2009 Int. Symp. Antenna Technology and Appl. Electromagn. (ANTEM/URSI), Banff, Canada, 2009.
Shen, J., G. Schajer, and R. Parker, “Theory and practice in measuring wood grain angle using microwaves,” IEEE Trans. Instrum. Meas. 43, 803–809 (1994).
Tarnus, R. X. Dérobert, and Cr. Pichot, “Multifrequency microwave tomography between boreholes,” Microwave Opt. Technol. Lett. 42, 4–8 (2004).
Watanabe, M., M. Miyakawa, Y. Miyazaki, N. Ishii, and M. Bertero, “Image restoration of CP-MCT for sugar distribution imaging inside a fruit,” Proc. 36th Eur. Microwave Conf., Manchester, UK, 2006, pp. 1248–1251.
Williams, T. C., E. C. Fear, and D. T. Westwick, “Tissue sensing adaptive radar for breast cancer detection—investigation of an improved skin-sensing method,” IEEE Trans. Microwave Theory Tech. 54, 1308–1414 (2006).
Xie, Y., B. Guo, L. Xu, J. Li, and P. Stoica, “Multistatic adaptive microwave imaging for early breast cancer detection,” IEEE Trans. Biomed. Eng. 53, 1647–1657 (2006).
Xu, H., T. Li, and Y. Sun, “The application research of microwave imaging in nondestructive testing of concrete wall,” Proc. 6th World Congress on Intelligent Control and Automation, Dalian, China 2006, pp. 5157–5161.
Zastrow, E., S. K. Davis, M. Lazebnik, F. Kelcz, B. D. Van Veen, and S. C. Hagness, “Development of anatomically realistic numerical breast phantoms with accurate dielectric properties for modeling microwave interactions with the human breast,” IEEE Trans Biomed. Eng. 55, 2792–2800 (2008).
Zeng, Z., K. Arunachalam, C. Lu, B. Shanker, and L. Udpa, “Element-free Galerkin method in modeling microwave inspection of civil structures.” Proc. 12th Biennial IEEE Conf. Electromagnetic. Field Computation, Miami, FL, USA, 2006, p. 268.
Zhang, Z. Q., Q. H. Liu, C. Xiao, E. Ward, G. Ybarra, and W. T. Joines, “Microwave breast imaging: 3D forward scattering simulation,” IEEE Trans. Biomed. Eng. 50, 1180–1189 (2003).
Zoughi, R., Microwave Non-Destructive Testing and Evaluation, Kluwer Academic Publishers, Dordrecht, 2000.
Zoughi, R. and S. Bakhtiari, “Microwave nondestructive detection and evaluation of disbonding and delamination in layered-dielectric slabs,” IEEE Trans. Instrum. Meas. 39, 1059–1063 (1990).
Microwave Imaging, By Matteo Pastorino
Copyright © 2010 John Wiley & Sons, Inc.