Chapter 5
Self‐Appointed Gurus and Neanderthal Brains
Thousands of years ago, a couple of your ancestors pushed their way through jungle foliage looking for their next meal. A tiger attacked from behind and ate one for lunch. The survivor told other villagers. One woman shared a similar story. So the villagers realized a pattern. Giant cats eat people. Better avoid them.
Another time, your ancestors discovered which berries were poisonous, which caused diarrhea, and which they could safely eat and enjoy. To survive and propagate, they learned patterns: which berries would kill, which would woo, and which could ruin a perfect picnic.
Humans are hardwired to seek such patterns. But while good for survival, these same pattern‐seeking tendencies make us lousy investors. We figure if something is rising in price, it will keep rising. And if something drops in price, it will keep falling. But the stock market isn't a tiger or a jungle berry.
The best times to have invested in stocks would have been 1931, after the 1929–1930 stock market crash; 1973–1974, after the markets plunged more than 40 percent; October 1987, when a single‐day market drop exceeded 20 percent; 2000–2002, when markets fell 40 percent; and 2008–2009, when global stocks were sliced in half. Instead of celebrating these discounts, however, many investors soiled their pants.
When stocks fall, many fear the market will never recover. So they don't invest. Others try guessing where the market will bottom out before buying. To them, purchasing plummeting stocks is like catching a falling knife.
Jason Zweig details such cognitive dissonance in his excellent book, Your Money and Your Brain.1 You don't have to be a brain surgeon or neuropsychologist to understand the stock market. Just remember the Rocky movies. Global stock markets are a lot like Sylvester Stallone's character, Rocky Balboa. When you own diversified global stocks across a variety of geographic sectors, they get knocked to the canvas from time to time. But on aggregate, they always get up. Not only do they resume rising, they eventually hit new heights. Not every stock market responds immediately. But the biggest drops are usually followed by the biggest rewards. Sadly, few of us think about long‐term history. Instead, our brains create short‐term patterns, influenced by fear and immediate gratification.
Why Most Investors Should Hope for Falling Markets
Do you freak out when the stock market drops? If you're employed and in a position to buy stock market investments for at least the next five years, you should celebrate falling markets.
Warren Buffett, history's greatest investor, tries to educate the general public on stock market prices by offering the following quiz:
If you plan to eat hamburgers throughout your life and are not a cattle producer, should you wish for higher or lower prices for beef? Likewise, if you are going to buy a car from time to time but are not an auto manufacturer, should you prefer higher or lower car prices? These questions, of course, answer themselves. But now for the final exam: If you expect to be a net saver during the next five years, should you hope for a higher or lower stock market during that period? Many investors get this one wrong. Even though they are going to be net buyers of stocks for many years to come, they are elated when stock prices rise and depressed when they fall. In effect, they rejoice because prices have risen for the “hamburgers” they will soon be buying. This reaction makes no sense. Only those who will be sellers of equities [stock market investments] in the near future should be happy at seeing stocks rise. Prospective purchasers should much prefer sinking prices.2
The stock market is like a grocery store filled with nonperishable items. When prices fall, stock up on those products. Prices will inevitably rise again. If you like canned beans, and the store is selling them this week at a 20 percent discount, you have a choice. You can sit on your haunches and wonder whether they'll be even cheaper the following week, or you can stop being silly and just buy the beans. If the price drops further the following month, you can buy more of them. But if you sit on your butt and miss out on the sale (because you're speculating that beans will get even cheaper), well, you miss out on the sale.
A stock market drop is much the same. But most investors shun stock market discounts. Amateurs and professionals alike often dive out of stock investments when they forecast rough times ahead. Stock markets, however, are extremely unpredictable. If you (or an advisor) move money based on forecasts, your wealth will eventually suffer.
Are You Cheering for the Right Team?
My brother‐in‐law loves the Toronto Maple Leafs. It's one of Canada's most iconic ice hockey teams. When his kids were younger, he used to put them in his favorite team's sweaters every time the Leafs played.
He celebrates when the Maple Leafs win. But if you love the Boston Bruins, the Montreal Canadiens, or the Chicago Blackhawks, you would rather see your team give the Maple Leafs a beating.
Not everybody cheers for the same team. That should go for the stock market too. In fact, most people should cheer when the stock market falls. Headlines shouldn't say, “Investors Win as Stocks Rise!” Only retirees (and near‐retirees) should be thrilled to see stocks rise.
Let's look at a Canadian example, while keeping in mind that these statistics would likely be similar for other countries too. Statistics Canada says the majority of Canadians are between the ages of 20 and 60.3 Most of these people should be adding money to the stock market every month. They should hope that stocks don't rise for several years in a row. That's because, long term, stock market growth tracks corporate earnings' growth. On aggregate, business earnings grow almost every year. When stocks don't follow, investors get to buy an increasingly higher percentage of corporate earnings with their savings and enjoy higher dividend yields.
This is great for workers who are adding money to the market. It's like piling projectiles onto an ancient catapult. The more money that they add, while the catapult is low, the more money they'll make when the catapult launches. That's why Warren Buffett says those who have at least five more years to work and invest should prefer to see stocks sink. About 28.4 million Canadians are over the age of 20. Of that number, about 71 percent are below the age of 60.4 That means most working Canadians should prefer to see stocks sputter.
Statistics Canada says the average retirement age in 2015 was 64 years of age. Just 29 percent of adult Canadians (over the age of 20) are 60 years of age or older. This minority should be cheering when stock markets rise. But it's crazier than crazy for anyone else to cheer when the stock market rises.5
If you're employed, you should be buying.
If you're retired, you should be selling.
That's why workers and retirees should cheer for different teams.
If You're Just Starting Out, Pray for Stocks to Sputter
In 2016, I met a young woman named Miranda who works at a gym. She said she was ready to invest. She knows that if she invests her money every month, she'll benefit from dollar cost averaging. During months or years when the stock market lags, her regular deposits will buy more market units. She wants to stack that catapult.
But investors need to learn how to feel about stock market movements. I asked Miranda this:
“If you invested $10,000 a year, should you prefer to see stocks gain 15 percent per year for 15 years, followed by 2 percent annual gains for an equal time period? Or should you prefer to see stocks gain 2 percent per year for your first 15 years of investing, followed by 11 percent per year for the following 15 years?”
“I think most new investors would want to see their money rise right away,” she said, “but because you've asked me, it might be a trick.”
Compounding math has a way of fooling people. Figure 5.1 shows that if Miranda's money grew by 15 percent per year for 15 years, followed by 2 per cent per year for the next 15 years, she would have a total of $922,817.99. That's a lot of money. But if her money grew by 2 percent per year for 15 years, followed by 11 percent per year for an equal time period, she would end up with $1,235,866.87.
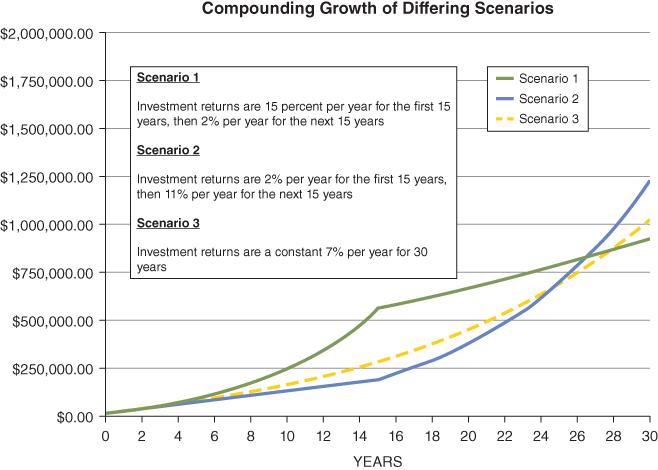
Figure 5.1 Investors Don't Require Immediate Gratification
How about a constant return of 7 percent per year? It would be easier on the nerves. Instinctively, it also sounds better than facing weak stock returns for the first 15 years. But, as shown in Figure 5.1, it wouldn't be as profitable. In this scenario, the money would grow to $1,020,730.41. Facing the first 15 years of horrible returns, followed by 11 percent per year growth for the next 15 years would provide $215,136.46 more.
| Scenario 1 | Scenario 2 | |||
| Stocks Gain 15% per Year for 15 Years, Followed by 2% per Year for 15 Years | Stocks Gain 2% per Year for 15 Years, Followed by 11% per Year for 15 Years | |||
| Year | Acct. Balance | Compound Annual Growth Rate | Acct. Balance | Compound Annual Growth Rate |
| $10,000.00 | $10,000.00 | |||
| 1 | $21,500.00 | 15% | $20,200.00 | 2% |
| 2 | $34,725.00 | 15% | $30,604.00 | 2% |
| 3 | $49,933.75 | 15% | $41,216.08 | 2% |
| 4 | $67,423.81 | 15% | $52,040.40 | 2% |
| 5 | $87,537.38 | 15% | $63,081.21 | 2% |
| 6 | $110,667.99 | 15% | $74,342.83 | 2% |
| 7 | $137,268.19 | 15% | $85,829.69 | 2% |
| 8 | $167,858.42 | 15% | $97,546.28 | 2% |
| 9 | $203,037.18 | 15% | $109,497.21 | 2% |
| 10 | $243,492.76 | 15% | $121,687.15 | 2% |
| 11 | $290,016.67 | 15% | $134,120.90 | 2% |
| 12 | $343,519.17 | 15% | $146,803.32 | 2% |
| 13 | $405,047.05 | 15% | $159,739.38 | 2% |
| 14 | $475,804.11 | 15% | $172,934.17 | 2% |
| 15 | $557,174.72 | 15% | $186,392.85 | 2% |
| 16 | $578,318.22 | 2% | $216,896.07 | 11% |
| 17 | $599,884.58 | 2% | $250,754.63 | 11% |
| 18 | $621,882.28 | 2% | $288,337.64 | 11% |
| 19 | $644,319.92 | 2% | $330,054.78 | 11% |
| 20 | $667,206.32 | 2% | $376,360.81 | 11% |
| 21 | $690,550.45 | 2% | $427,760.50 | 11% |
| 22 | $714,361.45 | 2% | $484,814.15 | 11% |
| 23 | $738,648.68 | 2% | $548,143.71 | 11% |
| 24 | $763,421.66 | 2% | $618,439.52 | 11% |
| 25 | $788,690.09 | 2% | $696,467.87 | 11% |
| 26 | $814,463.89 | 2% | $783,079.33 | 11% |
| 27 | $840,753.17 | 2% | $879,218.06 | 11% |
| 28 | $867,568.23 | 2% | $985,932.05 | 11% |
| 29 | $894,919.60 | 2% | $1,104,384.57 | 11% |
| 30 | $922,817.99 | 2% | $1,235,866.87 | 11% |
That's why I grumble when my investments rise in value. Like Miranda, I'm still earning money. I regularly add those proceeds to my index funds. Most of my friends are also working. They're adding money too. We're part of an age group that should be investing every month. It would be cool to see a headline that respects our interest. Like hockey, not everybody in the game should cheer for the same team.
Should You Worry When Stocks Hit All‐Time Highs?
I wish I could control part of your brain. I know that sounds evil, but my motives are pure. I want to help you make money with your index funds.
Here's how I would do it. When stocks hit all‐time highs, you wouldn't know. When experts on TV predict the next market crash, you would fall into a trance and hear a soothing Celtic song. Many people are addicted to looking at their investment performance. But don't bother looking more than once a year. In my mind‐control world, if you looked more often, I would flick a mental switch to make you scratch your crotch in public.
Here's the reason behind my quirky mind‐control desire. The less you think about the market, the more money you will make.
In 2014, Business Insider's Myles Udland wrote the following awkwardly titled story: “Fidelity Reviewed Which Investors Did Best and What They Found Was Hilarious.” He reported that Fidelity (a mutual fund company) wanted to find out “who are our best investors?” Amazingly, they were the people who had forgotten that they had an account with Fidelity.6
When we worry about the markets, Donald Trump, Brexit, the European Union, or a global banking crisis, we do silly things. We might juggle our investments “to adjust to market conditions.” But doing so is foolish.
A good friend of mine is British. He sold his British stock market index when the United Kingdom voted to leave the European Union. As a result, he got Dalbared. It's a brand new verb that I just made up. According to Vanguard, the UK stock market index gained 20 percent between May 2016 (a month before the Brexit vote) and May 2017.7 By speculating and selling, my friend missed a quick 20 percent gain.
Dalbar isn't a verb. But perhaps it should be.
Each year, Dalbar (a Chicago‐based firm) tracks investors' performance. In 2016, Donald Trump and Hillary Clinton battled at the polls. Donald Trump became the 45th US president. At the time, I received a lot of e‐mails. “What should I do?” they asked. “Should I sell US stocks?”
Many of them did. As Dalbar's director, Cory Clark, says, “Investors had to push against media negativism from January [2016] to the end of the year. They were largely sellers in the second half of the year, either from fear or an attempt to find the top of the market.”
In 2016, the S&P 500 index gained 11.96 percent. But Dalbar claims the average investor in US mutual funds gained just 7.26 percent. That's an alarming gap caused by crazy human behavior.8
Unfortunately, people (especially men) have a history of doing that. I introduced Dalbar's Quantitative Analysis of Investment Behavior in Chapter 3. Have another look. Figure 5.2 shows that from January 1987 to December 31, 2016, the S&P 500 averaged a compound annual return of 10.16 percent per year. But Dalbar claims the average American investor in US funds averaged just 3.98 percent per year.
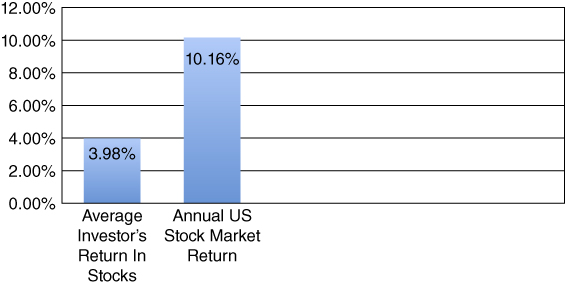
Figure 5.2 Investors' Returns versus Stock Market Returns 1986–2016
SOURCE: Dalbar.
People get Dalbared when they think too much.
The Only Thing That Matters
With a diversified portfolio of low‐cost index funds, you will beat 90 percent of investment professionals over your investment lifetime if you don't do anything silly.
Stocks will crash, from time to time. But they will also keep hitting new highs.
I'm 47 years old. Over my lifetime, the S&P 500 (with dividends reinvested) has hit all‐time highs during 31 different calendar years. I've listed them in Table 5.2.
Table 5.2 Years US Stocks (with Dividends Reinvested) Hit All‐Time Highs, 1970–2017
SOURCE: NYU Stern School of Business.
| 1970 | 1982 | 1988 | 1995 | 2007 | 2017 |
| 1971 | 1983 | 1989 | 1996 | 2012 | |
| 1972 | 1984 | 1991 | 1997 | 2013 | |
| 1976 | 1985 | 1992 | 1998 | 2014 | |
| 1979 | 1986 | 1993 | 1999 | 2015 | |
| 1980 | 1987 | 1994 | 2006 | 2016 |
During those years, what did the headlines say? Many said stocks were going to crash. Most of them were wrong. Forecasters who got lucky were almost always wrong the next time. Nobody can predict when stocks will rise or fall.
I started to invest in 1989. The stock market hit an all‐time high that year. I'm glad I didn't worry. Stocks hit another high in 1991. Once again, I'm glad I didn't sell. US stocks hit a new all‐time high in 1992, 1993, and 1994. I think you get the picture. If I had sold, I would have been Dalbared.
But what if I had guessed correctly? That would have been worse. Next time, the stock market gods would have knocked me on my butt.
It's Not Timing the Market That Matters; It's Time in the Market
There are smart people (and people who aren't so smart) who think they can jump in and out of the stock market at opportune moments. It seems simple. Get in before the market rises and get out before it drops. This is referred to as “market timing.” But most experts have a better chance of beating Usain Bolt in a footrace than effectively timing the market over an investment lifetime.
Vanguard founder John Bogle, named by Fortune magazine as one of the four investment giants of the twentieth century, says this about market timing:
After nearly 50 years in this business, I do not know of anybody who has done it successfully and consistently. I don't even know anybody who knows anybody who has done it successfully and consistently.9
Warren Buffett, the world's greatest investor, stated in a 1992 Berkshire Hathaway annual report, “We've long felt that the only value of stock forecasters is to make fortune tellers look good.”10 Pundits try forecasting, of course. And they all sound logical spewing their theories in the Wall Street Journal or on CNBC. But predictions rarely jibe with future realities. Consider unemployment figures. If you've watched a bit of market‐based TV, you've probably heard experts predicting rough times for stocks when unemployment figures rise. And it makes perfect sense, right? Wrong. Unfortunately, short‐term market movements make no sense at all.
High Unemployment and High Stock Returns
In his excellent book Markets Never Forget, money manager Ken Fisher pokes our Neanderthal brains. He explains that, historically, high unemployment has been followed by high future stock returns.11 No, I'm not suggesting keeping money out of the stock market until soup kitchens outnumber Starbucks coffee shops. Nor was Fisher. This is a random phenomenon, as likely to be repeated as not. But can you imagine the headline? Stocks will surge next year because unemployment is getting close to hitting a new peak!
If Table 5.3 inspires you to try predicting when we're six months from an unemployment peak, then you're missing the point. You can't predict such a thing any more than you can forecast the next zit on your nose. And the pattern won't likely perpetuate. Predicting a tiger would eat you in a one‐on‐one cage match is a pretty safe bet. But forecasting stock markets and zits is next to impossible.
Table 5.3 High Unemployment and S&P 500 Returns
SOURCES: Bureau of Labor Statistics; Global Financial Data Inc., S&P 500 total return as of May 1, 2011.
| Six Months before Unemployment Peaks | S&P 500 Returns in Following 12 Months |
| November 30, 1932 | +57.7% |
| December 31, 1937 | +33.2% |
| July 30, 1946 | −3.4% |
| April 30, 1949 | +31.3% |
| March 31, 1954 | +42.3% |
| January 31, 1958 | +37.9% |
| November 30, 1960 | +32.3% |
| February 26, 1971 | +13.6% |
| November 29, 1974 | +36.2% |
| January 31, 1980 | +19.5% |
| June 30, 1982 | +61.2% |
| December 31, 1991 | +7.6% |
| December 31, 2002 | +28.7% |
| April 30, 2009 | +38.8% |
| Average | +31.2% |
But come on, surely experts can predict the stock market. Many would like you to think so. Yet five‐year‐old kids and house pets can make them look foolish. In 2012, the British paper The Observer pitted selected professional stock pickers against a group of children and a cat named Orlando in a one‐year stock‐picking competition. The feline purred to the top, gaining 10.8 percent, compared to a 3.5 percent gain for the professionals and a 2.9 percent loss for the kids. (Orlando made his picks by throwing a toy mouse at a grid of numbers allocated to different companies.)12 How did Vanguard's British stock market index measure up? It beat them all, gaining 17.4 percent.13
In 2002, the Financial Times reported a stock‐picking battle between a five‐year‐old kid, an astrologer, and a professional portfolio analyst. The child won, beating the professional analyst by 52 percent.14
Ah, I can hear what you're thinking. Hallam is cherry‐picking anomalies. Data‐crunching firm CXO Advisory proves otherwise after putting dozens of the world's highest‐profile financial forecasters to the test. When these so‐called experts publicize their stock market predictions, the company tracks their accuracy. If you believe the talking heads on CNBC or the experts profiled in the Wall Street Journal are worth listening to, I'm sorry to disappoint you. Between 2005 and 2012, CXO Advisory collected 6,584 forecasts by 68 experts. When predicting the direction of the stock market, they were right just 46.9 percent of the time. Coin flippers would rival them.15
On March 5, 2009, comedian Jon Stewart, of US television's The Daily Show, humiliated some of CNBC's highest‐profile stock market forecasters. His list of suffering victims included Jim Cramer, host of CNBC's Mad Money program.
Footage of Cramer's failed predictions gave plenty of video fodder for the clever Jon Stewart.16
What Stewart didn't realize (and it would have made great viewing) is that CXO Advisory has tracked Cramer's long‐term forecasting performance. He has been correct just 46.8 percent of the time.17
Instead of following a guru's recommendation (or asking your house cat) whether to buy US stocks, British stocks, or Asian stocks, consider owning them all. By doing so with index funds, you'll beat most professional investors.
What Can You Miss by Guessing Wrong?
In the previous chapter, I introduced you to two offshore pension investors (Steve Batchelor and Eric Smith) whose investments sputtered compared to the results of the global stock market indexes. Not only were Steve and Eric paying high fees; their advisors gambled on what economic sectors they thought would thrive. And it cost these expats dearly.
Predicting stock market movements, even with the benefit of hindsight, is next to impossible. Jeremy Siegel agrees. Author of Stocks for the Long Run and professor of business at the University of Pennsylvania's Wharton School, Siegel looked back at the biggest stock market moves since 1885 (focusing on trading sessions where the markets moved by 5 percent or more in a single day) and tried connecting each of them to a world event.18
Seventy‐five percent of the time, he couldn't find logical explanations. Yet he had the luxury of looking back in time and trying to match the market's behavior with historical world news. If a world‐ renowned finance professor like Siegel can't make connections between world events and the stock market's movements with the benefit of hindsight, then how is someone supposed to predict future movements based on economic events—or the prediction of events to come?
If anyone tries convincing you to act on their short‐term stock market predictions, ignore them. Doing otherwise could cost you plenty. For example, let's look at the US stock market from 1982 through December 2005.
During this time, the stock market averaged 10.6 percent annually. But if you didn't have money in the stock market during the 10 best trading days, your average return would have dropped to 8.1 percent. If you missed the best 50 trading days, your average return would have been just 1.8 percent.19 Markets can move so unpredictably, and so quickly. If you take money out of the stock market for a day, a week, a month, or a year, you could miss the best trading days of the decade. Neither you nor your broker can predict them.
A lucky guess or two (as exhibited by Orlando the cat) may be a curse. Like winning a few thousand dollars on your first trip to the casino, it could take plenty of beatings before realizing your skill was just luck.
Dalbar and Morningstar's research show that most investors underperform the funds they own. This is especially true when a fund jumps around a lot. When it falls, a mad voice inside us says, “Sell this sucker! After a fund has risen a lot, that same crazy voice says, “Buy this winner, now!”
If this behavior weren't common, we would call it a disorder and name it after some dead Teutonic psychologist.
Here's an example with Fidelity's Emerging Market Fund (FEMK). Over the 15‐year period ending April 30, 2017, it averaged a compound annual return of 8.9 percent after fees. But according to Morningstar, the average investor in that fund, over that same time period, averaged a compound annual return of just 4.12 percent.20
Investors felt good about the fund after it had risen, so they added more money. Their sentiments turned negative after the fund had dropped—so they either sold, or they ceased to add fresh money.
If somebody had invested $10,000 in that fund on April 30, 2002 (and if they had just left it alone!), it would have grown to $35,926 fifteen years later. Instead, the average investor in that fund turned $10,000 into just $18,323.
Morningstar calculates the average investor's return by looking at the fund's cash flow. It looks at how much money went into the fund (and when) compared to the money that was coming out of the fund. In other words, they're looking at when investors are buying and when they're selling. This is called a cash‐flow weighted return analysis.
When Investors and Advisors Sabotage Their Rides
Most people don't add consistent sums to the same funds. They prefer to chase what's rising and shun what's falling. Such performance gaps between what funds earn and what investors make are prevalent across every major asset group. People jump onto bandwagons. And it costs them plenty.
If a financial advisor ever suggests an investment product because “it's performing really well right now,” don't walk from the bozo—run! Recent past results rarely indicate a strong future. In most cases, the opposite holds true. Most mutual funds earning top ratings as superb performers eventually fall from their mantels, underperforming the typical fund in the years ahead. Winning geographic sector funds often do likewise.
Take the countries with the best‐performing stock markets in 2011. As reported by Business Insider, 9 of the top 11 were developing countries.22
They were Venezuela, Mongolia, Panama, Jamaica, Iran, Tanzania, Trinidad and Tobago, Botswana, and the Philippines, averaging a gain of 25 percent for 2011. Pattern seekers likely salivated after seeing these published returns. Many investors loaded up on emerging stock market exposure after their great performance run. Doing so, instead of just keeping a diversified portfolio of global stock markets, would have been silly.
Between 2012 and 2017, emerging‐market stocks gained a total of 6.4 percent. That's a compound annual return of just 1.3 percent per year over the 5‐year period. In contrast, the global stock market index gained 59 percent, for a compound annual return of 9.8 percent.
I'm not saying that the global stock market index will beat the emerging‐market index over the next 1‐, 3‐, 5‐, or 10‐year periods. It might. It might not. But chasing yesterday's winners, instead of diversifying, is a loser's game.
Popular Stocks Underperform
Some investors try picking their own stocks. But their odds of beating a low‐cost index fund are remote. Over the short term (a period of 10 years or fewer), anyone could get lucky. But over time, destiny favors indexes. Some people might scoff, believing if they buy large, established companies they could beat a simple index. Unfortunately, it's easier said than done.
The 10 biggest stocks in the United States always looks like a hurricane‐proof list. But the 10 biggest stocks change all the time. And those betting on the biggest firms as a group have always reaped weak returns. Between 1926 and 2006, the 10 biggest stocks in the United States underperformed the average US stock by 2.9 percent the subsequent year. After 3 years, they lagged by 11.1 percent; after 5 years, by 17.7 percent; and after 10 years they were 29.4 percent behind the S&P 500. During the 81‐year study, the largest 10 companies have never, as a group, outperformed the S&P 500 in subsequent years.23
The study in question ended in 2006. On average, 7 out of 10 of these company leaders underperformed the average US stock.
When I was researching for the first edition of this book, these were the 10 largest companies in the United States (as of August 2013):
America's Largest Publicly Traded Businesses
- Apple Inc.
- Exxon Mobil Corporation
- Google Inc.
- Microsoft Corporation
- Berkshire Hathaway
- Johnson & Johnson
- General Electric
- Walmart Stores
- Chevron Corporation
- Wells Fargo & Company
I averaged their performances to May 2017. After fewer than 4 years, the US stock market was ahead by a total of 18.1 percent. Only 3 of these big 10 stocks beat the US index between August 2013 and May 2017: Apple, Google, and Johnson & Johnson. Will these winners continue to beat the average stock? History says it isn't likely.24
In fact, picking your own individual stocks is a hazardous game. You might get lucky for a few short years (remember that even 10 years is a blip). But the odds of doing well over an investment lifetime aren't very good.
A study by Arizona State University finance professor Hendrik Bessembinder says just 4 percent of the stocks in the US market accounted for all of the stock market's gains between 1926 and 2015. That means about 96 percent of individual stocks didn't make money. It would have been tough to find the winners in advance.25
So how does professor Bessembinder invest his money? The New York Times' Jeff Sommer wrote, “In response to a question, Professor Bessembinder said that he, personally, favors low‐cost index funds.”26
How About the Next Big Thing?
When I first moved to Singapore, a Canadian woman cornered me at a business function to whisper about a great new investment opportunity. “There's a new cell phone company in China,” she said. “It's run by a guy who used to work for Nokia, and I have an opportunity to buy shares as soon as the stock start starts trading on the exchange next month.”
This is called an initial public offering (IPO). When a private company goes public, offering its shares on a stock exchange for the first time, it relies a great deal on hype. Stockbrokers flaunt its potential, creating breathless men and women (like the lady I met) salivating over the stock's supposed prognosis.
It's easy to get wrapped up in the hype. Many consider how much money they could have made with Microsoft's IPO in 1986. Such investors became quick multimillionaires.
But successful investors consider probabilities. Breathlessly jumping onto a hot IPO is usually a bad idea. University of Florida finance professor Jay Ritter has studied IPO performances for years. He finds that IPO buyers are like rock climbers with frayed ropes. Examining 1,006 IPOs from 1988 to 1993, he found that the Russell 3000 index of small‐cap stocks (the average American small stock) beat the typical IPO by 30 percent during the three years after it was launched. At the end of that period, 46 percent of the stocks were below their IPO price.
Piper Jaffray, working for US Bancorp, conducted a similar study, looking at 4,900 IPOs from May 1988 to July 1998. This 10‐year period was great for the market: the S&P 500 gained 472 percent. But new IPOs didn't keep pace. Fewer than one‐third of the newly public businesses were trading above their IPO price by the decade's end.31
Outsized IPO gains, according to Wharton Finance professor Jeremy Siegel, are rare. In a study covering 1968 to 2003, Siegel found that IPOs underperformed the small‐cap stock index (an index of small company stocks) 29 out of 33 years. In his book The Future for Investors, he argues, “investing in IPOs is much akin to playing the lottery.” After tracking the performance of nearly 9,000 IPOs, he concluded that they're a great deal for the investment banks that underwrite them but usually a terrible deal for regular investors.32
This is a long‐term trend. Siegel notes that 80 percent of IPOs during the period he studied underperformed the small‐cap index since their IPO date. In fact, IPO investors lagged the S&P 500 by 2 percent to 3 percent per year. What's more, the worst‐performing initial public offerings tended to be those companies on which investors pinned the highest hopes.
The fact is, the world's most profitable IPOs weren't storybook stocks like Microsoft or Google, but dull businesses that didn't open at silly prices. Fastenal, for example, provides building supplies. Since its 1987 IPO, which occurred a year after Microsoft's, its shares have beaten Bill Gates's company.33
So when the next overhyped IPO comes along, should you bother? I don't think so. Not unless you like scaling shale walls with frayed ropes.
When Genius Fails
Most individual stock pickers possess a false sense of skill. Any time investors pick individual stocks and underperform the relevant stock market index, they're giving up proceeds for nothing. Consider the typical investment club, where groups of like‐minded friends research stocks and pool their money.
Brad M. Barber (professor of finance at the University of California at Davis) and Terrance Odean (professor of banking and finance at UC Berkeley's Haas School of Business) used data from a large brokerage to study the performance of 166 investment clubs from February 1991 to January 1997. They published their findings in the January–February Financial Analysts Journal, proving that the typical investment club underperformed the S&P 500 index by 4.4 percent per year after trading costs.34
The results of the Mensa Investment Club are even more amusing. Mensa is a large, well‐known society of geniuses. To qualify, members must have recorded IQ scores in the top 2 percent. Reported in the June 2001 issue of Smart Money magazine, the Mensa Investment Club averaged just 2.5 percent over the previous 15 years, losing nearly 13 percent each year to the S&P 500 index.35
If you're building a stock and bond market portfolio for your retirement, you probably shouldn't gamble with individual stocks. Nor should you heed stock market predictions.
Are Index Fund Investors Smarter?
Many financial advisors also make mistakes. They often recommend “hot” funds. Sometimes, they think that they can time the market. But we have proof that they can't. In the United States, there's an actively managed mutual fund company called American Funds. You can't buy these funds directly. Instead, investors must buy them through a financial advisor or a broker. You might think that these professionals can advise investors to stay invested and not jump from fund to fund. But that isn't the case.
Using data from Morningstar, I compared all of the firm's funds with 10‐year track records. I wanted to see how the funds had performed, compared to how the funds' investors had performed.
I looked at four fund categories between October 31, 2004, and October 31, 2014. They included US Large Cap, Emerging Markets, Broad International, and Small Cap funds. When I averaged the investors' returns in each of the four categories, the American Fund investors had underperformed their funds by an average of 1.75 percent per year. If the funds' investors were rational, they would have earned the same returns as those posted by their funds.
For example, if a fund averaged 10 percent per year, over a designated period, then the funds' investors, over that same time period, should have done the same. But poor behavior (chasing winners, buying high and selling low) cost the American Funds' investors 1.75 percent per year between October 31, 2004, and October 31, 2014. The advisors' smart guidance didn't seem to help at all.
I made the same category comparisons with the fund company Fidelity. Investors can buy Fidelity's funds without a financial advisor. But in many cases, financial advisors stuff Fidelity's actively managed funds into client accounts. When I compared the same four categories over the same time period, I found that Fidelity's investors underperformed their funds by an average of 2.53 percent per year. As with the American Funds' investors, they got Dalbared too.
Most index fund investors don't have a financial advisor. When I compared the returns of Vanguard's index fund investors, over the same time period, in the same four categories, they underperformed their funds by just 0.71 percent per year. They didn't behave perfectly. But they were far less foolish.
I detailed the findings in my December 2014 AssetBuilder article “Are Index Fund Investors Simply Smarter?”36
Three and a half months later, the Wall Street Journal's Jonathan Clements published a similar story, “Are Index Fund Investors Smarter?” He asked Morningstar to conduct a broader study. It revealed the same results. Index fund investors appeared to have more discipline. He also offered an explanation:
I suspect it is less about greater intelligence and more about greater conviction. When you buy an index fund, your only worry is the market's performance. But when you buy an active fund, you have to worry about both the market's direction and your fund's performance relative to the market.”37
Every year since 2014, Morningstar has written a series of articles titled “Mind the Gap: Active Versus Passive Edition.” In each issue, they compare how investors behave. And in each issue, index fund investors behave a lot better than their counterparts in actively managed funds.38
Even if your neighbors invest twice as much as you each month, if they are average, they will buy actively managed mutual funds. They will also either chase hot‐performing funds or fail to keep a regular commitment to their investments when the markets fall. They'll feel good about buying into the markets when they're expensive. They won't be as keen to buy when stocks are on sale.
Don't be like your neighbors. Avoid that kind of self‐destructive behavior and you'll increase your odds of building wealth as an investor.