Chapter 1
Grow Big Profits without Any Effort
Once upon a time, in a land far away, there lived a young farmer. His name was Luke Skywalker. Don't get confused by his Star Wars namesake. That was just a movie.
Luke had a farming mentor, an awkward little guy with a massive green thumb. His name was Yoda. “Use the Force you must, young Skywalker,” he said. “Add new seeds to your crop fields every year. The Force will grow those seeds. They will flower and spread more seeds and those seeds will grow.”
“Which seeds should I plant?” asked Luke. “Buy the bags that contain every type of seed for every type of vegetable,” replied Yoda. “You'll never know which vegetables will grow the best in any given year,” he said. “Plant them all, you should. Let the Force look after the rest. But watch out for the dark side.”
Luke wasn't sure what Yoda meant by the dark side. He just knew that Yoda was a mysterious little dude. So Luke bought a bag that contained every seed. He planted every one, and his crops began to flourish. Some years, his carrots grew best. Other years, his lettuce, parsnips, or beets took center stage. Sometimes, droughts and a searing sun hurt his crops. But his crops always came back, stronger than ever.
This is how the stock market works. You can buy a single fund called a global stock market index fund. Like a bag of seeds representing multiple plants, it contains thousands of different stocks, representing dozens of different markets. It contains American stocks, British stocks, Canadian stocks, Australian stocks, and Chinese stocks. In fact, a global stock market index contains about 7,400 stocks from at least 49 different countries. Nobody trades those stocks. With a global stock market index, you own all of those stocks. You would also have access to that money, any time you want.
Some years (much like the garden during a drought), the proceeds recede. But just like that garden, the stock market always comes back stronger than before.
Imagine if someone had invested a lump sum of $1,200 in the stock market, starting in 1970. They then saved an additional $3.29 per day, adding that amount to their investment at the beginning of each year. Between January 1970 and December 31, 2016, that person would have added a total of $56,400 (see Figure 1.1 and Table 1.1). If they equaled the return of the global stock market index during those 47 years, that initial $1,200 investment-plus a further commitment equal to $3.29 per day-would have grown to more than $1.1 million. Between 1970 and 2016, global stocks averaged a compound annual return of 9.67 percent per year.
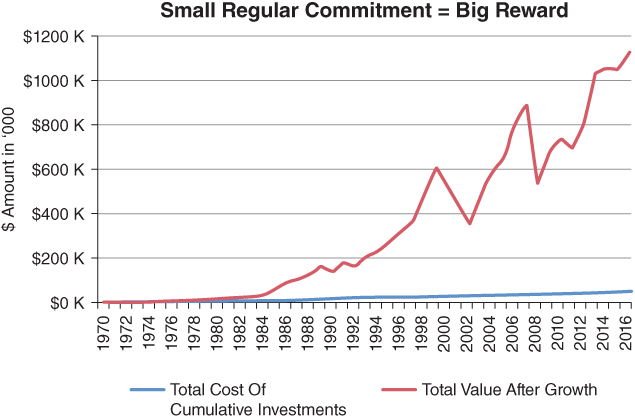
Figure 1.1 Global Stock Market Growth Source
SOURCE: Morningstar Direct.
Table 1.1 Global Stock Market Growth
SOURCE: Morningstar Direct.
| Year Ended Dec 31 | Annual Return | Total Cost of Cumulative Investments | Total Value after Growth |
| 1970 | −2.25% | $1,200 | $1,173 |
| 1971 | 18.52% | $2,400 | $2,812 |
| 1972 | 28.21% | $3,600 | $5,144 |
| 1973 | −8.96% | $4,800 | $5,776 |
| 1974 | −21.09% | $6,000 | $5,505 |
| 1975 | 32.44% | $7,200 | $8,880 |
| 1976 | 8.97% | $8,400 | $10,984 |
| 1977 | 3.32% | $9,600 | $12,588 |
| 1978 | 24.22% | $10,800 | $17,128 |
| 1979 | 12.33% | $12,000 | $20,588 |
| 1980 | 21.85% | $13,200 | $26,548 |
| 1981 | −3.19% | $14,400 | $26,863 |
| 1982 | 6.61% | $15,600 | $29,918 |
| 1983 | 25.37% | $16,800 | $39,013 |
| 1984 | 6.47% | $18,000 | $42,815 |
| 1985 | 51.83% | $19,200 | $66,827 |
| 1986 | 45.35% | $20,400 | $98,878 |
| 1987 | 10.06% | $21,600 | $110,146 |
| 1988 | 20.56% | $22,800 | $134,238 |
| 1989 | 24.15% | $24,000 | $168,147 |
| 1990 | −12.00% | $25,200 | $149,025 |
| 1991 | 18.42% | $26,400 | $177,897 |
| 1992 | −4.10% | $27,600 | $171,754 |
| 1993 | 25.25% | $28,800 | $216,624 |
| 1994 | 6.19% | $30,000 | $231,308 |
| 1995 | 20.73% | $31,200 | $280,707 |
| 1996 | 13.73% | $32,400 | $320,612 |
| 1997 | 15.33% | $33,600 | $371,146 |
| 1998 | 27.58% | $34,800 | $475,039 |
| 1999 | 29.04% | $36,000 | $614,539 |
| 2000 | −13.80% | $37,200 | $530,767 |
| 2001 | −17.86% | $38,400 | $436,958 |
| 2002 | −18.75% | $39,600 | $356,003 |
| 2003 | 38.08% | $40,800 | $493,226 |
| 2004 | 18.27% | $42,000 | $584,758 |
| 2005 | 11.52% | $43,200 | $653,460 |
| 2006 | 23.11% | $44,400 | $805,953 |
| 2007 | 11.16% | $45,600 | $897,231 |
| 2008 | −41.72% | $46,800 | $523,605 |
| 2009 | 30.40% | $48,000 | $684,346 |
| 2010 | 8.62% | $49,200 | $744,640 |
| 2011 | −7.99% | $50,400 | $686,248 |
| 2012 | 18.34% | $51,600 | $813,526 |
| 2013 | 26.59% | $52,800 | $1,031,361 |
| 2014 | 2.02% | $54,000 | $1,053,419 |
| 2015 | −0.44% | $55,200 | $1,049,979 |
| 2016 | 6.53% | $56,400 | $1,119,821 |
| Compound Annual Average Return: 9.67% per year | |||
Why Average Returns Aren't Normal
If we look at various 30‐year investment periods, global stock markets have averaged 9 to 11 percent per year. But individual calendar year returns that land precisely within that range are about as normal as a two‐headed poodle.
During my lifetime, it has happened once. Global stocks gained 10.07 percent in 2010.
It's much the same for the US stock market. Between 1926 and 2016, US stocks recorded calendar year gains between 9 and 11 percent just three times. In 1968, they gained 11 percent; in 1993, they gained 10.1 percent; and in 2004, they earned 10.9 percent. The rest of the time, stocks soared, sank, or sputtered.1
US stocks averaged 9.89 percent between 1926 and 2016, but single‐year performances were schizophrenic. On 24 occasions, US stocks recorded annual losses. On the flip side, stocks gained 25 percent or more during 24 other calendar years. Note the year‐by‐year performances in Table 1.2. Stock market volatility is normal. And it always will be.
Table 1.2 S&P 500 Annual Returns: 1926–2016
SOURCE: Bogleheads.org; Morningstar.com.
| 11.62% | 1926 | 18.98% | 1972 |
| 37.49% | 1927 | (14.66%) | 1973 |
| 43.61% | 1928 | (26.47%) | 1974 |
| (8.42%) | 1929 | 37.20% | 1975 |
| (24.90%) | 1930 | 23.84% | 1976 |
| (43.34%) | 1931 | (7.18%) | 1977 |
| (8.19%) | 1932 | 6.56% | 1978 |
| 53.99% | 1933 | 18.44% | 1979 |
| (1.44%) | 1934 | 32.42% | 1980 |
| 47.67% | 1935 | (4.91%) | 1981 |
| 33.92% | 1936 | 21.55% | 1982 |
| (35.03%) | 1937 | 22.56% | 1983 |
| 31.12% | 1938 | 6.27% | 1984 |
| (0.41%) | 1939 | 31.73% | 1985 |
| (9.78%) | 1940 | 18.67% | 1986 |
| (11.59%) | 1941 | 5.25% | 1987 |
| 20.34% | 1942 | 16.61% | 1988 |
| 25.90% | 1943 | 31.69% | 1989 |
| 19.75% | 1944 | (3.10%) | 1990 |
| 36.44% | 1945 | 30.47% | 1991 |
| (8.07%) | 1946 | 7.62% | 1992 |
| 5.71% | 1947 | 10.08% | 1993 |
| 5.50% | 1948 | 1.32% | 1994 |
| 18.79% | 1949 | 37.58% | 1995 |
| 31.71% | 1950 | 22.96% | 1996 |
| 24.02% | 1951 | 33.36% | 1997 |
| 18.37% | 1952 | 28.58% | 1998 |
| (0.99%) | 1953 | 21.04% | 1999 |
| 52.62% | 1954 | (9.10%) | 2000 |
| 31.56% | 1955 | (11.89%) | 2001 |
| 6.56% | 1956 | (22.10%) | 2002 |
| (10.78%) | 1957 | 26.68% | 2003 |
| 43.36% | 1958 | 10.88% | 2004 |
| 11.96% | 1959 | 4.91% | 2005 |
| 0.47% | 1960 | 15.79% | 2006 |
| 26.89% | 1961 | 5.49% | 2007 |
| (8.73%) | 1962 | (37.00%) | 2008 |
| 22.80% | 1963 | 26.46% | 2009 |
| 16.48% | 1964 | 15.06% | 2010 |
| 12.45% | 1965 | 2.11% | 2011 |
| (10.06%) | 1966 | 16.00% | 2012 |
| 23.98% | 1967 | 32.39% | 2013 |
| 11.06% | 1968 | 13.69% | 2014 |
| (8.50%) | 1969 | 1.38% | 2015 |
| 4.01% | 1970 | 11.96% | 2016 |
| 14.31% | 1971 | 9.89% | Average Return |
NOTE: Percentages in brackets show losses.
But have the meteoric rises, crashes, and rises resulted in stocks outpacing inflation?
Stocks Pound Inflation
Global stock markets beat inflation over time. Credit Suisse's Investment Returns Yearbook 2017 shows investment returns for 21 countries. Between 1900 and 2016, the average global stock market beat inflation by 5.1 percent per year.
For example, US stocks beat inflation by 6.4 percent annually. U.K stocks beat inflation by 5.5 percent per year. South African, New Zealand, Canadian, and Australian stocks beat inflation by 7.2 percent, 6.2 percent, 5.7 percent, and 5.1 percent, respectively.3
Whether such outperformance will continue is anyone's guess. But over long periods of time, stocks have crushed inflation. For this reason, investing in the stock market is a wise idea.
What Has the Stock Market Done for You Lately?
Some investors, over the past few years, have wondered what the stock market has done for them lately. If your investments have acted more like a deadbeat boyfriend than a moody yet productive home renovator, you have some legitimate factors to blame: high fees, a knucklehead behind the portfolio's decisions, or both.
Table 1.3 shows how a $10,000 lump‐sum investment would have grown over the past one‐, three‐, and five‐year periods ending May 18, 2017. For example, if $10,000 were invested in the US stock market, it would have grown to $11,855 over the 12‐month period. That's a 12‐month growth rate of 18.55 percent. If the same $10,000 were invested in the global stock market index, it would have grown to $11,853 for a 12‐month growth rate of 18.53 percent.
Table 1.3 What $10,000 Invested in US and Global Stocks Would Have Grown to (ending May 18, 2017)
SOURCE: Morningstar.com: Vanguard's Total Stock Market Index; Vanguard's Global Stock Market Index.
| Initial Investment | Grew to (US Stock Market) | Total % Growth | Grew to (Global Stock Market) | Total % Growth | |
| 1 Year | $10,000 | $11,855 | 18.55% | $11,853 | 18.53% |
| 3 Years | $10,000 | $13,216 | 32.16% | $11,820 | 18.20% |
| 5 Years | $10,000 | $19,918 | 99.18% | $17,200 | 72.00% |
* May 18, 2017, was the initial date of this writing.
Measured in US dollars.
This isn't meant to prove that US stocks beat global stocks or vice versa. Sometimes a US stock index will beat a global stock index. Other times, a global stock index will beat a US stock index. This table simply shows that it would have been tough to lose money in the stock market over these one‐, three‐, and five‐year periods. If you did lose money, a serpent in a suit was likely eating at your garden. I'll explain more about this in the upcoming chapters.
Undressing Stocks with 50 Shades of Gray
You might wonder how money grows in the stock market. Such profits derive from two sources: capital appreciation and dividends. Let me explain with a story.
Imagine you've started a business called Fifty Shades, designing and manufacturing sexy underwear for men and women. After signing seductive advertising deals with Madonna and Miley Cyrus, sales thrust upward across every female age demographic. But as the company's CEO, you recognize a problem. Fruit of the Loom is spanking you silly in sales to aging Baby Boomer males. Only one solution makes sense: Sign Sylvester Stallone to a multiyear television‐advertising contract. He could dance around a boxing ring, wearing Fifty Shades skivvies while pounding away at Siberian‐sized strawberries and apples.
Such advertising should increase sales, but then you'll need to meet the product demand. New factories will be required; new distribution networks will be needed. They won't be cheap. To make more money, you're going to need more money.
So you hire someone to approach the New York Stock Exchange, and before you know it, you have investors in your business. They buy parts of your business, also known as shares or stock. You're no longer the sole owner, but by selling part of your business to new stockholders, you're able to build a larger, more efficient underwear business with the shareholder proceeds.
Your company, though, is now public, meaning the share owners (should they choose) could sell their stakes in Fifty Shades to other willing buyers. When a publicly traded company has shares that trade on a stock market, the trading activity has a negligible effect on the business. So you're able to concentrate on creating the sexiest underwear in the business. The shareholders don't bother you, because generally, minority shareholders don't have any influence in a company's day‐to‐day operations.
Your underwear catches fire globally, which pleases shareholders. But they want more than a certificate from the New York Stock Exchange or their local brokerage firm proving they're partial owners of Fifty Shades. They want to share in the business profits. This makes sense because stockholders in a company are technically owners.
So the board of directors (who were voted into their positions by the shareholders) decides to give the owners an annual percentage of the profits, known as a dividend. This is how it works. Assume that Fifty Shades sells $1 million worth of garments each year. After paying taxes on the earnings, employee wages, and business costs, the company makes an annual profit of $100,000. So the company's board of directors decides to pay its shareholders $50,000 of that annual $100,000 profit and split it among the shareholders.
The remaining $50,000 profit would be reinvested back into the business—so the company can pay for bigger and better facilities, develop new products, increase advertising, and generate even higher profits.
Those reinvested profits make Fifty Shades even more profitable. As a result, the company doubles its profits to $200,000 the following year, and increases its dividend payout to shareholders.
This, of course, causes other potential investors to drool. They want to buy shares in this hot undergarment company. So now there are more people wanting to buy shares than there are people wanting to sell them. This creates a demand for the shares, causing the share price on the New York Stock Exchange to rise. The price of any asset, whether it's real estate, gold, oil, stock, or a bond, is entirely based on supply and demand. If there are more buyers than sellers, the price rises. If there are more sellers than buyers, the price falls.
Over time, Fifty Shades' share price fluctuates—sometimes climbing, sometimes falling, depending on investor sentiment. If news about the company arouses the public, demand for the shares increases. On other days, investors grow pessimistic, causing the share price to limp.
But your company continues to make more money over the years. And over the long term, when a company increases its profits, the stock price generally rises with it.
Shareholders are able to make money two different ways. They can realize a profit from dividends (cash payments given to shareholders usually four times each year), or they can wait until their stock price increases substantially on the stock market and choose to sell some or all of their shares.
Here's how an investor could hypothetically make 10 percent a year from owning shares in Fifty Shades:
Warren Buffett has his eye on your business, so he decides to invest $10,000 in the company's stock at $10 a share. After one year, if the share price rises to $10.50, this would amount to a 5 percent increase in the share price ($10.50 is 5 percent higher than the $10 that Mr. Buffett paid).
And if Mr. Buffett receives a $500 dividend, he earns an additional 5 percent because a $500 dividend is 5 percent of his initial $10,000 investment.
So if his shares gain 5 percent in value from the share price increase, and he makes an extra 5 percent from the dividend payment, then after one year Mr. Buffett would have earned 10 percent on his shares. Of course, only the 5 percent dividend payout would go into his pocket as a realized profit. The 5 percent “profit” from the price appreciation (as the stock rose in value) would be realized only if Mr. Buffett sold his Fifty Shades shares.
Warren Buffett, however, didn't become one of the world's richest men by trading shares that fluctuate in price. Studies have shown that, on average, people who trade stocks (buying and selling them) don't tend to make investment profits that are as high as those of investors who do very little (if any) trading. What's more, to maximize profits, investors should reinvest dividends into new shares.
Doing so increases the number of shares you own. And the more shares you have, the greater the dividend income you'll receive. Joshua Kennon, a financial author at About.com (a division of the New York Times Company), calculated how valuable reinvested dividends are. He assumed an investor purchased $10,000 of Coca‐Cola stock in June 1962. If that person didn't reinvest the stock's dividends into additional Coca‐Cola shares, the initial $10,000 would have earned $136,270 in cash dividends by 2012 and the shares would be worth $503,103.
If the person had invested the cash dividends, however, the $10,000 would have grown to $1,750,000.8
Let's assume Mr. Buffett holds shares in Fifty Shades while reinvesting dividends. Some years, the share price rises. Other years, it falls. But the company keeps increasing its profits, so the share price increases over time. The annual dividends keep a smile on Buffett's face as he reinvests them in additional shares. His profits from the rising stock price coupled with dividends earn him an average return (let's assume) of 10 percent a year.
The Stock Market Stars as the Great Humiliator
Choosing a company to invest in isn't easy, even if you think you can predict its business earnings. Over the long term, stock price increases correlate directly with business earnings. But over a short period of time (and 10 years is considered a stock market blip), anything can happen. This is why the famous money manager Kenneth Fisher refers to the stock market as the Great Humiliator.9 Over a handful of years, a company's business profits can grow by 8 percent per year, while the stock price stagnates. Or business earnings could limp along at 4 percent per year, while the stock market pushes the share price along by 13 percent.
Such a disconnection never lasts. Ultimately, a company's stock price growth will mirror its business's profit growth. If a stock's price appreciation outpaces business earnings, the stock price will either flatline or fall until it realigns with business earnings.
If business profit growth exceeds the stock's appreciation, at some point the stock will dramatically rise, realigning share price growth with that of business profits.
Connections between stock and business profits correlate strongly over long time periods—15 years or more. But short term, markets are mad because people are crazy.
Those trying to buy individual stocks need to forecast two things: future business earnings and people's reactions to those business earnings. For example, if financial analysts and the general investment public felt that Google's business earnings would grow by 15 percent next year, and the company's earnings grew by 13 percent instead, many shareholders would sell. No, I'm not suggesting such a move would be rational. It wouldn't be. But people aren't rational. Such selling would drop Google's share price, despite the impressive 13 percent business growth rate.
Predicting the general direction of the stock market is just as difficult. Even with a solid eye on the economy, human sentiment moves stock prices in the short term, not government policies or economic data. The existence of more buyers than sellers increases demand, so stock prices rise. Having more sellers than buyers increases supply, so prices fall. That's it—nothing more, nothing less. The stock market isn't its own entity, moving up and down like some kind of mystical scepter. Instead, its movements are a short‐term manifestation of what people do. Are they buying or are they selling? We move stock prices: the aggregate activities of you, global institutional investors, and me. Our groupthink is so unpredictable that most economists can't determine the market's direction. To do so accurately, they would have to predict human behavior. And they can't.
But over the long term, there's always a direct correlation between business earnings and stock prices. Warren Buffett's former Columbia University professor, Benjamin Graham, referred to the stock market as a short‐term voting machine or popularity contest, but a long‐term weighing machine.10 Business earnings and stock price growth are two separate things. But in the long term, they tend to reflect the same result. For example, if a business grew its profits by 1,000 percent over a 30‐year period, the stock price, including dividends, would perform similarly.
It's the same for a stock market in general. If the average company within a stock market grows by 1,000 percent over 30 years (that's 8.32 percent annually), the stock market would reflect such growth. Over the long term, stock markets predictably reflect the fortunes of the businesses within them. But over shorter time periods, the stock market is nuts.
Fast‐Growing Economies Can Produce Weak Returns
Adding to the difficulty of predicting stock market growth is the fact that emerging stock markets don't seem to follow the same rules. For example, everybody knows that China's economic growth has run circles around US growth for the past 20 years. But here's a trivia question to ask a friend. Knowing what you know now, if you went back 20 years in a time machine with $10,000 to invest, would you want to spread your money among 100 randomly selected Chinese stocks or 100 randomly selected US stocks?
Most people would choose China. But inflation would have crushed them for it. According to a July 15, 2013, article in Bloomberg.com, since the Chinese market opened up (in 1993), “Foreigners earned less than 1 percent a year investing in Chinese stocks, a sixth of what they would have made owning US Treasury bills.”11 This means an investor in Chinese stocks would have turned $10,000 into less than $12,200 between 1993 and 2013. However, the same investment in US stocks would have grown to $47,655.12
Let's extend that three more years. If $10,000 were invested in Chinese stocks in 1993, it would have been worth about $13,173 by May 18, 2017 (the time of this writing). If, on the other hand, the same $10,000 were invested in US stocks, it would have grown to about $78,778.13
Such disparity between economic growth and stock market growth isn't prevalent just in China. Emerging markets (India, Thailand, Indonesia, etc.) have definitely benefited as villagers have migrated to cities, worked at better jobs, and spent higher wages. In some cases, their bathrooms were outhouses. Many of those same people now fart through silk. But shadier legal frameworks and poor corporate governance sometimes leave stains.
As Yale University finance professor David Swensen writes in his book Pioneering Portfolio Management, “A particularly prevalent problem in many Asian countries involves family‐controlled companies satisfying family desires at the expense of external minority shareholder wishes.”14 Most global expats are aware of the corruption among many emerging‐market businesses. Such palm greasing is one of the reasons strong economic growth doesn't always manifest itself in the stock market.
While emerging‐market economic growth has run circles around US growth, the developed world's stock markets haven't been left behind.
Numbers from the World Bank's International Finance Corporation, for instance, reveal that $100,000 invested in a broad, random selection of emerging‐market stocks in 1985 (the earliest date from which we have emerging‐market data) would have been worth $1.08 million by 2006. The same $100,000 invested in US markets would have grown to more than $1.3 million. And if it were invested in developed‐world stock markets (excluding the United States), it would have grown to $1.16 million.15
Let's update those numbers to the time of this writing (May 18, 2017). If $100,000 were invested in US stocks in 1985, it would have grown to about $3.16 million. If it were invested in developed‐world stocks (excluding the United States), it would have grown to roughly $1.8 million. If it were invested in emerging‐market stocks from 1985 until May 18, 2017, it would have grown to about $1.89 million.16
Nobody knows which stock markets are going to do well this year or over the next decade. Sometimes emerging markets do well. Sometimes developed markets win. That's why smart investors are like the young gardener I mentioned at the beginning of this chapter. They sow every type of seed. They invest in a representation of the entire world's market so they don't get caught with their pants down when a sector takes off (or when a specific stock market sector falls off a cliff).
Many people hire advisors to guess which investment sectors they think will do well. But speculating is silly, as I'll show in later chapters. Instead of rolling the dice with a soothsayer, trying to predict which market will outperform, it's better to diversify money across every sector at the lowest possible cost.
Unfortunately, many global expatriates fail to do so. And their retirements pay the price.
Bonds Are Protective Nets for Jumpers
Besides investing in stocks, smart investors choose bonds as well. When investing in bonds, individuals loan a government or corporation money in exchange for a fixed rate of interest. Bonds underperform stocks—not every year or every decade, but over the long haul, they do. But they aren't as volatile. An investor, for example, with the majority of his or her money in bonds issued by a developed country's government wouldn't suffer a 50 percent investment loss if the stock market dropped by half. In some cases, such an investor might gain money when stocks drop.
Investment portfolios composed of stocks and bonds are less volatile and more diversified than those made up solely of stocks. So they're safer.
In the short term, investments get yanked about based on supply and demand. When demand for stocks is especially high (many more buyers than sellers), stocks rocket. But for stocks to rise so quickly, people would be buying them with abandon. Where do they get such money for their stock market purchases? Many pull proceeds from savings accounts, mattresses (if they're nuts), gold, real estate, and bonds. If enough money is pulled from gold, real estate, and bonds, these asset classes fall in price. Their supply would exceed their demand.
When stocks are roaring, investors selling bonds can force bond prices to drop. Always remember that short‐term asset class movements are a result of supply and demand. If more people are selling bonds than buying, supply outweighs demand. So bond prices fall. If more people are buying bonds than selling, bond prices rise.
You don't have to know the intricacies of how bonds work. Just make sure your portfolio includes a government bond index (which I'll explain later in the book). If, however, you want to know how bonds work, here it is in a nutshell.
There are a few different types of bonds, but I'll explain the most common with a story. Assume your eccentric Uncle James wants you to save, so he makes you a deal. If you give him $10,000, he'll invest the money for himself however he sees fit. You arrange for him to keep the money for five years. In the meantime, he gives you cash interest. He promises 5 percent per year. This is called a 5 percent coupon. In this case, the yield is also 5 percent. Uncle James promises to pay you $500 annually. He pays it twice a year, $250 each time.
At the end of the five‐year term, Uncle James will return the $10,000. You will have recouped the $10,000, plus earned $500 for every year your uncle held your money.
But what if you had asked him to return the $10,000 before the end of the five‐year term? This is where Uncle James's quirkiness shines. He may decide to return just $9,800. Or he may give you a gift, handing over $10,300.
Uncle James guarantees he'll return exactly what you give him only if he's able to hold the money for the duration agreed upon. If you want the money early, the strange duck might return more than you gave him, or less.
Here's where Uncle James gets weirder. Assume that one year after you invested your initial $10,000 with him, your friend Amy wants in on the action. She approaches your uncle, who makes her a deal. “Amy, you can buy into the same scheme, but it expires in four years. This means you have only four years to earn interest, not five. I'm returning all of the money four years from now—yours (if you choose to invest) and your friend's.” But bank interest rates have risen, so Amy starts wondering why she would invest with your uncle when the interest rate he promises is now lower than what she can earn elsewhere. “I'll tell you what,” says Uncle James. “If you invest just $9,500, I'll pay you $500 per year (equivalent to 5 percent of $10,000), but when the term expires in four years, I'll give you $10,000 instead of just the $9,500 you invested.”
In such a case, the investment's coupon is 5 percent of $10,000. It was the set interest rate on the initial $10,000 investment deal you made with Uncle James. But the investment yield is higher for Amy because she gets her $500 per year at a discount. She invests $9,500, will earn $500 per year in interest, and will receive $10,000 back at the end of four years. Consequently, her investment yields 5.3 percent per year.
If bank interest rates had dropped instead, Uncle James would have done something different. Realizing what a great deal he was offering compared to the dropping interest rates of the banks, he would have told Amy, “You can invest in this scheme. You will receive a 5 percent coupon on $10,000 but it will cost you $10,500, not $10,000. Therefore, your yield would be 4.8 percent, not 5 percent, because I'll return less than what you invested. It would still be profitable, of course, because you would receive $500 per year. But it would be less so.”
If you followed this strange little story, then you'll understand how most bonds work. Newly issued bonds have an expiration term and a fixed rate of interest. Investors purchasing such bonds when they're launched earn the same coupon and yield. If the interest paid amounts to 3 percent per year, this is what investors will make each year if they hold the bonds to maturity. If they sell early, they would receive more or less than what they deposited, depending on current bond prices. If they hold the bonds to maturity, they would receive exactly what they had invested, plus the cash interest they had earned twice a year.
Other investors can jump into a bond after the initial launch date. But if demand for bonds is high, they'll pay a premium for the bond. So their yield will be lower than the coupon rate that was advertised when the bond was launched. If demand for bonds is lower (this occurs when bank interest rates rise), bond prices drop. This increases the yield for new investors jumping into the same bond.
Can You Lose Money with Bonds?
Those buying low‐grade corporate bonds from companies with shaky financial foundations can certainly lose money. To entice investors, such companies offer higher than average interest rates. For example, assume a new technology company needs money for research and development. It might issue a bond with a 10 percent coupon, which is well above typical rates. But if the company goes bankrupt, investors might lose some or all of their original capital. It could get flushed down the toilet, along with the company's future.
Likewise, investors loading up on long‐term bonds can lose money in real terms. Remember that a real return is the profit made after inflation. If investors bought bonds maturing in 20 years with coupons of 3 percent per year, inflation could devour the profits. Sure, they would still earn 3 percent per year on their investment. But if inflation averaged 4 percent, the investor's real return would be negative. Such interest payments would lose to the rising price of a box of corn flakes.
That's why I recommend shorter term or broad market government bond index funds. Every year you'll see a “Bonds Are Going to Crash” headline. They might quote some crazy banker whose mother dropped him on his head.
In Figure 1.2, you can see the sleepiness of a broad US government bond index. The roller‐coaster line on top is the S&P 500 (VFINX). You should be able to see the stock market crash of 1987, the crash of 2002–2003, and the crash of 2008–2009. The line below it represents Vanguard's US Bond Market Index (VBMFX) with all interest reinvested. Compared to the stock market's movement, government bond index funds don't crash.
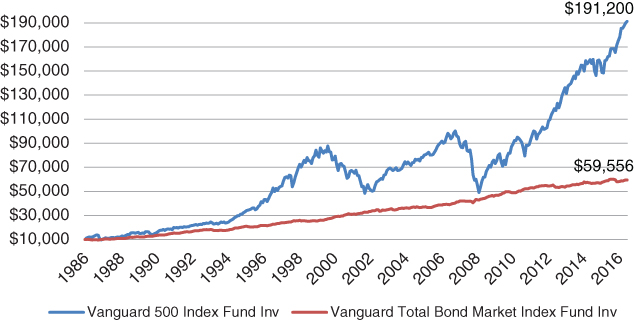
Figure 1.2 Bonds Are More Stable than Stocks
SOURCE: Vanguard.
Patience, diversification, and low investment costs are keys to large profits in the stock and bond markets. To earn such returns, however, investors must avoid the industry's traps. Let me show you how.