Rechargeable Batteries and Their Management
9.1 Introduction
The insatiable demand for smaller, lightweight portable electronic equipment has dramatically increased the need for research on rechargeable (or secondary) battery chemistries. In addition to achieving improved performance on lead acid and nickel cadmium (NiCd) batteries, during the last decade, many new chemistries such as nickel metal hydride (NiMH), lithium ion (Li-ion), rechargeable alkaline, silver-zinc, zinc-air, lithium polymer, and the like have been introduced.
Higher energy density, superior cycle life, environmental friendliness, and safe operation are among the general design targets of battery manufacturers. To complement these developments many semiconductor manufacturers have introduced new integrated circuit families to achieve the best charge/discharge performance and longest possible lifetime from battery packs.
This chapter describes the characteristics of battery families such as sealed lead acid, NiCd, NiMH, Li-ion, rechargeable alkaline, and zinc-air together with modern techniques used in battery management ICs, without elaborating on the battery chemistries. Concepts and applications related to systems management bus and smart battery system also are introduced.
9.2 Battery Terminology
9.2.1 Capacity
Battery or cell capacity is measured as an integral of current (i) over a defined period of time (t):
This equation applies to either the charge or discharge; that is, the capacity added or capacity removed from a battery or cell. The capacity of a battery or cell is measured in milliampere-hours (mAh) or ampere-hours (Ah).
Although the basic definition is simple, many different forms of capacity are used in the battery industry. The distinctions among them reflect differences in the conditions under which the capacity is measured.
Standard capacity measures the total capacity that a relatively new but stabilized production cell or battery can store and discharge under a defined standard set of application conditions. It assumes that the cell or battery is fully formed, charged at the standard temperature at the specification rate, and discharged at the same standard temperature at a specified standard discharge rate to a standard end-of-discharge voltage (EODV). The standard EODV itself is subject to variation depending on discharge rate as discussed.
When any of the application conditions differ from standard, the capacity of the cell or battery changes. The term actual capacity includes all nonstandard conditions that alter the amount of capacity the fully charged new cell or battery is capable of delivering when fully discharged to a standard EODV. Examples of such situations might include subjecting the cell or battery to a cold discharge or a high-rate discharge.
That portion of actual capacity which can be delivered by the fully charged new cell or battery to some nonstandard EODV is called available capacity. Therefore, if the standard EODV is 1.6 volts per cell, the available capacity to an EODV of 1.8 volts per cell would be less than the actual capacity.
Rated capacity is the minimum expected capacity when a new but fully formed cell is measured under standard conditions. This is the basis for C rate and depends on the standard conditions used, which may vary depending on the manufacturers and the battery types.
If a battery is stored for a period of time following a full charge, some of its charge will dissipate. The capacity that remains and can be discharged is called the retained capacity.
9.2.2 C Rate
The C rate is the rate in amperes or milliamperes numerically equal to the capacity rating of the cell given in ampere-hours or milliampere-hours. For example, a cell with a 1.2 Ah capacity has a C rate of 1.2 amps. The C concept simplifies the discussion of charging for a broad range of cell sizes, since the cells’ responses to charging are similar if the C rate is the same. Normally, a 4 Ah cell will respond to a 0.4 amp (0.1 C) charge rate in the same manner that a 1.4 Ah cell will respond to a 0.14 amp (also 0.1 C) charge rate.
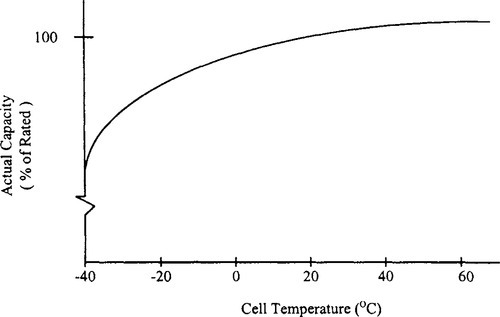
The rate at which current is drawn from a battery affects the amount of energy that can be obtained. At low discharge rates the actual capacity of a battery is greater than at high discharge rates. This relationship is shown in Figure 9-1.

9.2.3 Energy Density
The energy density of a cell is its energy divided by its weight or volume. This is called the gravimetric energy density when weight is used, and the volumetric energy density when volume is used. (The terms energy density and specific energy sometimes are used for volumetric and gravimetric measures, respectively; Bennett and Brown, 1997.)
9.2.4 Cycle Life
Cycle life is a measure of a battery’s ability to withstand repetitive deep discharging and recharging using the manufacturer’s cyclic charging recommendations and still provide the minimum required capacity for the application. Cyclic discharge testing can be done at any of various rates and depths of discharge to simulate conditions in the application. It must be recognized, however, that cycle life has an inverse logarithmic relationship to depth of discharge.
9.2.5 Cyclic Energy Density
For comparison, a better measure of rechargeable battery characteristics is a composite characteristic that considers energy density over the service life of the battery. This composite characteristic, cyclic energy density, is the product of energy density and cycle life at that energy density and measured in the dimensional units watt-hour-cycles/kilogram (gravimetric) or watt-hour-cycles/liter (volumetric).
9.2.6 Self-Discharge Rate
The self-discharge rate is a measure of how long a battery can be stored and still provide the minimum required capacity and be rechargeable to the rated capacity. This commonly is measured by placing batteries on shelf at room (or elevated) temperature and monitoring open circuit voltage over time. Samples are discharged at periodic intervals to determine remaining capacity and recharged to determine rechargeability.
9.2.7 Charge Acceptance
Charge acceptance is the willingness of a battery or cell to accept a charge. This is affected by cell temperature, charge rate, and the state of charge.
9.2.8 Depth of Discharge
The depth of discharge is the capacity removed from a battery divided by its actual capacity, expressed as a percentage.
9.2.9 Voltage Plateau
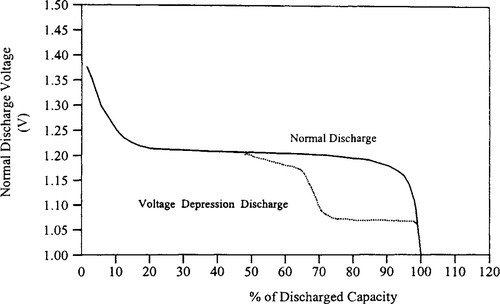
The voltage plateau is the protracted period of very slowly declining voltage that extends from the initial voltage drop at the start of a discharge to the knee of the discharge curve (Figure 9-2).
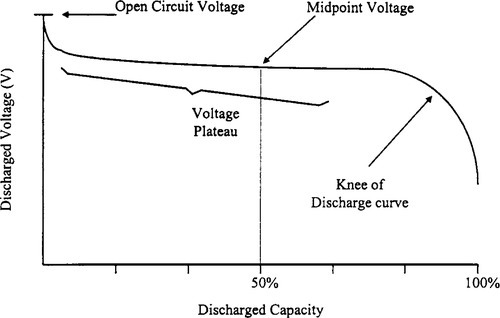
9.2.10 Midpoint Voltage
The midpoint voltage is the battery voltage when 50% of the actual capacity has been delivered (see Figure 9-2).
9.2.11 Overcharge
Overcharge is the continued charging of a cell after it has become fully charged. When a cell is not yet fully charged, the electrical energy of the charge current is converted to chemical energy in the cell by the charging reactions. But, when all the available active material has been converted to a charged state, the energy available in the charging current goes to produce gases from the cell or to activate other nonuseful chemical reactions.
9.3 Battery Technology: An Overview
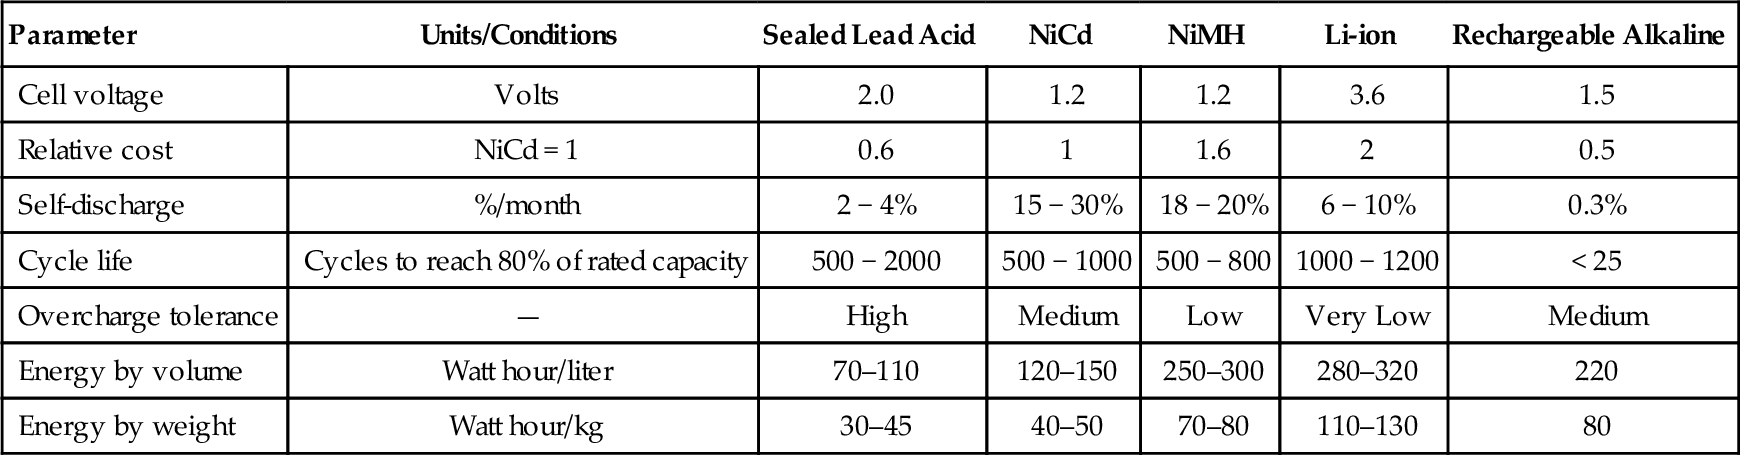
Many types of rechargeable chemistry are used in electronic systems. Today, most batteries are NiCd, NiMH, and sealed lead acid, with lithium-ion making headway into portable systems. The choice of a particular battery technology for a given system is typically limited by size, weight, cycle life, and cost. A comparison of some basic characteristics of the five major types of battery chemistry is depicted in Table 9-1.
Table 9-1
Battery chemistry characteristics
| Parameter | Units/Conditions | Sealed Lead Acid | NiCd | NiMH | Li-ion | Rechargeable Alkaline |
| Cell voltage | Volts | 2.0 | 1.2 | 1.2 | 3.6 | 1.5 |
| Relative cost | NiCd = 1 | 0.6 | 1 | 1.6 | 2 | 0.5 |
| Self-discharge | %/month | 2 − 4% | 15 − 30% | 18 − 20% | 6 − 10% | 0.3% |
| Cycle life | Cycles to reach 80% of rated capacity | 500 − 2000 | 500 − 1000 | 500 − 800 | 1000 − 1200 | < 25 |
| Overcharge tolerance | — | High | Medium | Low | Very Low | Medium |
| Energy by volume | Watt hour/liter | 70–110 | 120–150 | 250–300 | 280–320 | 220 |
| Energy by weight | Watt hour/kg | 30–45 | 40–50 | 70–80 | 110–130 | 80 |
NiCd batteries presently power most rechargeable consumer appliances. The technology is mature and well understood. However, cadmium is coming under increasing regulatory scrutiny (including mandatory recycling in some jurisdictions) and the maturity of NiCd technology also means most of the capacity and life cycle improvements already have been made.
NiMH offers incremental improvements in energy density both by weight and volume over NiCd. Li-ion is better still, offering over twice the watts per liter and per kilogram of NiCd batteries. As always, this higher performance comes at a higher price. NiMH and Li-ion are increasing in popularity as upgrade options or in applications that support a higher price/performance point. The advantages of NiMH and Li-ion chemistry, however, also come at the cost of greater electrical fragility. Li-ion particularly is more easily and extensively damaged by less than optimal battery management, so much so that fail-safe circuits to disconnect the cells from the load under overcurrent or overtemperature conditions usually are built into the battery pack.
Rechargeable alkaline batteries mimic the form and replace the function of disposable household batteries. While initially more expensive, they cost less over their lifetime than the equivalent in disposable batteries. They are the least expensive form of rechargeable chemistry for low current applications and have the lowest self-discharge rate. However, they have the shortest cycle life in deep discharge applications.
Lead-acid batteries are most familiar in automobiles because they are the most economical chemistry for delivering large currents. Lead-acid batteries also have a long trickle life and therefore serve well for classic “floating” applications. Although flooded lead-acid technology is popular for automobile and similar applications, sealed lead-acid batteries serve the electronic engineering environment. On the downside, lead-acid has the least capacity by volume and weight.
Table 9-1 lists the major advantages and disadvantages of the five chemistries. Chemistry selection involves trade-offs driven by the technical requirements and economics of the application.
9.4 Lead-Acid Batteries
9.4 1 Flooded Lead-Acid Batteries
The flooded lead-acid battery of today basically uses the design developed by Faure in 1881. It consists of a container with multiple plates immersed in a pool of dilute sulfuric acid. Recombination is minimal, so water is consumed throughout the battery life and the batteries can emit corrosive and explosive gases when experiencing overcharge. So-called maintenance-free forms of flooded batteries provide excess electrolytes to accommodate water loss throughout a normal life cycle. Most industrial applications for flooded batteries are found in motive power, engine starting, and large system power backup. Today, other forms of battery have largely supplanted flooded batteries in small- and medium-capacity applications, but in larger sizes flooded lead-acid batteries continue to dominate. By far, the biggest application for flooded batteries is starting, lighting, and ignition service on automobiles and trucks. Large flooded lead-acid batteries also provide motive power for equipment ranging from forklifts to submarines and provide emergency power backup for many electrical applications, most notably the telecommunication network.
9.4.2 Sealed Lead-Acid Batteries
Sealed lead-acid batteries first appeared in commercial use in the early 1970s. Although the governing reactions of the sealed cell are the same as other forms of lead-acid batteries, the key difference is the recombination process that occurs in the sealed cell as it reaches full charge. In conventional flooded lead-acid systems, the excess energy from overcharging goes into the electrolysis of water in the electrolyte with the resulting gases being vented. This occurs because the excess electrolyte prevents the gases from diffusing to the opposite plate and possibly recombining. Thus, electrolyte is lost on the overcharge and must be replenished. The sealed-lead cell, like the sealed nickel-cadmium cell, uses recombination to reduce or eliminate this electrolyte loss.
Sealed lead-acid batteries for electronics applications are somewhat different from the type commonly found in the automobile. There are two types of sealed lead-acid batteries: the original gelled electrolyte and retained (or absorbed) system. The gelled electrolyte system is obtained by blending silica gel with an electrolyte, causing it to set up in gelatin form. The retained system employs a fine glass fiber separator to absorb and retain liquid electrolyte. Sometimes the retained system is called an absorbed glass mat (AGM). The AGM also is known as a starved design. Starved means the absorption limits of the glass separator create a limitation to the AGM design relating to diffusion properties of the separator. In certain cases, the AGM battery must be racked and trayed in a specific position for optimum performance. Both types, gelled and AGM, are called valve regulated lead acid (VRLA) systems. Today, sealed-lead cells are operating effectively in many markets previously closed to lead-acid batteries. For a detailed account of lead-acid cells, see Gates Energy Products Inc. (1992), Hirai (1990), and Moore (1993). Meanwhile, some manufacturers have introduced special versions of sealed lead-acid batteries with higher volumetric energy density; for example, the Portable Energy Products, Inc., ThinlineTM series and the Bolder Technologies Corporation Thin Metal Film (TMFTM), both with comparatively higher energy densities (Moneypenny and Wehmeyer, 1994; Nelson, 1997).
9.4.2.1 Discharge Performance of Sealed-Lead Acid Cells
The general shape of the discharge curve, voltage as a function of capacity (if the current is uniform) is shown in Figure 9-2. The discharge voltage of the starved-electrolyte sealed-lead acid battery typically remains relatively constant until most of its capacity is discharged. It then drops off sharply. The flatness and the length of the voltage plateau relative to the length of the discharge are major features of sealed-lead cells and batteries. The point at which the voltage leaves the plateau and begins to decline rapidly often is identified as the knee of the curve. Starved-electrolyte sealed-lead acid batteries may be discharged over a wide range of temperatures. They maintain adequate performance in cold environments and may produce actual capacities higher than their standard capacity when used in hot environments. Figure 9-3 illustrates the relationships between capacity and cell temperature. Actual capacity is expressed as a percentage of rated capacity as measured at 23 °C.
9.4.2.2 Capacity During Battery Life
The initial actual capacity of sealed-lead acid batteries is almost always lower than the battery’s rated or standard capacity. However, during the battery’s early life, the actual capacity increases until it reaches a stabilized value, which usually is above the rated capacity. The number of charge/discharge cycles or length of time on float charge required to develop a battery’s capacity depends on the specific regime employed. Alternatively, a battery that is on charge at 0.1 C usually is stabilized after receiving a 300% (of rated capacity) overcharge. The process may be accelerated by charging and discharging at low rates.
Under normal operating conditions, the battery’s capacity will remain at or near its stabilized value for most of its useful life. Batteries then will begin to suffer some capacity degradation due to their age and the duty to which they have been subjected. This permanent loss usually increases slowly with age until the capacity drops below 80% of its rated capacity, which often is defined as the end of useful battery life. Figure 9-4 shows the capacity variation with cycle life that can be expected from sealed-lead acid batteries.

9.4.2.3 Effect of Pulse Discharge on Capacity
In some applications, the battery is not called on to deliver a current continuously. Rather, energy is drawn from the battery in pulses. By allowing the battery to “rest” between these pulses, the total capacity available from the battery is increased. Figure 9-5 shows typical curves representing the voltage delivered as a function of discharged capacity for pulsed and constant discharge at the same rate.
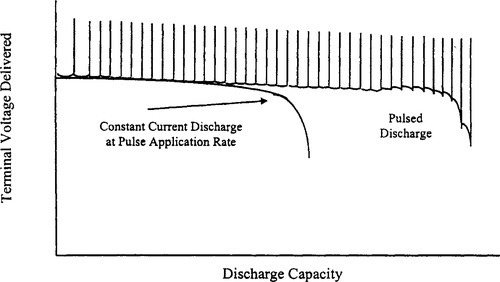
For the pulsed curve, the upper line represents the open-circuit voltage and the lower line represents the voltages during the periods when the load is connected. The use of discharged capacity as the abscissa eliminates the rest periods and shows only the periods of useful discharge.
9.4.3 Charging
In general, experience with sealed-lead acid cells and batteries indicates that application problems are more likely to be caused by undercharging than overcharging. Since the starved-electrolyte cell is relatively resistant to damage from overcharging, designers may want to ensure that the batteries are fully charged, even at the expense of some degree of overcharge. Obviously, excessive overcharging, either in magnitude or duration, still should be avoided.
The charge acceptance of sealed-lead acid batteries in most situations is quite high, typically greater than 90%. A 90% charge acceptance means that for every ampere-hour of charge introduced into the cell, the cell will be able to deliver 0.9 Ah to a load. Charge acceptance is affected by a number of factors including cell temperature, charge rate, state of charge, age, and the method of charging (Figure 9-6).

The state of charge of the cell, to some extent, will dictate the efficiency with which the cell will accept a charge. When the cell is fully discharged, the charge acceptance initially is quite low. As the cell becomes only slightly charged, it accepts current more readily and the charge acceptance jumps quickly, approaching 98% in some situations. The charge acceptance stays at a high level until the cell approaches full charge.
As mentioned earlier, as the cell becomes fully charged, some of the electrical energy begins generating gas, which represents a loss in charge acceptance. When the cell is fully charged, essentially, all the charging energy generates gas, except for the very small current that makes up for internal losses that otherwise would be manifested as self-discharge. A generalized curve representing these phenomena is shown in Figure 9-6(a).
As with most chemical reactions, temperature has a positive effect on the charging reactions in the sealed-lead acid cell. Charging is more efficient at higher temperatures than at lower temperatures, all other parameters being equal, as shown in Figure 9-6(b).
The starved-electrolyte sealed-lead cell charges very efficiently at most charging rates. The cell can accept a charge at accelerated rates (up to the C rate) as long as the state of charge is not so high that excessive gas is generated. And the cell can be charged at low rates with excellent charge acceptance.
Figure 9-6(c) shows the generalized curve of charge acceptance now further defined by charging rates. When examining these curves, note that, at high states of charge, low charge rates provide better charge acceptance.
In the starved-electrolyte sealed-lead acid cell at typical charging rates, the bulk of the gases is recombined and there is virtually no venting of gases from the cell if it is overcharged.
9.5 Nickel-Cadmium Batteries
Sealed NiCd batteries are especially well suited to applications where a self-contained power source increases the versatility or reliability of the product. Among the significant advantages of NiCd families are higher energy density and dischargerates, fast recharge capability, and long operating and storage life. This places NiCd families at the top of usage in the portable products. In addition, the NiCd batteries are capable of operating over a wide temperature range and in any orientation with reasonable continuous overcharge capability.
9.5.1 Construction
NiCd secondary batteries operate at 1.2 V, using nickel oxyhydroxide for the active material in the positive electrode. The active material of the negative electrode consists of cadmium, and an alkali solution acts as the electrolyte. In NiCd batteries, a reaction at the negative electrode consumes the oxygen gas that generates at the positive electrode during overcharging. The design prevents the negative electrode from generating hydrogen gas, permitting a sealed structure. NiCd batteries mainly adopt cylindrical or prismatic configurations.
9.5.2 Discharge Characteristics
The discharge voltage of a sealed NiCd cell typically remains relatively constant until most of its capacity is discharged. It then drops off rather sharply. The flatness and length of the voltage plateau relative to the length of discharge are major features of sealed NiCd cells and batteries. The discharge curve, when scaled by considering the effects of all the application variables, provides a complete description of the output of a battery. Differences in design, internal construction, and conditions of actual use of cell affect the performance characteristics. As an example, Figure 9-7 illustrates the typical effect of discharge rate.

9.5.3 Charge Characteristics
Nickel-cadmium batteries are charged by applying a current of proper polarity to the terminals of the battery. The charging current can be pure direct current (DC) or it may contain a significant ripple component such as half-wave or full-wave rectified current.
This section on charging sealed nickel-cadmium batteries refers to charging rates as multiples (or fractions) of the C rate. These C rate charging currents can be categorized into descriptive terms, such as standard charge, quick charge, fast charge, or trickle charge as shown in Table 9-2.
Table 9-2
Categories of rates for charging NiCd cell
| Method of Charging | Charge rate (multiples of C rate) | Recharge Time (hours) | Charge Control |
| Standard | 0.05 | 36–48 | Not required |
| 0.1 | 16–20 | ||
| Quick | 0.2 | 7–9 | Not required |
| 0.25 | 5–7 | ||
| 0.33 | 4–5 | ||
| Fast | 1 | 1.2 | |
| 2 | 0.6 | ||
| 4 | 0.3 | Required | |
| Trickle | 0.02 − 0.1 | Used for maintaining a fully charged battery | |

When a nickel-cadmium battery is charged, not all of the energy input goes to converting the active material to a usable (chargeable) form. Charge energy also goes to converting active material into an unusable form, generates gas, or is lost in parasitic side reactions.
Figure 9-8 shows the charge acceptance of NiCd cells. The ideal cell, with no charge acceptance loss, would be 100% efficient. All the charge delivered to the cell could be retrieved on discharge. But nickel-cadmium cells typically accept charge at different levels of efficiency, depending on the state of charge of the cell, as shown by the bottom curve of Figure 9-8.
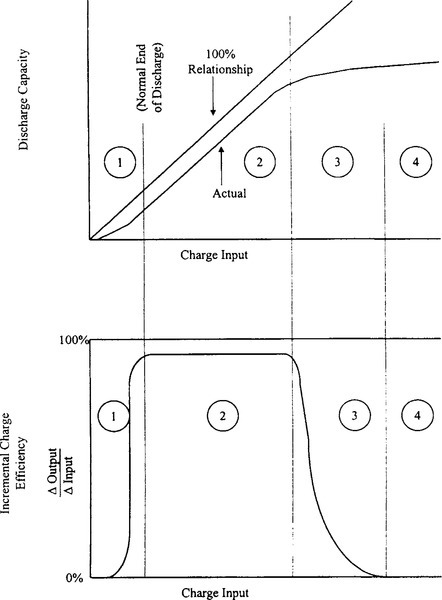
Figure 9-8 describes this performance for successive types of charging behavior (zones 1, 2, 3, and 4). Each zone reflects a distinct set of chemical mechanisms responsible for loss of charge input energy.
In zone 1, a significant portion of the charge input converts some of the active material mass to an unusable form; that is, charged material not readily accessible during medium- or high-rate discharges, particularly in the first few cycles. In zone 2, the charging efficiency is only slightly less than 100%; small amounts of internal gas and parasitic side reactions are all that prevent the charge from being totally efficient. Zone 3 is transition region.
As the cell approaches a full charge, the current input shifts from charging positive active material to generating oxygen gas. In the overcharge region, zone 4, all the current coming into the cell generates gas. In this zone, the charging efficiency is practically none.
The boundaries between zones 1, 2, 3, and 4 are indistinct and vary depending on cell temperature, construction, and charge rate. The level of charge acceptance in zones 1, 2, and 3 also is influenced by cell temperature and charge rate. For details, see Gates Energy Products (1992).
9.5.4 Voltage Depression Effect
When some NiCd batteries are subjected to numerous partial discharge cycles and overcharging, cell voltage decreases below, 1.05 V/cell before 80% of the capacity is consumed. This is called the voltage depression effect; and the resulting lower voltage may be below the minimum voltage required for proper system operation, giving the impression that the battery has worn out (see Figure 9-7(b)). If cells are exposed to overcharging, particularly at higher temperatures, and this is quite common, the voltage may be about 150 mV lower than the normal cell voltage. Voltage depression is an electrically reversible condition that disappears when the cell is completely discharged and recharged. The voltage depression effect sometimes is called erroneously the memory effect, and clearing the same by charging and discharging is called conditioning.
9.6 Nickel-Metal Hydride Batteries
For those battery users who need high power in a small package and are willing to pay a higher price, an option is the nickel-metal hydride families, which offer a significant increase in cell power density. These extensions of NiCd cell technology to a new chemistry have become popular with product applications such as notebook computers and cellular phones. The first practical NiMH batteries entered the market in 1990.
In many ways, nickel-metal hydride batteries are the same as NiCd types: They use nickel for the positive electrode but a recently developed material, a hydrogen-absorbing alloy, for the negative electrode. With an operating voltage of 1.2 V, they provide high capacity, moreenergy density than NiCd models.
The NiCd cell is more tolerant of fast recharging and overcharging than NiMH cells. NiCd cells hold their charge longer than NiMH cells. NiCd cells will withstand 500–2000 charge/discharge cycles, compared to about 500 cycles for NiMH cells. Further, NiCd cells withstand a wider temperature range than NiMH cells.
On the other hand, NiMH cells seldom exhibit the notorious “memory effect” that NiCd cells sometimes do. As with any new technology, the prices for NiMH applications are higher than those of NiCds (Small, 1992; Eager, 1991; Furukawa, 1993; Briggs, 1994).
The voltage profile of NiMH cells during discharge is very similar to that of the NiCd cells. NiMH cells’ open-circuit voltage is 1.3–1.4 V. At moderate discharge rates, NiMH cells’ output voltage is 1.2 V. Both NiCd and NiMH cells have relatively constant output voltage during their useful service. Figure 9-9 is a typical graph from a battery company, comparing the output voltage of 700 mAh NiCd and 1100 mAh NiMH AA cells under load. Note that the NiMH cell’s greater capacity results in approximately 50% longer service life.
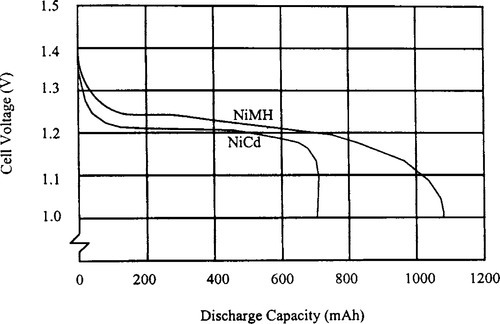
Figure 9-10 is another typical battery company graph showing that NiCd and NiMH batteries and cells charge in a similar fashion as well. However, the little bumps at the end of the two cell’s charge curves bare closer examination. You always will see these negative excursions, even though absolute cell voltages vary significantly with temperature.

The negative excursions signal a fully charged cell more or less independent of temperature, a useful quirk that sophisticated battery chargers exploit. Note that the NiCd cell’s negative-going voltage excursion after reaching a full charge is more pronounced than that of the NiMH cell.
There are several reasons for replacing NiCd batteries with NiMH types:
• NiCd batteries contain cadmium, which is harmful to the environment.
• NiMH has nearly the same operating voltage as NiCd, making them interchangeable.
• NiMH batteries have 30–40% higher capacity at the same physical size as NiCd batteries.
• NiMH batteries have a 90-minute charging capability.
9.7 Lithium-Ion Batteries
The demand for portable systems is increasing at a dramatic rate. To remain competitive, companies are offering lighter-weight and longer-run-time systems. Meeting these goals requires improvements in battery technology beyond traditional NiCd and NiMH systems.
Li-ion is a promising technology that can improve capacity for a given size and weight of a battery pack. With an energy density by weight about twice that of nickel-based chemistry (see Table 9-1), Li-ion batteries can deliver lighter weight packs of acceptable capacity. Li-ion also has about three times the cell voltage of NiCd and NiMH batteries; therefore, fewer cells are needed for a required voltage. The Li-ion batteries are becoming widely used in notebook PCs and many other portable systems because of their high energy density, declining costs, and readily available management circuits.
The first noticeable difference between Li-ion and nickel-based batteries is the higher internal impedance of the lithium-based batteries. Figure 9-11shows this by graphing the actual discharge capacity of a Li-ion cell at different discharge currents compared to a NiCd cell.
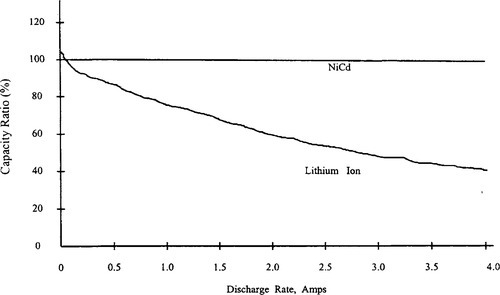
At a 2 amp discharge rate (2 C), less than 80% of the rated capacity is available from the Li-ion cell, compared to nearly 95% of the rated capacity for NiCd. For systems with discharge currents greater than 1 amp, the capacity realized from the Li-ion battery may be less than expected. Parallel battery stack configurations often are used in Li-ion battery packs to help reduce the severity of this problem. Li-ion technology requires re-examination of the charge and discharge characteristics of portable systems. Due to the nature of the chemistry, Li-ion batteries cannot tolerate overcharging and overdischarging.
The most important factor in using a Li-ion battery in a portable consumer product is safety. Fortunately, battery safety is comprehensively addressed by battery manufacturers in concert with the manufacturers of protection circuits and charge control circuits. For details, see Bennett and Brown (1997). Commercially available packs have an internal protection circuit that limits the cell voltage during charge to between 4.1 and 4.3 V per cell, depending on the manufacturer. Voltages higher than this rating could permanently damage the cell. A discharge limit of between 2.0 and 3.0 V (depending on the manufacturer) is necessary to avoid reducing the cycle life of the battery and damaging the battery.
The anode, or negative electrode, in a Li-ion cell is composed of a material capable of acting as a reversible Li-ion reservoir. The material usually is a form of carbon, such as coke, graphite, or pyrolytic carbon. The cathode, or positive electrode, also is a material that can act as a reversible lithium-ion reservoir.
Currently, the preferred cathode materials are LiCoO2, LiNiO2, or LiMn2O4 because of their high oxidation potentials of about 4 V versus lithium metal. Commercially available Li-ion cells use a liquid electrolyte made up of mixtures that are predominately organic carbonates containing one or more dissolved lithium salts (Levy, 1995).
Today, the predominant Li-ion technologies use coke or graphite as an anode material. Figure 9-12 illustrates the differences in the two types of cells during discharge. The graphite anode discharge voltage is relatively flat during a majority of the discharge cycle, while the coke anode discharge voltage is more sloped (Juzcow and St. Louis, 1996).
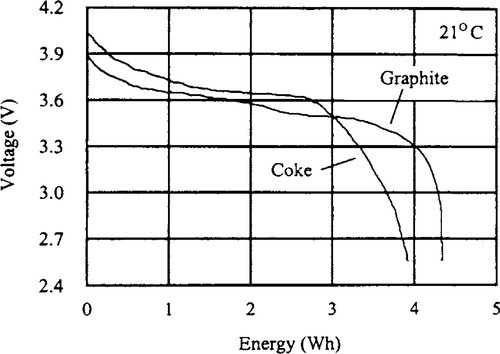
The energy available from the graphite anode cell is higher for a given capacity due to the higher average discharge voltage. This may be useful in systems that need the maximum watt-hour capacity for a given battery size. Also, the charge and discharge cutoff voltages between the two Li-ion systems vary among manufacturers.
Figure 9-13 shows the typical charge profile for Li-ion batteries. The charge cycle begins with a constant current limit and makes the transition to a constant-voltage limit, typically specified between 4.1 and 4.3 V ± 1%. This allows maximum charge capacity with no cell damage.

Charging to a lower voltage limit does not damage the cell, but the discharge capacity will be reduced. A 100 mV difference could change the discharge capacity by more than 7%. Basically, the difficult aspect of this type of charger is the wide dynamic range required from the switching current regulator given the tight voltage tolerance. Some chargers provide single-cell monitoring, while others rely on the internal protection circuit to do this.
9.8 Reusable Alkaline Batteries
Alkaline technology has been used in primary batteries for several years. With the development of the reusable alkaline manganese technology, secondary alkaline cells quickly made their way into many consumer and industrial applications. In many applications, reusable alkaline cells can be recharged from 75 to over 500 times, unlike single-use alkaline batteries, and initially have three times the capacity of a fully charged NiCd battery. These cells do not compete with NiCds in high-powered applications, however.
Intensive research and development activities carried out at Battery Technologies Inc. (BTI), Canada, and at the Technical University in Graz, Austria, in the late 1980s and early 1990s resulted in the successful commercialization of the rechargeable alkaline manganese dioxide zinc (RAMTM) system. BTI has chosen to sell licenses and production equipment, where necessary, for the manufacturing and worldwide marketing rights of its proprietary RAM technology. For example, Rayovac Corporation, one of the licensees, launched its line of reusable alkaline products under the name RenewalTM in the United States, Pure Energy Battery Corporation in Canada (Pure EnergyTM), and Young Poong Corporation in South Korea (AlcavaTM). For details, see Nossaman and Parvereshi (1995), Sengupta (1995), and Ivad and Kordesch (1997).
The chemistry behind the reusable approach depends on limiting the zinc anode to prevent overdischarge of the MnO2 cathode. Additives are incorporated to control hydrogen generation and other adverse effects on charging. The rated cycle life is 25 cycles to 50% of initial capacity. A longer cycle life is possible, depending on drain rate and depth of discharge. To take advantage of the reusable alkaline cell and increase its life, a special “smart charger” is required.
Using reusable alkaline cells can drive down the total battery cost to the consumer. This cost saving can be determined by looking at the cumulative capacity of a reusable cell vs. the one-time use of a primary alkaline cell. Figure 9-14 illustrates the capacity of AA cells being discharged down to 0.9 V at 100 mA. It shows that, although the initial use of the reusable alkaline is almost that of a primary alkaline battery, the reusable one can be recharged for continued use. Table 9-3 shows the increase in cumulative capacity by limiting the depth of discharge (DOD) and achieving more cycles.
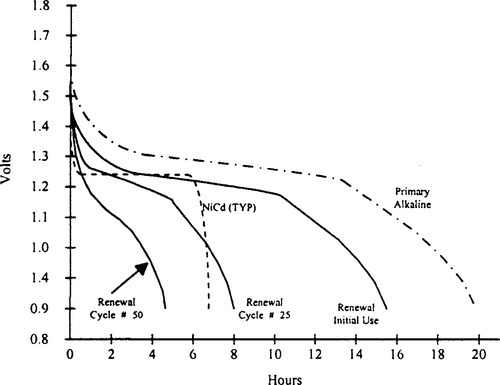
Table 9-3
Capacity of AA cells at various depths of discharge (values in mAh).
| Condition | 100% DOD | 125 mA to 0.9 V 30% DOD | 10% DOD |
| Cycle 1 | 1500 | 450 | 150 |
| Cycle 50 | 400 | ||
| Cumulative 50 | 33,000 | 22,000 | 7000 |
| Cumulative 100 | 44,000 | 15,000 | |
| Cumulative 500 | 73,000 |
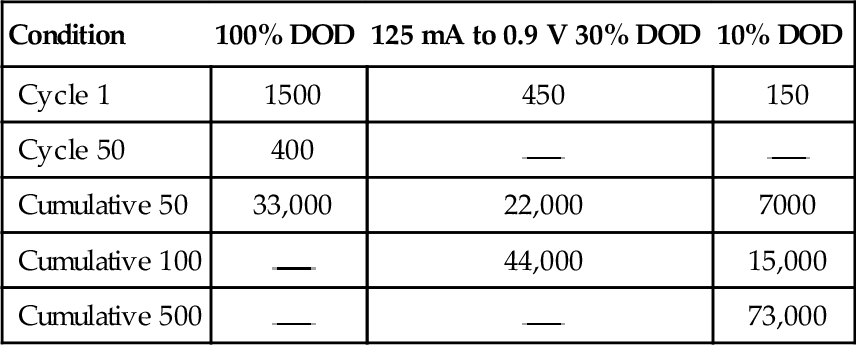
Source: Nossaman and Parvereshi, 1996.
Overcharging also affects the cycle life of reusable alkaline batteries. These batteries are not tolerant of overcharging and high continuous charge currents and may be damaged if high current is forced into them after they have reached a partially recharged state. Proper charging schemes should be used to prevent an overcharged condition.
9.9 Zinc-Air Batteries
Primary Zn-air batteries have been in existence for over 50 years in applications such as hearing aids and harbor buoys. The lightweight and high energy content in their technology has promoted research on Zn-air rechargeable chemistry by companies such as AER Energy Resources. The initial focus was on electric vehicles, but shifted toward portable appliances. Another application is solar powered rural telecom systems.
Rechargeable Zn-air technology is an air breathing technology in which the oxygen in the ambient air is used to convert zinc into zinc oxide in a reversible process. The cells use air breathing carbon cathode to introduce oxygen from air into potassium-hydroxide electrolyte. The cathode is multilayered with a hydrophilic layer, and the anode is composed of metallic zinc.
The characteristic voltage of the AER Energy rechargeable zinc-air system is a nominal 1 V. During discharge, the AER Energy cells operate at a voltage between 1.2 and 0.75 V. The current and power capability of the system is proportional to the surface area of the air breathing cathode. For more current and power, a larger surface area cell is required. For less current and power, a smaller cell may be used. Compared to other rechargeable chemistries, Zn-air needs an air manager for an intake and exhaust of air to allow the chemical process.
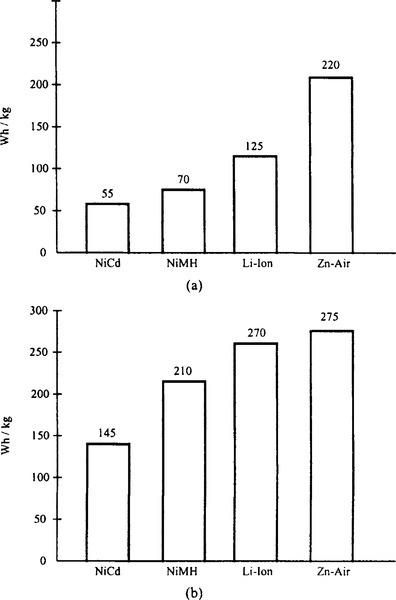
Figure 9-15 compares the gravimetric and volumetric energy densities of several rechargeable battery technologies. It clearly shows that Zn-air batteries require less weight and volume. Discharge and charge characteristics of Zn-air batteries are shown in Figure 9-16.
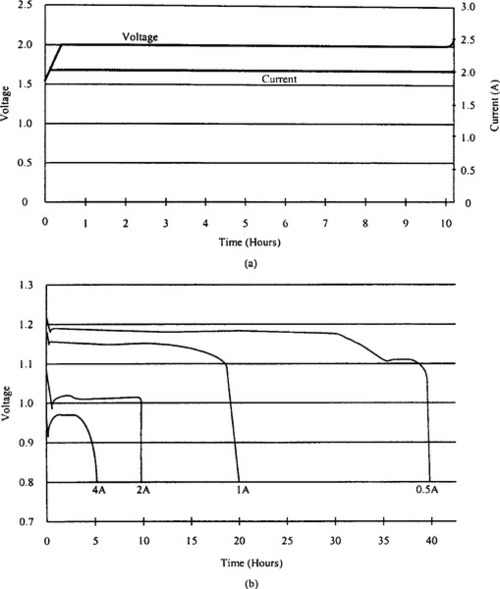
The cells exhibit a flat voltage profile over the discharge cycle. The typical charge voltage is 2 V per cell using a constant voltage/current taper approach. The battery’s life cycle varies between 50 and 400, depending on the depth of discharge. The cost per watt-hour is apparently lower than in nickel- and lithium-based chemistries. For details, see Cutler (1997).
9.10 Battery Management
Two decades ago, battery management meant a reliable, fast, and safe charging methodology for a battery bank, together with the monitoring facilities to detect the discharge condition of the battery pack. With new battery technologies emerging, demands from the cost-sensitive portable product market, and the medium-power-range products such as uninterruptible power supplies (UPS) and telecom power units, the attributes of a modern battery management system must include
• Battery charging methods and charge control.
• End of discharge determination.
• Gas gauging.
• Monitoring battery health issues.
• Communication with the host system or power management subsystems.
The following sections discuss concepts and techniques related to managing nickel-based, sealed lead-acid, and Li-ion battery systems. A discussion on rechargeable alkaline batteries is beyond the depth of this chapter. Kuribayashi (1993), Levy (1995), and Ivad and Kordesch (1997) provide some details on managing rechargeable alkaline cells.
9.10.1 Charging Systems
While four major battery families can accept either a standard (16–24 hour) or fast (2–4 hour) charge, the discussion here is limited to fast charging methods. Slower charging schemes tend to be found in simpler, price-sensitive applications, which do not need (or cannot afford) much beyond a charger and a low battery indicator.
The objective of fast charging a battery is to cram as much energy as it takes to bring the battery back to fully charged state in the shortest possible time without damaging the battery or permanently affecting its long-term performance. Since current is proportional to energy divided by time, the charging current should be as high as the battery systems reasonably will allow. For the constant-current cells (NiCd and NiMH), a 1 C charge rate typically will return more than 90% of the battery’s usable discharge capacity within the first hour of charging. The constant-potential cells (lead-acid and lithium-ion) are a bit slower to reach the 90% mark but generally can be completely recharged within 5 hours.
Fast charging has compelling benefits but places certain demands on the battery system. A properly performed fast charge, coordinated to the specifications of a battery rated for such charging, will deliver a long cycle life. The high charging rates involved, however, cause rapid electrochemical reactions within the cells of the battery. After the battery goes into overcharge, these reactions cause a sharp increase in internal cell pressure and temperature.
Uncontrolled high-rate overcharge quickly causes irreversible battery damage. Therefore, as the battery approaches a full charge, the charging current must be reduced to a lower “top-off” level, or curtailed entirely.
9.10.1.1 Charge Termination Methods
If a rapid charge is applied to a battery pack, it is necessary to select a reliable method to terminate charging at the fully charged position. Two practical approaches for charge termination are temperature termination and voltage termination.
9.10.1.1.1 Temperature Termination Method
Temperature is the main cause of failure in a rechargeable cell, so it makes sense to monitor the cell temperature to determine when to shut off the charge to a battery. Three methods of charge termination, based on temperature, are common: maximum temperature cutoff, temperature difference, and temperature slope. The maximum temperature cutoff system is the easiest and cheapest to implement but the least reliable. Using a bimetallic thermal switch or a positive temperature coefficient thermistor, a simple, low-cost circuit can shut down a charging current at an appropriate temperature.
The temperature difference (DT) method measures the difference in ambient and cell temperatures to compensate for a cool environment. The DT method requires monitoring two temperature sensors, one for the battery temperature and one for the ambient temperature. This method may be unsuitable if the difference between cell and ambient temperature is very large.
The DT method can become unreliable with a quickly changing ambient temperature unless an equal thermal mass is attached to the ambient sensor. This means that the DT method is suitable for a primary charge termination at lower charge rates, up to C/5, if the ambient temperature is not going to change often. The DT method also provides an excellent backup charge termination scheme.
The temperature slope (dT/dt) method, a more sophisticated temperature termination scheme, measures the change in temperature over time. This method uses the slope of the battery temperature curve and, therefore, is less dependent on changes in ambient temperatures or in large differences between ambient and battery temperatures. Accurately adjusted to a particular pack, and with careful attention paid to the type and placement of the temperature sensor, the dT/dt method works very well. This method is suitable for charge rates up to 1 C and provides an excellent backup method.
9.10.1.1.2 Voltage Termination Methods
Four commonly available voltage termination methods are maximum voltage, negative delta voltage, zero slope, and inflection point. The maximum voltage (Vmax) method senses the increase in battery voltage as the battery approaches full charge. However, this is accurate only on a highly individualized basis. It is necessary to know the exact value at the voltage peak, otherwise the batteries may be over- or undercharged.
Temperature compensation also is required because of the negative temperature coefficient of battery voltage. The maximum voltage will increase if the batteries are cold, causing an undercharge because the charging voltage will reach the maximum voltage trip point early. If the batteries are hot, the maximum voltage may never be reached and the batteries will be cooked. Therefore, the Vmax method generally is not recommended for fast charge rates.
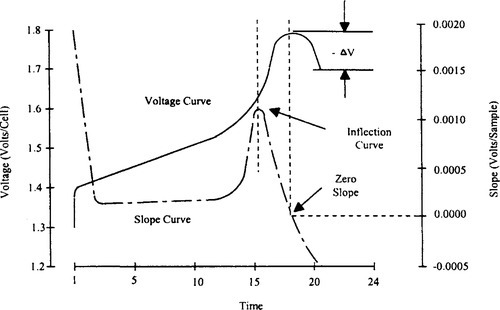
The negative delta voltage (−∆V) is the most popular fast charge termination scheme. It relies on the characteristic drop in cell voltage that occurs when a battery enters overcharge, as shown in Figure 9-17. With most NiCd cells, the voltage drop is a very consistent indicator and the − ∆V method is fine for charge rates up to 1 C. An inherent problem with this method is that the batteries must be driven into the overcharge region to cause the voltage decrease. Pressures and temperatures rise very rapidly at fast charge rates beyond 1 C. In cyclic applications, the battery must be able to endure that continual abuse.
Another concern is that cells like the NiMH types do not always have the characteristic decrease in voltage, compared to NiCd cells, as shown in Figure 9-10. This creates a problem of forward compatibility when moving from NiCd to NiMH cells. Most manufacturers of NiMH cells do not advocate the − ∆V method of charge termination.
The zero slope method monitors the point where the slope of the battery voltage reaches 0. This method is reliable for rapid charge rates up to 4 C and is less susceptible to noise on the voltage sense lines. However, a few types of batteries, such as the NiCd button cells, may have a voltage slope that never quite reaches 0. Therefore, the zero slope method is better suited as a backup method.
In the inflection point (dV/dt) method the system monitors the change in voltage over time and is the most sensitive indicator for preventing overcharge. The inflection point method relies on the changes in the voltage slope shown in Figure 9-17, which occur during charging and are an excellent primary termination method for up to 4 C charge rates.
The change in the voltage slope is an extremely reliable and repeatable indication of charge. It does not rely on a decrease in voltage, which may not always occur. Instead, this method looks for the flattening of the voltage profile as the battery reaches full charge. By monitoring the relative change in the steepness of the voltage slope, this method avoids having to use absolute numbers.
9.10.1.2 NiCd and NiMH Fast Charge Methods
Nickel-based batteries, such as the NiCd and NiMH types, have become the most popular choice for portable products. Although it is not correct to consider the NiCd and NiMH electrochemistry or charging regimens as interchangeable, they are similar enough to discuss together.
There is no one best way to fast charge a NiCd or NiMH battery. Variables introduced by the allowable cost and size of the application, the choice of charge termination method(s), and the specific battery vendor’s recommendations all influence the final choice of charging technique. Figure 9-18(a) shows the voltage, pressure, and temperature characteristics of a NiCd cell being charged at a 1 C rate. Figure 9-18(b) shows similar data for NiMH cell.
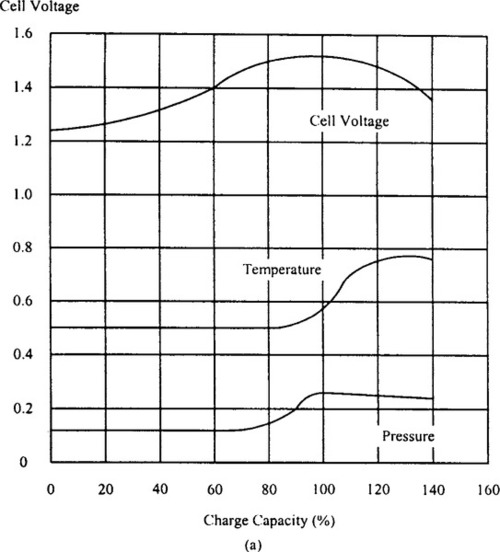
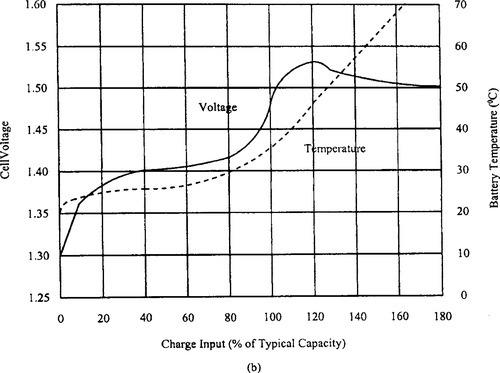
These curves illustrate the need for a reliable termination of the high-current portion of the charge cycle, and assist in understanding the various fast charge termination methods outlined in Table 9-5. For both types of electrochemistry, the ideal fast charge termination point is at 100–110% of the returned charge. The charging current is then reduced to the top-off value for 1–2 hours, to bring the cell to a state of slight overcharging.
This compensates for the inefficiencies of the charging process (e.g., heat generation). If the specific application will have the battery on standby for more than several weeks or at high temperatures, the top-off charge is followed by a continuous, low-level “trickle” charge to counter the self-discharge characteristics of NiCd and NiMH cells.
Under certain conditions, particularly following intervals of storage, a NiMH battery may give an erroneous voltage peak as charging commences. For this reason, the charger should deliberately disable any voltage-based charge termination technique for the first 5 minutes of the charging interval.
See Table 9-4 for representative charging recommendations. The most appropriate method should be selected in consultation with the manufacturer. Table 9-5 summarizes the fast charge termination methods for NiCd and NiMH cells.
Table 9-4
Representative charging recommendations for different batteries
| NiCd or NiMH | Sealed Lead Acid | Li-Ion | |
| Charging current | 1 C | 1.5 C | 1 C |
| Voltage per cell (V) | 1.80 | 2.5 | 4.20 ± 0.05 |
| Charging time (hours) | ~ 3 | ~ 3 | 2.5 − 5.0 |
| Method for optimum fast charge termination point | See Table 9-5 | Current cutoff | Typically a timer1 |
| Backup charge termination method | See Table 9-5 | Timer | — |
| Top-off rate | 0.1 C | 0.002 (trickle) | |
| Temperature range (°C) | 10–40° (NiCd) 15–30° (NiMH) | 0–30° | 0–40° |
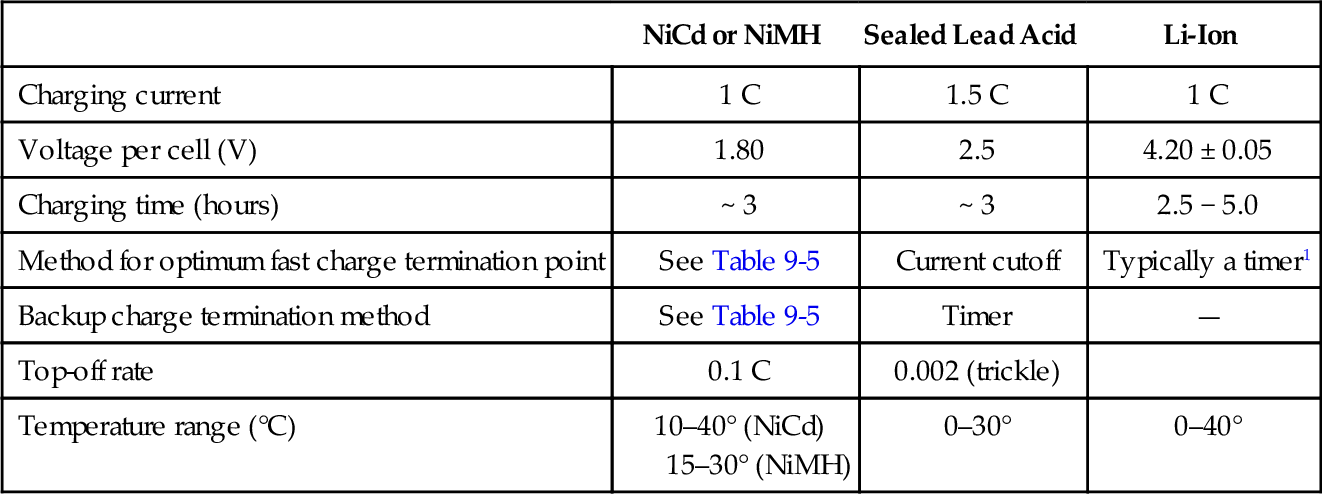
1 Depending on manufacturer’s recommendation.
Table 9-5
Fast charge termination methods for NiCd and NiMH batteries
| Charging Technique | Description |
| Negative delta voltage (−∆V) | Looks for the downward slope in cell voltage, which a cell exhibits ( |
| Zero ∆V | Waits for the time when the voltage of the cell under charge stops rising and is “at the top of the curve” prior to the downslope seen in overcharging. Sometimes preferred over − ∆V for NiMH, due to relatively small downward voltage slope of NiMH |
| Voltage slope (dV/dt) | Looks for an increasing slope in cell voltage (positive dV/dt), which occurs somewhat before the cell reaches 100% returned charge (prior to the zero ∆V point) |
| Inflection point cutoff (d2V/dt2) | As a cell approaches full charge, the rate of its voltage rise begins to level off. This method looks for a 0 or, more commonly, slightly negative value of the second derivative of cell voltage with respect to time |
| Absolute temperature cutoff | Uses the cell’s case temperature (which will undergo a rapid rise as the cell enters high-rate overcharging) to determine when to terminate high-rate charging. A good backup method, it is too susceptible to variations in ambient temperature to make a reliable primary cutoff technique |
| Incremental temperature cutoff (∆ TCO) | Uses a specified increase in the cell’s case temperature, relative to the ambient temperature, to determine when to terminate high-rate charging. It is a popular, relatively inexpensive and reliable cutoff method |
| Delta temperature/delta time (∆T/∆t) | Uses the rate of increase of a cell’s case temperature to determine the point at which to terminate the high-rate charge. This technique is inexpensive and reliable once the cell and its housing have been properly characterized |
9.10.1.3 Sealed Lead-Acid Batteries
Unlike nickel-based batteries, sealed lead-acid batteries are charged using a “constant-potential” (CP) regimen. CP charging employs a voltage source with a deliberately imposed current limit (a current-limited voltage regulator). A significantly discharged battery undergoing CP charging initially will attempt to draw a high current from the charger. The current-limiting function of the CP regimen keeps the peak charging current within the battery’s ratings.
Following the current-limited phase of the charging profile, a sealed lead-acid battery exposed to a constant voltage will exhibit a tapering current profile, as shown in Figure 9-19. When the returned charge reaches 110–115% of the rated capacity, allowing a dischargeable capacity of 100% of nominal, the charge cycle is complete.

The specifics of fast charging sealed lead-acid batteries are more vendor dependent than those of NiCd or NiMH units. The information in Table 9-4 uses data from GS Battery Inc. The primary termination method, current cutoff, looks at the absolute value of the average charging current flowing into the battery.
When that current drops below 0.01 C, the battery is fully charged. If it will be in standby for a month or more, a trickle current of 0.002 C should be maintained. The backup termination method, according to the vendor’s recommendations, should be a 180 minute time out on the charging cycle (Schwartz, 1995).
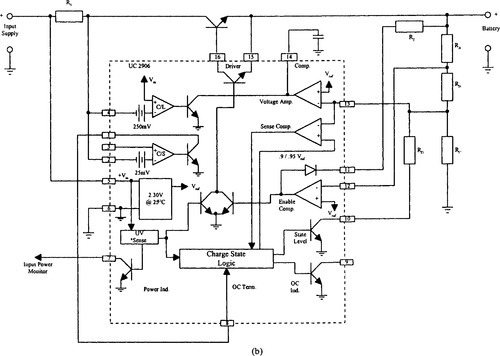
To satisfy more stringent charge control recommendations, where the battery temperature, voltage, and current need to be sampled, many dedicated charge controller ICs are available. The bq2031 lead-acid fast charge IC from Benchmarq Microelectronics Inc. and UC3906 (sealed lead-acid charger) from Unitrode Integrated Circuits are examples.
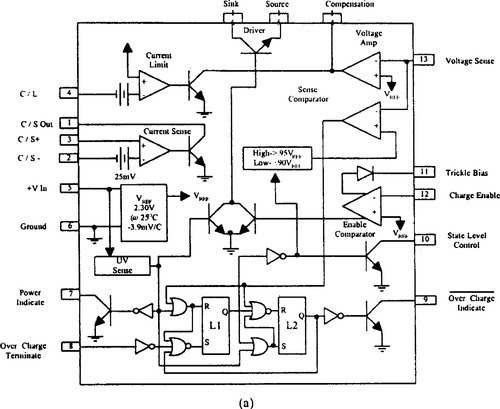
The UC3906 battery charger controller contains all the necessary circuitry to optimally control the charge and hold the cycle for sealed lead-acid batteries. These integrated circuits monitor and control both the output voltage and current of the charger through three separate charge states: a high-current bulk-charge state, a controlled overcharge, and a precision float charge or standby state. Figure 9-20 is a block diagram and one implementation of the UC3906 in a dual-step current charger. Sacariesen and Parvereshi (1995) and Unitrode Application Note U-104 provide details about charge control in sealed lead-acid batteries using the UC3906.
9.10.1.4 Lithium-ion Chargers
Li-ion batteries require a constant potential charging regimen, very similar to that used for lead-acid batteries. Typical recommendations for Li-ion fast charging are listed in Table 9-4. As with lead-acid batteries, a Li-ion cell under charge will reduce its current draw as it approaches full charge.
If the cell vendor’s recommendation for charging voltage (generally 4.20 V ± 50 mV at 23 °C) is followed, the cells will be able to completely recharge from any “normal” level of discharge within 5 hours. At the end of that time, the charging voltage should be removed. Trickle current is not recommended.
If the voltage on a Li-ion cell falls below 1.0 V, recharging should not be attempted. If the voltage is between 1.0 V and the manufacturer’s nominal minimum voltage (typically, 2.5 − 2.7 V), it may be possible to salvage the cell by charging it with a 0.1 C current limit until the voltage across the cell reaches the nominal minimum, followed by a fast charge.
Due to the special characteristics of Li-ion batteries, most manufacturers incorporate custom circuits into their battery packs to monitor the voltage across each cell within the battery and provide protection against overcharging, battery reversal, and other major faults. These circuits are not to be confused with charging circuits. For example, the MC 33347 protection circuit is such a monolithic IC from Motorola (Alberkrack, 1996).
9.10.2 End-of-Discharge Determination
Determination of the point at which a battery has delivered all of its usefully dischargeable energy is important to the longevity of the cells that form that battery. Discharging a single cell too far often will cause irreversible physical damage inside the cell.
If multiple cells are placed in series, unavoidable imbalances in their capacities can cause the phenomenon known as cell reversal, in which the higher-capacity cells force a backward current through the lowest-capacity cell. Knowing the end-of-discharge (EOD) point provides a “zero capacity” reference for coulometric gas gauging.
The actual determination of the EOD point typically is done by monitoring cell voltage. For the most accurate determination of the EOD when the load is varying, correction factors for the load current and the battery’s state of charge should be applied, especially to lead-acid and Li-ion batteries. The essentially flat discharge profiles of NiCd and NiMH make these corrections a matter of user discretion for most load profiles. Table 9-6 shows voltages commonly used to indicate the end-of-discharge point for the four battery types.
Table 9-6
Typical end-of-discharge voltages
| Cell Type | EOD Voltage (V) | Comments |
| Lead acid | 1.35–1.9 (1.8 typical) | Dependent on loading, state of charge, cell construction, and manufacturer |
| NiCd | 0.9 | Essentially constant |
| NiMH | 0.9 | Essentially constant within recommended range of discharge rates |
| Li-ion | 2.50–2.70 | Dependent on manufacturer, loading, and state of charge |
9.10.3 Gas Gauging
The gas gauging or fuel gauging concept discussed here does not refer to the gases that may evolve by the battery reactions but rather to the concept of the battery as a fuel tank powering the product. Gas gauging, therefore, involves a real-time determination of a battery’s state of charge, relative to the battery’s nominal capacity when fully charged.
It is possible to make an inexpensive and moderately useful state of charge measurement from a simple voltage reading, if the battery being used has a sloping voltage profile. Hence, Li-ion batteries and, to a lesser extent, sealed lead-acid batteries, should be amenable to such an approach. In practice, the results are less than optimal: Cell voltages depend on loading, internal impedance, cell temperature, and other variables.
This reduces the attractiveness of the battery voltage method of gas gauging; and that it is unsuitable for NiCd or NiMH batteries, due to their essentially flat voltage profile, makes it commercially untenable. A clever and effective alternative is the “coulometric” method.
Coulometric gas gauging, as its name implies, meters the actual charge (current × time) going into and out of the battery. By integrating the difference of current in and current out, it is possible to determine the charge status of the battery at any given time. There are real-world details, of course, that must be observed in the actual implementation of such a gas gauge; some of the most important of these are:
1. It is necessary to have an accurate starting point for the integrator, corresponding to a known state of charge in the battery. This problem often is resolved by zeroing the integrator when the battery reaches its EOD voltage.
2. It is necessary to compensate for the temperature. The actual capacity of lead-acid batteries increases with temperature, that of nickel-based batteries decreases as battery temperature rises.
3. Appropriate conversion factors should be applied for the particular charge regimen and discharge profile used. Under conditions of highly variable battery loading, dynamic compensation may be advisable.
9.10.4 Battery Health
With battery health defined as a battery’s actual capacity relative to its rated capacity, the health of the battery can be determined and maintained in three steps:
1. Discharge the battery to the EOD point, preferably into a known load.
2. Execute a complete charge cycle, while gas gauging the battery.
3. Compare the battery’s measured capacity to its rated capacity.
This sequence will simultaneously “condition” the battery (e.g., overcome the so-called memory effect of capacity of NiCd batteries) and indicate the capacity of the battery after conditioning. This information can be used to ascertain whether the battery is in good shape or approaching the end of its useful life.
9.11 The System Management Bus, Smart Battery Data Specifications, and Related Standards
In the mid 1990s, new industry standards were proposed to standardize the battery and power management subsystems within portable products. The following standards were proposed:
1. System Management Bus (SMB) Specification.
2. Smart Battery Data Specification.
3. Smart Battery Charger Specification.
4. Smart Battery Selector Specification.
These specifications form the Smart Battery Systems Specification, which presents a solution for many of the issues related to batteries used in portable equipment such as laptop computer systems, cellular telephones, and video cameras. Fundamental to the system is the concept that the battery contains all the necessary components to determine the battery’s state of charge, predict the time to full and empty charging, specify the charging voltage and current, and determine when the battery is fully charged or fully discharged.
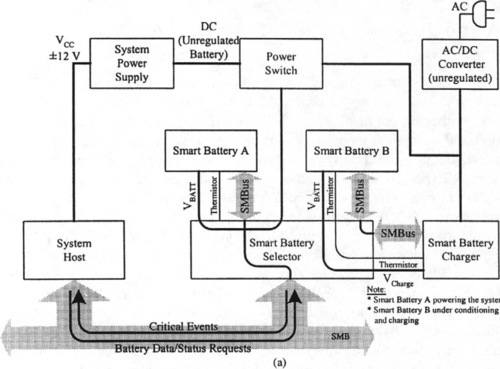
A typical smart battery system is shown in Figure 9-21(a). It consists of an AC/DC converter (unregulated), power switch, system power supply, smart battery charger, and smart battery selector, all of which communicate with the system host and the system elements themselves via the SMB. In this case, smart battery A powers the system while smart battery B is getting conditioned or charged.
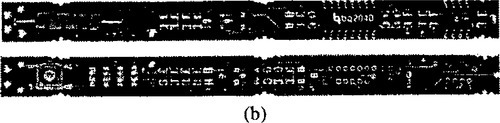

The system management bus is a two-wire interface through which simple power-related chips can communicate with the rest of the system. It uses I2C as its backbone (Paret & Fenger, 1997). A system using an SMB passes messages to and from devices instead of tripping individual control lines. Removing the individual control lines reduces the pin count. Accepting messages ensures future expandability. With a system management bus, a device can provide manufacturer information, tell the system its mode or part number, save its state in case operation is suspended, report different types of errors, accept control parameters, and return its status. The SMB may share the same host device and physical bus, as long as an appropriate electrical bridge is provided between the respective devices. Benchmarq et al. (1995a) provides details related to communication protocols available for use by devices on an SMB. Using gas gauge ICs such as the bq2092 or bq2040, Benchmarq provides a complete smart battery module such as its bq219XL (Figure 9-21(b)). Designed for battery pack integration, the bq219XL combines the bq2092 or bq2040 gas gauge IC with a serial EEPROM on a small printed circuit board. This smart battery module provides a complete solution for the design of intelligent battery packs using the SMB protocol and supports the smart battery data (SBD) commands in the SMB/SBD specifications. The board includes all the necessary components to accurately monitor battery capacity and communicate critical battery parameters to the host system or battery charger. The bq219XL also includes four LEDs coupled with a push-button switch to activate the LEDs to show remaining battery capacity in 25% increments.
Contacts are provided on the bq219XL for direct connection to the battery stack (B+, B−) and the two-wire interface (C, D). For further details on the operation of the gas gauge and communication interface refer to the bq2092 or bq2040 data sheets. A tutorial on the bq2040 for battery system designers is provided in Benchmarq (1998a).
For mobile communication products, the full-function SMB architecture is too costly and hence the SBS implementer’s forum is attempting to develop a specification that meets the needs of the market by eliminating many advanced features (Heacock, 1998).
A complete description of SBS standards and implementation is beyond the scope of this introductory chapter; for further details, see Benchmarq et al. (1995a, 1995b, 1996a, 1996b), Dunstan (1995), and Heacock (1998).
9.12 Semiconductor Components for Battery Management
In practical systems, rechargeable batteries could be charged using a variety of components, from simple voltage regulator ICs to microprocessor-based systems (Kerridge, 1993). Specially designed battery-management ICs provide fine control and a useful indication of a battery’s charge condition both on and off charge.
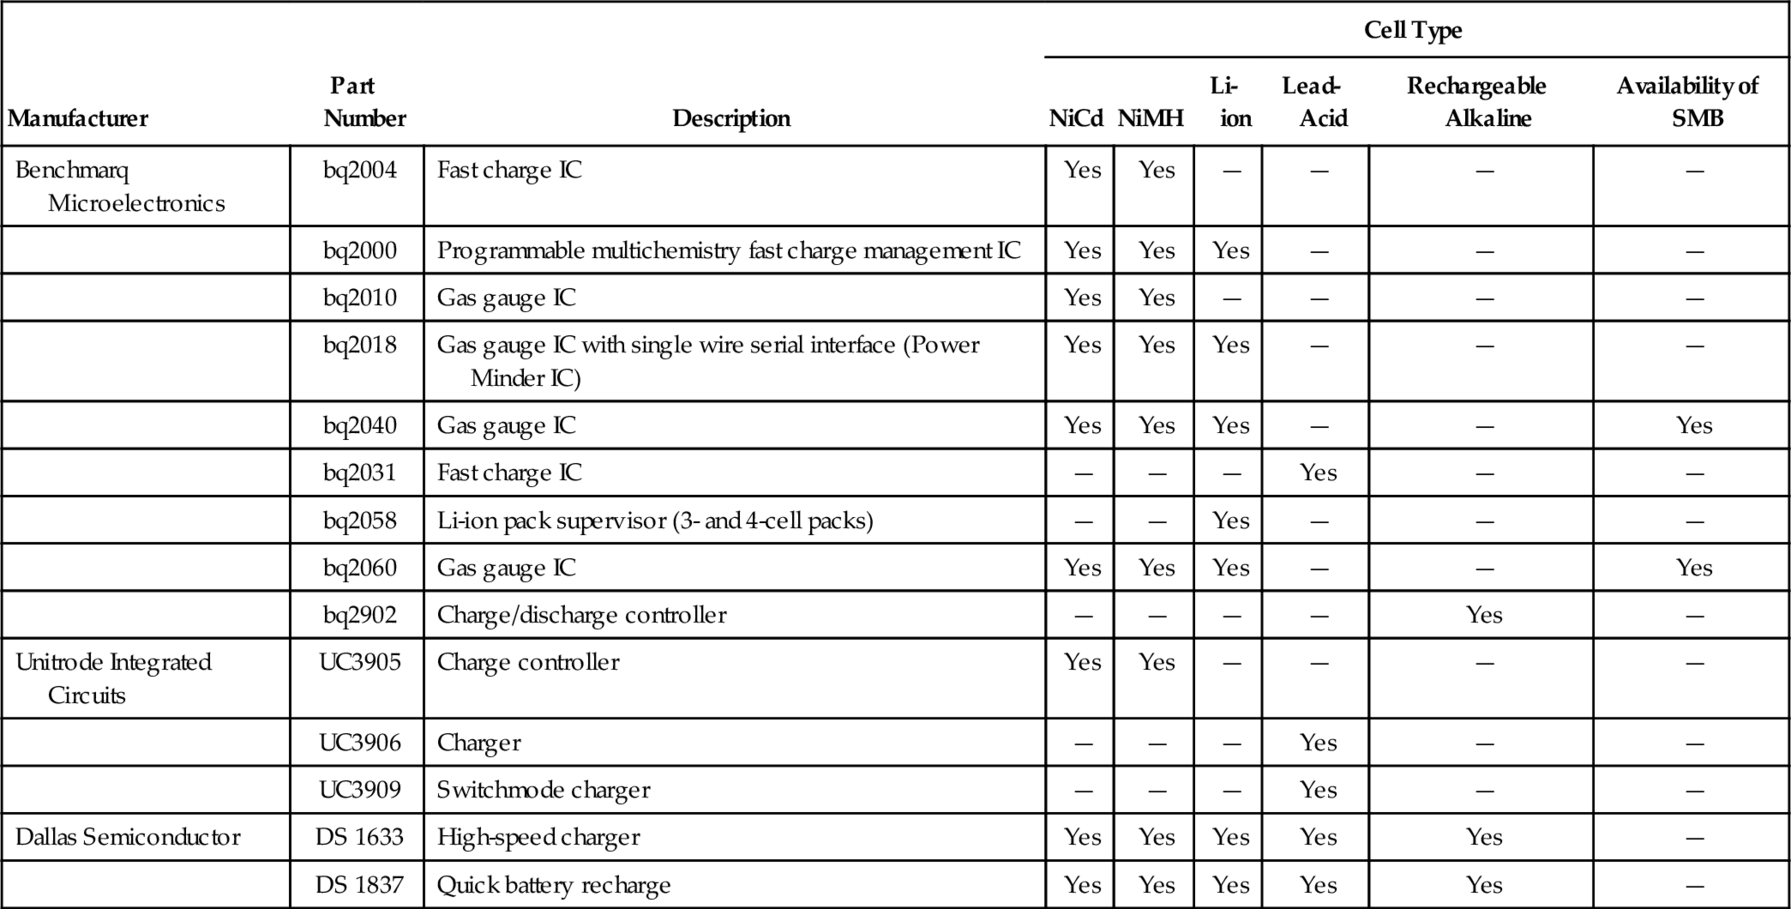
Battery voltage, charge/discharge current, and cell case temperature supply the clues to information about battery-management ICs. However, each clue is the result of a chain of events far removed from the chemical reaction necessary to monitor and control. Further complexities arise because the three properties interact. Further, instantaneous measurements of any of the three attributes are virtually useless; all battery-management ICs include some sort of time to add meaning to the data. Table 9-7 shows some representative battery-management ICs from Benchmarq, Unitrode, and Dallas Semiconductor.
Table 9-7
Battery-management integrated circuits
| Manufacturer | Part Number | Description | Cell Type | |||||
| NiCd | NiMH | Li-ion | Lead-Acid | Rechargeable Alkaline | Availability of SMB | |||
| Benchmarq Microelectronics | bq2004 | Fast charge IC | Yes | Yes | — | — | — | — |
| bq2000 | Programmable multichemistry fast charge management IC | Yes | Yes | Yes | — | — | — | |
| bq2010 | Gas gauge IC | Yes | Yes | — | — | — | — | |
| bq2018 | Gas gauge IC with single wire serial interface (Power Minder IC) | Yes | Yes | Yes | — | — | — | |
| bq2040 | Gas gauge IC | Yes | Yes | Yes | — | — | Yes | |
| bq2031 | Fast charge IC | — | — | — | Yes | — | — | |
| bq2058 | Li-ion pack supervisor (3- and 4-cell packs) | — | — | Yes | — | — | — | |
| bq2060 | Gas gauge IC | Yes | Yes | Yes | — | — | Yes | |
| bq2902 | Charge/discharge controller | — | — | — | — | Yes | — | |
| Unitrode Integrated Circuits | UC3905 | Charge controller | Yes | Yes | — | — | — | — |
| UC3906 | Charger | — | — | — | Yes | — | — | |
| UC3909 | Switchmode charger | — | — | — | Yes | — | — | |
| Dallas Semiconductor | DS 1633 | High-speed charger | Yes | Yes | Yes | Yes | Yes | — |
| DS 1837 | Quick battery recharge | Yes | Yes | Yes | Yes | Yes | — | |
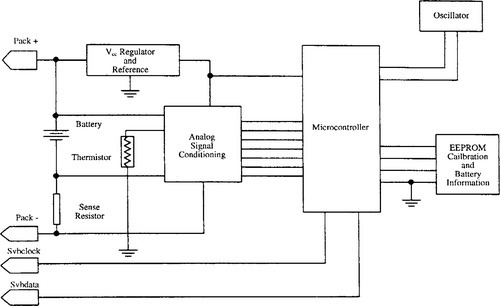
There are many means of providing a complete universal battery management system. Years ago, most companies involved in the design of chargers for battery banks had design resources dedicated internally to provide such solutions. Today, with the rapid changes in rechargeable battery chemistry and the associated charge/discharge management requirements, many companies prefer to use standardized semiconductor components dedicated to this function. Two possible approaches involve using a customized microcontroller or an ASIC dedicated to battery management. Figure 9-22 is the block diagram of a microcontroller-based universal battery monitor.
Using ASIC solutions, such as bq2010 from Benchmarq Microelectronics, the standby current necessary for battery monitoring circuits can be minimized while providing many gas gauge functions. A block diagram of the bq2010 forms Figure 9-23(a).

Specialized component manufacturers recently introduced many gas gauge ICs for multichemistry (NiCd/NiMH/Li-ion) environments (Freeman, 1995; Benchmarq, 1997).
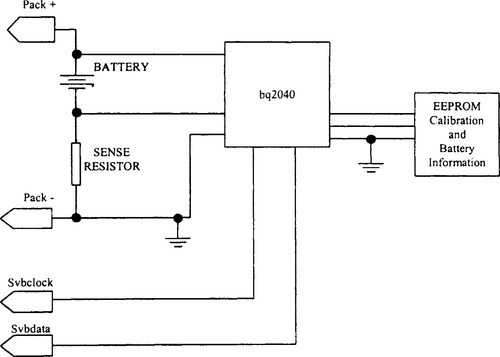
VLSI components such as the bq2040 with an SMB interface are intended for battery-pack or in-system installation to maintain an accurate record of available battery charge. In addition to supporting the SMB protocol, it supports smart battery data specification, rev. 1.0 (Dunstan, 1995; see Figure 9-24). Another example is Linear Technology Corporations’ LTC® 1325 battery management IC, which provides a complete system that can accommodate all plausible types of electrochemistry and their concomitant charging needs and charge termination algorithms, with few or no hardware changes for different battery types.
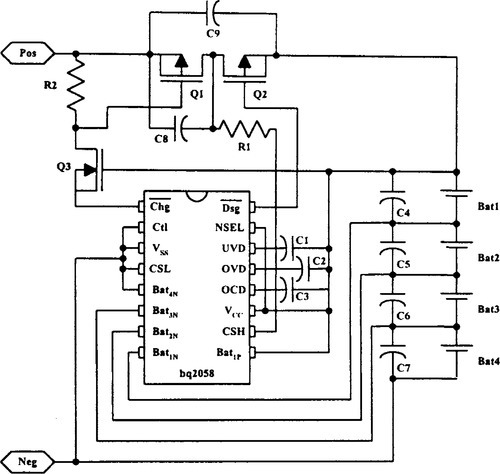
The two critical aspects of battery management for Li-ion cells are charge control and pack safety protection. The fundamental purpose of the safety circuitry is to protect the Li-ion cells from abusive conditions. Figure 9-25 illustrates the basic concept of a protection circuit using the bq2058. The control IC monitors each series potential in the pack for overvoltage (charge), undervoltage (discharge), and overcurrent conditions. The three thresholds are set to match the requirements of the manufacturer and Li-ion battery type. For further details on this circuit, the bq2058 data sheet is suggested. In designing Li-ion battery management systems, temperature effects must be carefully considered (Fundaro, 1998).