
12-12. Debugging Stored Code
Problem
One of your stored procedures contains logical errors, and you want to use Oracle SQL Developer to help you find the cause.
Solution
A few different options are available for debugging stored code within Oracle SQL Developer. The environment includes a complete debugger that provides the ability to set breakpoints within the code and modify variable values at runtime to investigate a problem with your code. There are several ways to invoke the debugger for a particular piece of code. When a code object is opened within the editor, the toolbar will contain a red “bug” icon that can be used to invoke the debugger (Figure 12-39).
Figure 12-39. Debugger icon
The right-click contextual menu within the navigator also contains a Debug option for procedures and packages (Figure 12-40).
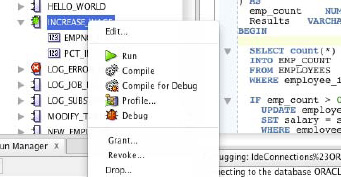
Figure 12-40. Debugger option in Navigator
How It Works
Using the debugger is a great way to find issues with your code. The debugger enables the application to halt processing at the designated breakpoints so that you can inspect the current values of variables and step through each line of code so that issues can be pinpointed. Debugging PL/SQL programs is a multistep process that consists of first setting breakpoints in code, followed by compiling the code for debug, and lastly running the actual debugger. To use the debugger, the user who is running the debugger must be granted some database permissions. The user must be granted the DEBUG ANY PROCEDURE privilege to have debug capabilities on any procedure or DEBUG <procedure name> to allow debugging capabilities on a single procedure. The DEBUG CONNECT SESSION privilege must also be granted in order to allow access to the debugging session.
After a user has been granted the proper permissions for debugging, the next step is to place a breakpoint (or several) into the code that will be debugged. For the purposes of this recipe, the INCREASE_WAGE procedure will be loaded into the procedure editor, and a breakpoint will be set by placing the mouse cursor on the left margin of the editor window next to the line of code that you want the debugger to pause execution at. Once the cursor is in the desired location, click in the left margin to place the breakpoint. Figure 12-41 shows a breakpoint that has been placed at the beginning of a SELECT statement within the INCREASE_WAGE procedure.
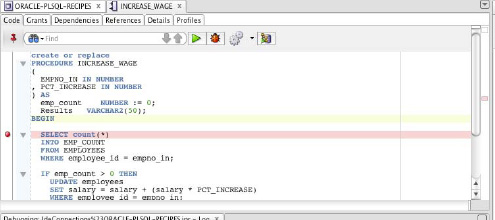
Figure 12-41. Setting a breakpoint
After one or more breakpoints have been placed, the code needs to be compiled for debug. To do so, use the icon in the editor toolbar for compiling, and select the Compile for Debug option. Once the code has been compiled for debug, its icon in the navigator will adopt a green bug to indicate that it is ready for debugging (Figure 12-42).
Figure 12-42. Code ready for debug
Next, the debugger can be started by selecting the debug icon within the editor or by right-clicking the code within the navigator and selecting the Debug option. If the user who is debugging the code does not have appropriate permissions to debug, then error messages such as those shown in Figure 12-43 will be displayed.
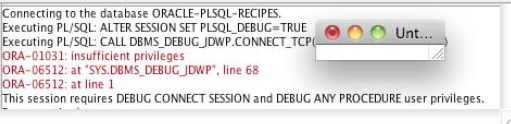
Figure 12-43. User not granted necessary permissions
Assuming that the user has the correct permissions to debug, the Debug PL/SQL window will be displayed. This window provides information about the code that is being debugged including the target name, the parameters, and a PL/SQL block that will be executed in order to debug the code. The code that is contained within the PL/SQL block portion of the screen can be modified so that the parameters being passed into the code (if any) can be set to the values you choose (Figure 12-44). In Figure 12-44, the values have been set to an EMPNO_IN value of 10 and a PCT_INCREASE value of .03.
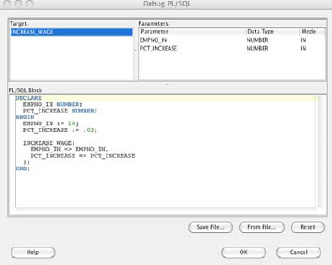
Figure 12-44. Debug PL/SQL window
Once the Debug PL/SQL window has been completed with the desired values, click OK to begin the debugger. This will cause Oracle SQL Developer to issue the DBMS_DEBUG_JDWP.CONNECT_TCP (hostname, port) command and start the debugging session. The debugger will start, and it will provide a number of different options, allowing you to step through the code one line at a time and see what the variable values are at any given point in time. You will see three tabs on the debugger: Data, Smart Data, and Watches. The Data tab is used for watching all the variables and their values as you walk through your code using the debugger. The Smart Data tab will keep track of only those variables that are part of the current piece of code that is being executed. You can set watches to determine which variables that you would like to keep track of track of. The inspector can be used to see the values within those variables you are watching. You are also given the very powerful ability to modify the values at runtime as the code is executing. This provides the capability of determining how code will react to different values that are passed into it.
The Oracle SQL Developer debugger is a useful tool and provides an intuitive user interface over the DBMS_DEBUG_JDWP utility. Although this recipe covers only the basics to get you started, if you spend time using each feature of the debugger, then you will learn more powerful ways to help you maintain and debug issues found in your code.